 RSS Feed
 by Calculated Risk on 4/08/2005 07:24:00 PM
Friday, April 08, 2005
Oil Imports as % of GDP
Dr. Altig's graph this morning compared US energy production and consumption (in BTUs) divided by real GDP. Altig defines the difference between consumption and production as our energy dependence. The following graph shows another measure of energy dependence.
Click on graph for larger image.
This graph shows the nominal dollar value of oil imports as a percent of nominal GDP. The data is from the Census Bureau's U.S. Imports of Crude Oil and only goes back to 1973.
For 2004, oil imports were 1.13% of GDP, the highest level since 1982. I plotted three alternatives for 2005: $40 oil, $50 oil and $60 oil. It is important to note that the average contract price paid for oil is usually $5 to $10 below the spot prices. With Oil priced at $53.32 per barrel today, the average import contract price is probably in the mid to high $40s.
For GDP in 2005, I assumed a nominal increase of 6%.
From this chart, $60 oil would be 1.9% of GDP, just below the peak years of 1980 (2.22%) and 1981 (1.98%). For $50 oil, imports would be 1.59% of GDP.
To reach the record 2.22%, with 6% nominal GDP growth, the average price of imported oil would have to be $69 per barrel. Of course we had a recession in 1980, and $60+ imported oil would probably slow GDP growth in 2005 too. With slower growth, oil imports would reach the record as a percentage of GDP somewhere in the mid to low $60s.
Thursday, April 07, 2005
DOE: Short-Term Energy Outlook
by Calculated Risk on 4/07/2005 04:39:00 PM
The Department of Energy released their Short-Term Energy Outlook today. The DOE is now projecting monthly average gas prices to peak at about $2.35 per gallon in May. That probably means around $2.60 per gallon for regular unleaded in California. 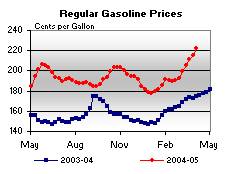
This graph from the DOE shows average US gas prices for the last 2 years.
The average U.S. price right now for regular grade gasoline is $2.22. California is $2.46. So the DOE is expecting approximately another $0.13 increase over the next 30 days.
For crude oil: WTI prices are projected to remain above $50 per barrel for the rest of 2005 and 2006.  The second graph (DOE slide 3) shops the DOE predictions. Bear in mind that every month, for almost a year, the DOE has projected oil prices to flatten or decrease, and every month prices have exceeded their base case expectations.
The high end of the DOE's projected range for the next two years (95% confidence) is $65 per barrel (WTI) and the low end is $45 per barrel.
Click on graph for larger image.
The third graph(DOE slide 4) shows the DOE's expected increase in World demand for crude oil in 2005 and 2006.
The DOE is expecting world oil demand to grow 2.7% in 2005 and 2.5% in 2006, compared to 3.3% in 2004. With worldwide demand at over 80 million bbd, a 2.7% increase would add 2.2 million bbd. So when OPEC announces they are adding 0.5 million bbd that is just a portion of the expected demand increase.
From a previous post on the oil situation: Both the supply and demand curves for oil are very steep. We all know this intuitively. If there is little unused capacity, it takes time for more oil production to become available since this involves huge capital intensive projects. And, in the short term, demand is fairly inelastic over a wide range of prices; for the most part people stay with their routines and keep their same vehicle. With two steep curves (supply and demand) we get the following: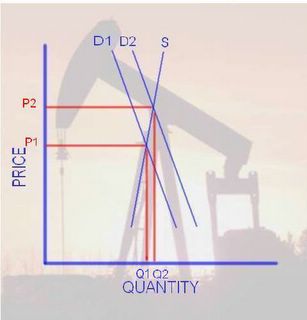
With a small increase in Demand (from D1 to D2), we see a small increase in Quantity (Q1 to Q2), but a large change in Price (from P1 to P2). Also a large price increase would occur if we had a small decrease in supply such as disruption to production, transport or refining (like hurricane Ivan in the GOM last year).
Of course the opposite is also true. A relatively small decrease in demand (or increase in supply) would cause a significant drop in price. If the DOE’s estimate of demand is correct, we will probably continue to see high energy prices.
No wonder the IMF warned today on the risk of a "permanent oil shock". From the FT article:
Raghuram Rajan, IMF chief economist, said: “We should expect to live with high oil prices.”Sorry for all the gloom and doom lately. At least the price of oil was off a little today.
“Oil prices will continue to present a serious risk to the global economy,” he added.
“The shock we see is a permanent shock that is going to continue... and countries need to adjust to that,” said David Robinson, deputy IMF chief economist.
UPDATE:
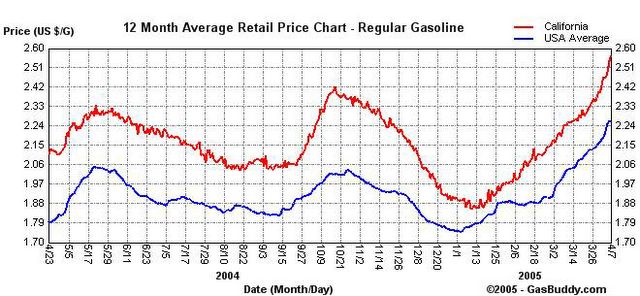
This graph shows the average price of regular unleaded in California and the US for the last 2 years. The graph is from GasBuddy. Give it a try for prices in your area (by state or city). Thanks to Jim Teter!
Note that the DOE prices were for April 4th ($2.22 for US, $2.46 for California). This graph shows that prices have climbed over the last 3 days, especially in California.
UPDATE 2:
Kash at Angry Bear has an interesting chart tracking economists' predictions, "Oil Prices and Recession".
Dave at Macroblog also has an interesting post "Energy Prices: Not The 1970s Redux (?)" on oil today.
With all this commentary, does that mean prices have peaked?
Housing Bubble: Foreclosures up 57%, Mostly Non-Bubble States
by Calculated Risk on 4/07/2005 12:30:00 AM
In a new report, U.S. foreclosures are up 57% from March 2004.
"The hardest hit states: Ohio, Texas, Michigan and Georgia, with more than 2,300 new foreclosures each."What is interesting is these are the non-bubble states according to an analysis by Richard J. DeKaser, Chief Economist at National City Corporation. Borrowers in these non-bubble states are getting in trouble first, probably because of job losses (their local economies are not as strong as the bubble states without the booming RE business) and they were not able to extract as much equity during the refinancing boom. The article cited higher interest rates and job losses:
Non-mortgage debt may help explain the troubling trend, [Marquette University economist David E. Clark] said. Most consumers opt for fixed-rate mortgages and thus are immune to rising interest rates, Clark noted. But their credit cards and home equity lines of credit carry variable interest rates - rates that have climbed in recent weeks.I am not surprised that the non-bubble states are seeing the impact of the housing slowdown first. But I think the real problem will start when the bubble states see a slowdown and a drop in transaction volumes.
"These (easy credit avenues) may have allowed people to get in rather dire straits financially, get overextended, and this is the final chapter of that process," Clark said.
Jim Houston, vice president with Foreclosure.com, said March's figures involve "the highest spike we've ever seen" in new foreclosures.
UPDATE: Here is the foreclosure.com press release with numbers by state.
Wednesday, April 06, 2005
Talk of the Nation: Schiller on Real Estate
by Calculated Risk on 4/06/2005 07:27:00 PM
Robert Schiller, Yale economics professor and author of "Irrational Exuberance" was on NPR's Talk of the Nation today. Click on listen.
A few Schiller quotes:
"In a sense the irrational exuberance never left the housing market. The housing market started to boom in the late '90s and it continues to go up. It wasn't interrupted by the earnings drop that we saw in stocks in 2001. It has just kept going."How much overvalued is the Real Estate market?
"I think its one of the amazing facts about statistics and econometrics that no one had collected a long time series of home prices in the U.S.. How can you get perspective about whether there are bubbles or not, if no one collects the data?
What I did is I went back and I found various fragmentary home price indexes that kept quality constant and linked them together and added, filled a gap. So I have a series back to 1890. When I plotted that I was quite surprised to see what happened.
The U.S. has basically has never been in a bubble like the one we are in now, with the possible exception of the period right after WWII when the soldiers came home and were bidding up home prices. It is a very rare phenomenon. So people who claim to have done statistical analysis - they can't have done it, they haven't had the data!"
"Some of these people will realize that their mortgage is worth - that the debt is greater than the value of the house and they will walk away. They will say that 'I'm making payments, huge payments on this house and its not even worth what I'm owing". If, as I expect, in many places prices will fall, defaults on mortgages will go up. There will be some disruption in people's lives."
"That varies very much by city. We looked at ratios of median home price to per capita personal income. We find that in many places in the U.S. that is only about 2, the median home is only like 2 years income or 3 years income. But in other cities it is 10 years income. So - I think that is getting a little - more than a little high. What supports it? Why would you live in a city were homes cost 10 years income, when you can live in a city were they cost 3 years income or 2 years income? You might say some cities are better than others and they have better job opportunities than others. But I think they are a bit overrated."In answer to a question:
"Miami had one of the most famous home price bubbles in 1925. In that year people began to think that land was running out in Florida and that you'd better buy now or it will be too late. Promoters started traveling all over the country and people started flowing in - there was a huge immigration into Florida at that time - but then the bubble burst in 1926. And it didn't rekindle in Florida until recently.
I think what is happening in Florida then and now are similar. Its a glamour story, a story of excitement, a story that land is running out that suddenly becomes prominent in people's minds."
Much more in interview. Enjoy!
World Bank: Economic Recovery Globally Has 'Peaked'
by Calculated Risk on 4/06/2005 11:04:00 AM
The World Bank warned Wednesday that the global economic recovery has "peaked" and said the severity of the coming slowdown will depend on the extent to which foreign investors lose their nerve about buying U.S.-dollar-denominated assets.And more:
"The global economy is at a turning point," said Francois Bourguignon, the bank's chief economist, in a foreword to the report. "Growth has peaked, and pressures to address global imbalances are growing, exposing important risks facing both developed and developing countries as the needed adjustments occur."
The bank said its best-case scenario calls for a mild slowdown in global economic growth over the next few years. The annual growth rate of gross domestic product, 3.8% in 2004, is likely to drop to 3.1% this year and hover about that level through 2007. Among developing countries, the rate is likely to slip from 6.6% last year to 5.7% in 2005, and 5.2% in 2006.
Still, the bank said, a new global recession is a possibility. "A reduction in the pace at which central banks are accumulating dollars, a weakening in investors' appetite for risk, or a greater-than-anticipated pickup in inflationary pressures could cause interest rates to rise farther than projected, providing a deeper-than-expected slowdown or even a global recession," it said.
The R word is starting to raise its ugly head. I'll be back to the Mug's game soon.


