 RSS Feed
 by Calculated Risk on 2/22/2005 12:12:00 AM
Tuesday, February 22, 2005
A Recovery Built on a Marshland of Debt?
UPDATE:I've received a number of questions about these charts. Thanks to everyone! The first chart is from Barrons (I didn't check the numbers). However the numbers are from this Federal Reserve source: Debt growth, borrowing and debt outstanding tables
Here is what I get (Billions):
Government Debt:
Federal $4317
Trust Fund $3200
State $1670
TOTAL Government $9187
Household Debt:
Mortgage $7261
Consumer Credit $2124
TOTAL Household $9949 (Doesn't add up, must include some small items)
Business Debt: $7671
Financial Sectors: $11,674
TOTAL DEBT: ~$38 Trillion. GDP rate (based on Q4, 2004) is $11,967 Billion.
I agree that some of consumer debt (credit cards) might be double counted. The Financial Sectors debt is also interesting. This is primarily for intermediation so it is probably double counted too.
However, my concern with the burgeoning debt load was primary with the National Debt and the Mortgage debt component of household debt. Both have increased significantly over the last 4 years. These are the components that contribute to the "recovery built on a marshland of debt".
I will try to post some more information on the National Debt (and the structural deficit) and mortgage debt in the next few days.
Best Regards to All! And thanks for the feedback.
Orginal Post:
When discussing Greenspan's Interest Rate Conundrum, I concluded:
"I think the PRIMARY reason for Greenspan's conundrum is that the economy is weaker than it appears. Using GDP growth and unemployment, the US economy is healthy. But the level of debt (both consumer and government), the real estate "boom" that seems based on leverage and loose credit (see Volcker's recent comments), and the poor employment situation (especially the low level of participation) indicate an unhealthy economy. I believe this recovery is being built on a marshland of debt and the bond market is reflecting this weakness."
So here is the story in pictures: First from Barrons (via infoproc):
Source: Barrons

"The accompanying chart, which comes to us by grace of Trey Reik, of Clapboard Hill Partners, a New York-based investment outfit, shows one of the singular effects of Mr. Greenspan's eagerly accommodating reign at the Fed. It tells the story of credit in this fair land from 1916 through the present. Keeping in mind that Mr. G took over in 1987, you can readily see the trajectory picks up altitude abruptly from then until now.
Mr. Reik observes that for the past 100 years, the nation's credit-market debt has averaged between 140% and 160% of gross domestic product. The principal exceptions came in 1929, when the stock market went bananas, and in 1933, during the traumatized period that followed the Great Crash, when four years of the Depression (GDP shrank by an awesome 45%) hoisted the ratio to 287%, prompting a devaluation of the dollar. That was the all-time peak, never approached again until the remarkable rise that began in the 1980s and has resolutely continued ever since, lifting the ratio to today's astonishing 304%."
And the following chart from mwhodges compares the increase in debt vs. National Income. A close examination shows that America's Debt binge accelerated in the early '80s and then subsided only to skyrocket again during the last four years.
Source: http://mwhodges.home.att.net/

Much of this data comes from the Federal Reserve's Flow of Funds report. One of the key reports is the Debt Growth by Sector. As an example, mortage debt has grown from $313 Billion in 1971 to $7.3 Trillion at the end of Q3 2004. Consider this table (all nominal dollars):
Year...Mortgage Debt..% of GDP
1971...$313 Billion....28%
1980...$932 Billion... 33%
1990...$2.5 Trillion...43%
2000...$4.8 Trillion...49%
2004...$7.3 Trillion...64% (end of Q3 2004)
Although mortgage debt, as a percentage of GDP, has been increasing for years, the last four years have seen an astounding increase in debt. This increase has occured while the median real wage has hardly changed. This has lead many obervers to wonder if Americans are using their homes as ATMs. (See Paul Volcker's comments)
Meanwhile, job creation remains sluggish. Here is a graph of employment participation:
Source: Federal Reserve St. Louis

This is very concerning since usually in an economic recovery the participation rate increases. This recovery continues to see sluggish job growth and, as a direct result, restrained aggregate income.
And finally, I have to mention the National Debt. The following chart shows the dramatic increase in the debt over the last four years:
Source: Federal Reserve St. Louis

We do not know when America's rapid increase in debt load will end. We also do not know how it will end. But will do know that the current rate of debt increase is not sustainable. Eventually the debt load will be crushing. 300% of GDP? We are aleady there. 400% of GDP? No one knows, but as economist Herb Stein once observed:
"If something cannot go on forever, it will stop."
Sunday, February 20, 2005
Greenspan's Interest Rate Conundrum
by Calculated Risk on 2/20/2005 06:44:00 PM
Last week, during Greenspan's testimony to Congress, he referred to the behavior of long term rates as a "conundrum". Greenspan's testimony in italics:
"In this environment, long-term interest rates have trended lower in recent months even as the Federal Reserve has raised the level of the target federal funds rate by 150 basis points. This development contrasts with most experience, which suggests that, other things being equal, increasing short-term interest rates are normally accompanied by a rise in longer-term yields. The simple mathematics of the yield curve governs the relationship between short- and long-term interest rates. Ten-year yields, for example, can be thought of as an average of ten consecutive one-year forward rates. A rise in the first-year forward rate, which correlates closely with the federal funds rate, would increase the yield on ten-year U.S. Treasury notes even if the more-distant forward rates remain unchanged. Historically, though, even these distant forward rates have tended to rise in association with monetary policy tightening."
Mr. Greenspan is referring to the expectations theory of interest rates were long rates are the geometric average of expected future short rates plus a risk premium that would usually increase with duration of the instrument. This theory assumes that arbitrage between instruments of different durations will set the price.
It is also possible for the risk premium to change over time. As an example, changes in the perceptions of the Fed's credibility on fighting inflation will change the risk premium. For a discussion on the declining risk premium (possibly due to improving Fed credibility), see Dr. Altig's Macroblog.
"In the current episode, however, the more-distant forward rates declined at the same time that short-term rates were rising. Indeed, the tenth-year tranche, which yielded 6-1/2 percent last June, is now at about 5-1/4 percent. During the same period, comparable real forward rates derived from quotes on Treasury inflation-indexed debt fell significantly as well, suggesting that only a portion of the decline in nominal forward rates in distant tranches is attributable to a drop in long-term inflation expectations.
Some analysts have worried that the dip in forward real interest rates since last June may indicate that market participants have marked down their view of economic growth going forward, perhaps because of the rise in oil prices. But this interpretation does not mesh seamlessly with the rise in stock prices and the narrowing of credit spreads observed over the same interval."
Under the expectations theory, a decline in long rates with rising short rates would mean either: 1) the market believes the increase in the short rate is temporary (not really applicable now) or 2) the market believes that economic growth will be slower in the future. Greenspan rejects these explanations and offers the recent rise in the stock market and narrowing of credit spreads as evidence that the economy is healthy. Perhaps the most recent runup in the stock market is just more "irrational exuberance"?
Others have emphasized the subdued overall business demand for credit in the United States and the apparent eagerness of lenders, including foreign investors, to provide financing. In particular, heavy purchases of longer-term Treasury securities by foreign central banks have often been cited as a factor boosting bond prices and pulling down longer-term yields. Thirty-year fixed-rate mortgage rates have dropped to a level only a little higher than the record lows touched in 2003 and, as a consequence, the estimated average duration of outstanding mortgage-backed securities has shortened appreciably over recent months. Attempts by mortgage investors to offset this decline in duration by purchasing longer-term securities may be yet another contributor to the recent downward pressure on longer-term yields.
For an excellent analysis concerning Foreign Central Bank purchases of U.S. instruments, see Roubini and Setser's "Will the Bretton Woods 2 Regime Unravel Soon? The Risk of Hard Landing in 2005-2006." Roubini and Setser suggested that the impact on the interest rates of foreign CBs purchases could be as much as 200 bps. (see here and here) However this is a side point in their excellent analysis of the Current Account Deficit.
Please see: Do Foreign CBs distort the Treasury Yield? Greenspan discounts the impact of these purchases:
"But we should be careful in endeavoring to account for the decline in long-term interest rates by adverting to technical factors in the United States alone because yields and risk spreads have narrowed globally. The German ten-year Bund rate, for example, has declined from 4-1/4 percent last June to current levels of 3-1/2 percent. And spreads of yields on bonds issued by emerging-market nations over U.S. Treasury yields have declined to very low levels.
There is little doubt that, with the breakup of the Soviet Union and the integration of China and India into the global trading market, more of the world's productive capacity is being tapped to satisfy global demands for goods and services. Concurrently, greater integration of financial markets has meant that a larger share of the world's pool of savings is being deployed in cross-border financing of investment. The favorable inflation performance across a broad range of countries resulting from enlarged global goods, services and financial capacity has doubtless contributed to expectations of lower inflation in the years ahead and lower inflation risk premiums. But none of this is new and hence it is difficult to attribute the long-term interest rate declines of the last nine months to glacially increasing globalization. For the moment, the broadly unanticipated behavior of world bond markets remains a conundrum. Bond price movements may be a short-term aberration, but it will be some time before we are able to better judge the forces underlying recent experience."
My view: It is probably true that the risk premium has declined and contributed to lower long rates. And Foreign CB purchases might be having an impact on longer rates. But I think the PRIMARY reason for Greenspan's conundrum is that the economy is weaker than it appears. Using GDP growth and unemployment, the US economy is healthy. But the level of debt (both consumer and government), the real estate "boom" that seems based on leverage and loose credit (see Volcker's recent comments), and the poor employment situation (especially the low level of participation) indicate an unhealthy economy. I believe this recovery is being built on a marshland of debt and the bond market is reflecting this weakness.
Is "Consumer Confidence" Useless?
by Calculated Risk on 2/20/2005 03:19:00 PM
A new study by Dr. Dean Croushore of University of Richmond "says they're essentially useless for forecasting Americans' spending patterns."
Here is the February AP-Ipsos consumer confidence index.
Here is a PDF version of the report "DO CONSUMER CONFIDENCE INDEXES HELP FORECAST CONSUMER SPENDING IN REAL TIME?".
Dr. Dean Croushore said:
"... consumer confidence just reflects the past. You lose your job, your confidence falls. There's not really anything new there. What we really want are indicators that look forward."However, the response from the leading Consumer confidence Indexes:
Richard T. Curtin, director of the Michigan surveys, said it's more telling to look at consumers' responses to his survey's specific questions rather than the index itself. That's because over the decades, Americans' spending decisions have come to be based on an increasing number of factors, including expectations about interest rates and asset values, he said.
"So the details are much more important than the overall number," Curtin said
Robert H. McGuckin, economic research director for the Conference Board, said in an e-mail he hasn't had the chance to closely examine Croushore's study. But he said the group's researchers have used similar real-time forecasting tests in evaluating their Leading Economic Index, which includes consumer expectations.
"We find the (Leading Economic Index) provides timely and accurate ex-ante information for predicting not only the business cycle turning points but also monthly changes in the economy," he wrote.
McGuckin added that the group's consumer confidence survey "is not designed narrowly to focus just on forecasts of consumer expenditures."
Wednesday, February 16, 2005
Volcker: Circumstances "dangerous and intractable"
by Calculated Risk on 2/16/2005 11:26:00 PM
Former Fed chief Paul Volcker spoke last week at the second annual summit of the Stanford Institute for Economic Policy Research. In his keynote speech he warned that the nation is facing 'huge imbalances and risks'.
Here is a video of the speech.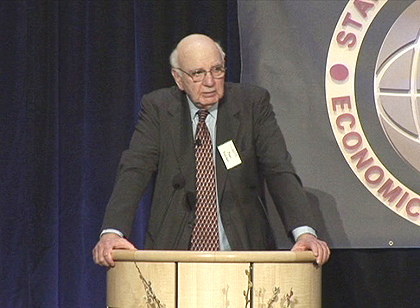
Paul Volcker, Stanford, Feb 11, 2005 
A few selected excerpts:
"Altogether, the circumstances seem as dangerous and intractable as I can remember."
"Boomers are spending like there is no tomorrow."
"Homeownership has become a vehicle for borrowing and leveraging as much as a source of financial security."
"I come now to the heart of the problem, as a Nation we are consuming and investing, that is spending, about 6% more than we are producing. What holds it all together? - High consumption - high leverage - government deficits - What holds it all together is a really massive and growing flow of capital from abroad. A flow of capital that today runs to more than $2 Billion per day."
"What I'm really talking about boils down to the oldest lesson of financial policy in Central Banking: A strong sense of monetary and fiscal discipline."
The Impact of a RE Slowdown on Employment
by Calculated Risk on 2/16/2005 01:35:00 AM
Earlier I posted a bullish analysis on housing from the NAR and a cautionary report from the FDIC that expressed concerns about credit quality and excessive leverage for many homebuyers.
NAR President Al Mansell claims that "the population is growing faster than the supply of homes". However this is somewhat contradicted (in the short term) by the Housing Vacancies and Homeownership data from the Census Bureau. This data shows that an extra 800K rental units are available nationwide (above the normal percentage for the last 20 years). This increase has happened during the last 3 years. For other reasons, another 700K housing units are sitting vacant above the normal percentages. These are included in "bought but not occupied yet" and "other vacant" categories. Could this be speculation? Regardless of the reason, this suggests overcapacity in the housing market in the short term.
What about jobs?
If we have a RE slowdown, it will probably have a significant impact on employment and aggregate income. From the following chart, we see that we have added 200K jobs in the mortgage industry alone in under 4 years. The mean salary (according to the BLS in 2001) was $45,380 for the mortgage industry. If we lost those jobs (returning to pre-2001 employment levels), we would lose $8 to $9 billion in aggregate annual income ... just from layoffs in the mortgage industry.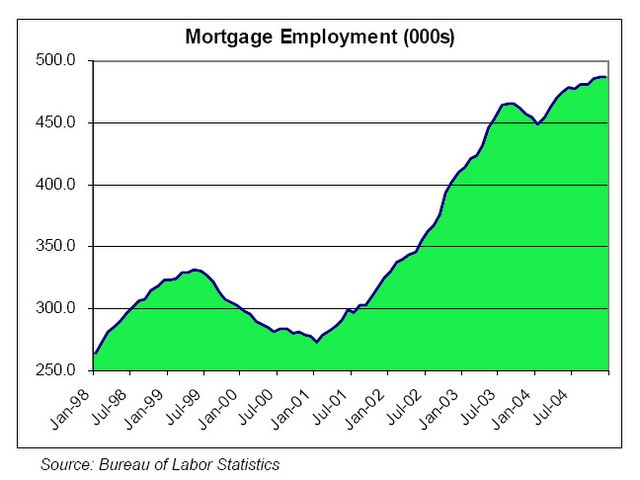
Thanks to ild and Elroy for the chart.
For RE agents, California alone has added 99,281 licensed RE agents since July 2000. Many of these agents only work part-time, but that is still a substantial loss of income if RE volumes drop 30 to 40% - like a typical RE slowdown.
And then there is the residential construction industry. Many of these jobs are reasonably high paying - and we have added over 300k construction jobs since 2000. And that figure doesn't include the impact of illegal immigrants working in the construction trade. When these immigrants lose their jobs, their lost income will also ripple through the economy.
We could add other potential lost jobs to this list: like service jobs in escrow, title, home inspection, and many other jobs on the periphery of RE. These are just the jobs directly impacted by a slowdown.
There are also the secondary effects (the vendors for the above businesses) and the tertiary impacts (restaurants, retailers, etc.) that suffer as aggregate income falls.
The bottomline: a significant RE slowdown would have a serious impact on employment and the economy.


