 RSS Feed
 by Calculated Risk on 6/24/2025 09:00:00 AM
Tuesday, June 24, 2025
Case-Shiller: National House Price Index Up 2.7% year-over-year in April
S&P/Case-Shiller released the monthly Home Price Indices for April ("April" is a 3-month average of February, March and April closing prices).
This release includes prices for 20 individual cities, two composite indices (for 10 cities and 20 cities) and the monthly National index.
From S&P S&P CoreLogic Case-Shiller Index Records 2.7% Annual Gain in April 2025
The S&P CoreLogic Case-Shiller U.S. National Home Price NSA Index, covering all nine U.S. census divisions, reported a 2.7% annual return for April, down from a 3.4% annual gain in the previous month. The 10-City Composite saw an annual increase of 4.1%, down from a 4.8% annual increase in the previous month. The 20-City Composite posted a year-over-year increase of 3.4%, down from a 4.1% increase in the previous month. New York again reported the highest annual gain among the 20 cities with a 7.9% increase in April, followed by Chicago and Detroit with annual increases of 6.0% and 5.5%, respectively. Tampa posted the lowest return, falling 2.2%.
...
The pre-seasonally adjusted U.S. National Index saw slight upward trends in April, posting gains of 0.6%. The 10-City Composite and 20-City Composite Indices both reported gains of 0.7%.
After seasonal adjustment, the U.S. National Index posted a decrease of -0.4%. Both the 10-City Composite and the 20-City Composite Indices saw a -0.3% decrease.
“The housing market continued its gradual deceleration in April, with annual price gains slowing to their most modest pace in nearly two years,” said Nicholas Godec, CFA, CAIA, CIPM, Head of Fixed Income Tradables & Commodities at S&P Dow Jones Indices. “What's particularly striking is how this cycle has reshuffled regional leadership—markets that were pandemic darlings are now lagging, while historically steady performers in the Midwest and Northeast are setting the pace. This rotation signals a maturing market that's increasingly driven by fundamentals rather than speculative fervor.
“The National Composite Index posted a 2.7% annual gain in April, marking its slowest year-over-year appreciation since mid-2023. This deceleration was broad-based, with the 20-City Composite advancing 3.4% and the 10-City Composite up 4.1%—both substantially below their recent peaks. The composition of these gains tells an important story: Approximately 1.7 percentage points of April's annual increase occurred over the past six months, indicating that price momentum has been concentrated in the recent spring selling season rather than sustained throughout the year. "
emphasis added
 Click on graph for larger image.
 The first graph shows the nominal seasonally adjusted Composite 10, Composite 20 and National indices (the Composite 20 was started in January 2000).
The Composite 10 index was down 0.3% in April (SA). The Composite 20 index was down 0.3% (SA) in April.
The National index was down 0.4% (SA) in April.
 The second graph shows the year-over-year change in all three indices.
The Composite 10 NSA was up 4.1% year-over-year. The Composite 20 NSA was up 3.4% year-over-year.
The National index NSA was up 2.7% year-over-year.
Annual price changes were lower than expectations. I'll have more later.
Monday, June 23, 2025
Tuesday: Case-Shiller House Prices, Fed Chair Powell Testimony
by Calculated Risk on 6/23/2025 08:11:00 PM
 From Matthew Graham at Mortgage News Daily: Mortgage Rates Lowest Since May 1st
Mortgage rates ended the previous week roughly in line with the best levels since May 1st. Today's modest improvement made it official.Tuesday:
Mortgage rates are primarily a function of trading levels in the bond market and bonds have had a few reasons to move at the start of the new week.
There's a small case to be made that U.S. involvement in the conflict between Israel and Iran contributed to bond market strength and, thus, lower mortgage rates today. [30 year fixed 6.84%]
emphasis added
• At 9:00 AM ET, S&P/Case-Shiller House Price Index for April. The National index was up 3.4% year-over-year in March.
• Also at 9:00 AM, FHFA House Price Index for April. This was originally a GSE only repeat sales, however there is also an expanded index.
• At 10:00 AM, Richmond Fed Survey of Manufacturing Activity for June.
• Also at 10:00 AM, State Employment and Unemployment (Monthly) for May 2024.
• Also at 10:00 AM, Testimony, Fed Chair Jerome Powell, Semiannual Monetary Policy Report to Congress, Before the U.S. House Financial Services Committee
A Very Early Look at 2026 Cost-Of-Living Adjustments and Maximum Contribution Base
by Calculated Risk on 6/23/2025 02:27:00 PM
The BLS reported earlier this month:
The Consumer Price Index for Urban Wage Earners and Clerical Workers (CPI-W) increased 2.2 percent over the last 12 months to an index level of 314.839 (1982-84=100). For the month, the index increased 0.2 percent prior to seasonal adjustment.CPI-W is the index that is used to calculate the Cost-Of-Living Adjustments (COLA). The calculation dates have changed over time (see Cost-of-Living Adjustments), but the current calculation uses the average CPI-W for the three months in Q3 (July, August, September) and compares to the average for the highest previous average of Q3 months. Note: this is not the headline CPI-U and is not seasonally adjusted (NSA).
• In 2024, the Q3 average of CPI-W was 308.729.
The 2024 Q3 average was the highest Q3 average, so we only have to compare Q3 this year to last year.
 Click on graph for larger image.
This graph shows CPI-W since January 2000. The red lines are the Q3 average of CPI-W for each year.
Note: The year labeled is for the calculation, and the adjustment is effective for December of that year (received by beneficiaries in January of the following year).
CPI-W was up 2.2% year-over-year in May, and although this is very early - we need the data for July, August and September - my very early guess is COLA will probably be in the 2% to 3% range again this year, possibly the smallest increase since 1.3% in 2021 (the increase was 2.5% for 2025).
Contribution and Benefit Base
The contribution base will be adjusted using the National Average Wage Index. This is based on a one-year lag. The National Average Wage Index is not available for 2024 yet, although we know wages increased solidly in 2024. If wages increased 5% in 2024, then the contribution base next year will increase to around $185,000 in 2026, from the current $176,100.
Remember - this is a very early look. What matters is average CPI-W, NSA, for all three months in Q3 (July, August and September).
Newsletter: NAR: Existing-Home Sales Increased to 4.03 million SAAR in May; Down 0.7% YoY
by Calculated Risk on 6/23/2025 10:50:00 AM
Today, in the CalculatedRisk Real Estate Newsletter: NAR: Existing-Home Sales Increased to 4.03 million SAAR in May; Down 0.7% YoY
Excerpt:
Sales in May (4.03 million SAAR) were up 0.8% from the previous month and were 0.7% below the May 2024 sales rate. This was the 4th consecutive month with a year-over-year decline in sales. ... The sales rate was above the consensus forecast (but right at housing economist Tom Lawler’s estimate).There is much more in the article.
...
Sales Year-over-Year and Not Seasonally Adjusted (NSA)
The fourth graph shows existing home sales by month for 2024 and 2025.
Sales decreased 0.7% year-over-year compared to May 2024. This was the 4th consecutive month with a year-over-year decline. The next four months will have the easiest year-over-year comparisons.
...
On an NSA basis for the month of May, this was 3% above the low for housing bust for the month of May that happened in May 2009. Year-to-date, sales are down 2.8% NSA.

NAR: Existing-Home Sales Increased to 4.03 million SAAR in May; Down 0.7% YoY
by Calculated Risk on 6/23/2025 10:00:00 AM
From the NAR: NAR Existing-Home Sales Report Shows 0.8% Increase in May
Existing-home sales rose in May, according to the National Association of REALTORS®. Sales elevated in the Northeast, Midwest and South, but retreated in the West. Year-over-year, sales progressed in the Northeast and Midwest but contracted in the South and West. ...
• 0.8% increase in total existing-home sales month-over-month to a seasonally adjusted annual rate of 4.03 million.
• 0.7% decrease year-over-year, sales declined 0.7% (down from 4.06 million in May 2024).
• 1.54 million units: Total housing inventory, up 6.2% from April and 20.3% from May 2024 (1.28 million).
• 4.6-month supply of unsold inventory, up from 4.4 months in April and 3.8 months in May 2024.
emphasis added
 Click on graph for larger image.
This graph shows existing home sales, on a Seasonally Adjusted Annual Rate (SAAR) basis since 1994.
Sales in May (4.03 million SAAR) were up 0.8% from the previous month and were 0.7% below the May 2024 sales rate. This was the 4th consecutive month with a year--over-year decline in sales.
The second graph shows nationwide inventory for existing homes.
 According to the NAR, inventory increased to 1.54 million in May from 1.45 million the previous month.
 According to the NAR, inventory increased to 1.54 million in May from 1.45 million the previous month.
Headline inventory is not seasonally adjusted, and inventory usually decreases to the seasonal lows in December and January, and peaks in mid-to-late summer.
The last graph shows the year-over-year (YoY) change in reported existing home inventory and months-of-supply. Since inventory is not seasonally adjusted, it really helps to look at the YoY change. Note: Months-of-supply is based on the seasonally adjusted sales and not seasonally adjusted inventory.
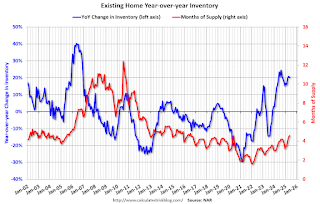 Inventory was up 20.3% year-over-year (blue) in May compared to May 2024.
Months of supply (red) increased to 4.6 months in May from 4.4 months the previous month.
As expected, the sales rate was above the consensus forecast. I'll have more later.
The last graph shows the year-over-year (YoY) change in reported existing home inventory and months-of-supply. Since inventory is not seasonally adjusted, it really helps to look at the YoY change. Note: Months-of-supply is based on the seasonally adjusted sales and not seasonally adjusted inventory.
 Inventory was up 20.3% year-over-year (blue) in May compared to May 2024.
 Months of supply (red) increased to 4.6 months in May from 4.4 months the previous month.
As expected, the sales rate was above the consensus forecast. I'll have more later.
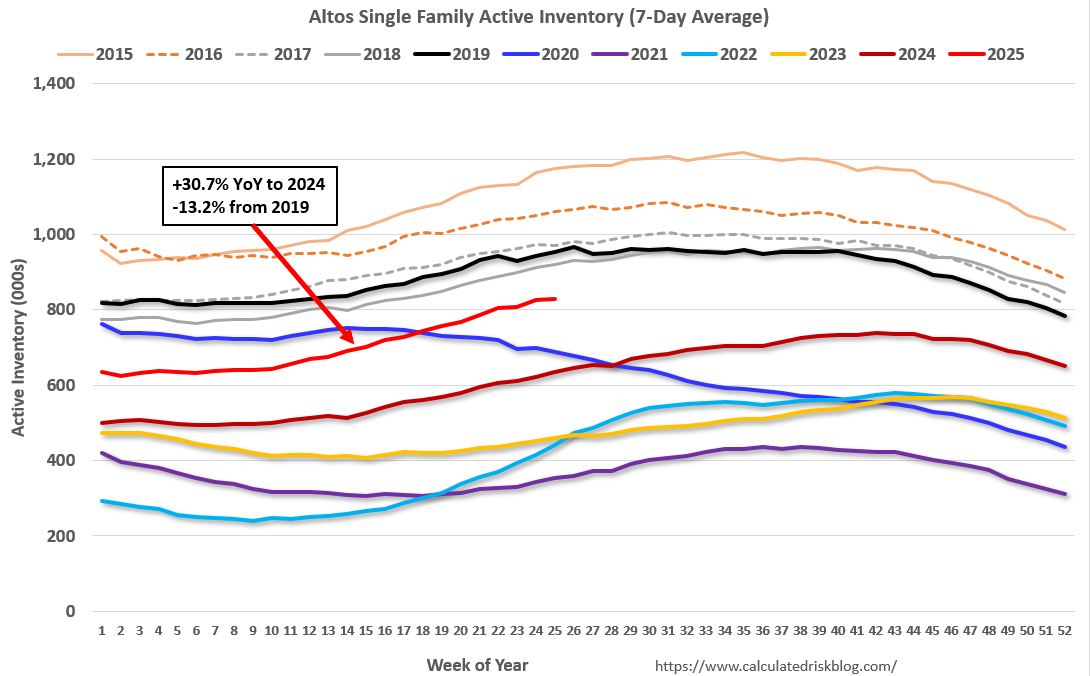
Housing June 23rd Weekly Update: Inventory up 0.4% Week-over-week, Up 30.7% Year-over-year
by Calculated Risk on 6/23/2025 08:11:00 AM
Altos reports that active single-family inventory was up 0.4% week-over-week.
Inventory is now up 32.7% from the seasonal bottom in January and is increasing.
Usually, inventory is up about 18% to 19% from the seasonal low by this week in the year. So, 2025 is seeing a larger than normal pickup in inventory.
The first graph shows the seasonal pattern for active single-family inventory since 2015.
 Click on graph for larger image.
The red line is for 2025. The black line is for 2019.
Inventory was up 30.7% compared to the same week in 2024 (last week it was up 33.1%), and down 13.2% compared to the same week in 2019 (last week it was down 12.4%).
This is the highest level since 2019.
It now appears inventory will be close to 2019 levels towards the end of 2025.
 This second inventory graph is courtesy of Altos Research.
As of June 20th, inventory was at 829 thousand (7-day average), compared to 826 thousand the prior week.
Mike Simonsen discusses this data regularly on Youtube
Sunday, June 22, 2025
Monday: Existing Home Sales
by Calculated Risk on 6/22/2025 06:15:00 PM
Weekend:
• Schedule for Week of June 22, 2025
Monday:
• At 10:00 AM ET, Existing Home Sales for May from the National Association of Realtors (NAR). The consensus is for 3.95 million SAAR, down from 4.00 million in April.
From CNBC: Pre-Market Data and Bloomberg futures S&P 500 are down 35 and DOW futures are down 221 (fair value).
Oil prices were up over the last week with WTI futures at $76.96 per barrel and Brent at $80.28 per barrel. A year ago, WTI was at $82, and Brent was at $86 - so WTI oil prices are down about 6% year-over-year.
Here is a graph from Gasbuddy.com for nationwide gasoline prices. Nationally prices are at $3.19 per gallon. A year ago, prices were at $3.41 per gallon, so gasoline prices are down $0.22 year-over-year.
Update: Lumber Prices Up 36% YoY
by Calculated Risk on 6/22/2025 08:48:00 AM
This is something to watch again. Here is another monthly update on lumber prices.
SPECIAL NOTE: The CME group discontinued the Random Length Lumber Futures contract on May 16, 2023. I switched to a physically-delivered Lumber Futures contract that was started in August 2022. Unfortunately, this impacts long term price comparisons since the new contract was priced about 24% higher than the old random length contract for the period when both contracts were available.
This graph shows CME random length framing futures through August 2022 (blue), and the new physically-delivered Lumber Futures (LBR) contract starting in August 2022 (Red).
On June 20, 2025, LBR was at $616.00 per 1,000 board feet, up 36% from a year ago.
 Click on graph for larger image.
There is somewhat of a seasonal demand for lumber, and lumber prices frequently peak in the first half of the year.
Note that last year prices bottomed in early July at $449.00 per 1,000 board feet, so the next few weeks will be the most difficult year-over-year comparison.
The pickup in early 2018 was due to the Trump lumber tariffs in 2017. There were huge increases during the pandemic due to a combination of supply constraints and a pickup in housing starts.
Saturday, June 21, 2025
Real Estate Newsletter Articles this Week: Housing Starts Decreased to 1.256 million SAAR
by Calculated Risk on 6/21/2025 02:11:00 PM
At the Calculated Risk Real Estate Newsletter this week:
 Click on graph for larger image.
• Housing Starts Decreased to 1.256 million Annual Rate in May
• California Home Sales "Sputter" in May; 4th Look at Local Markets
• Housing Market Index and Single Family Starts
• 3rd Look at Local Housing Markets in May
This is usually published 4 to 6 times a week and provides more in-depth analysis of the housing market.
Schedule for Week of June 22, 2025
by Calculated Risk on 6/21/2025 08:11:00 AM
The key reports this week are May New and Existing Home sales, the third estimate of Q1 GDP, Personal Income and Outlays for May and the April Case-Shiller house price index.
For manufacturing, the June Richmond and Kansas City Fed manufacturing surveys will be released.
Fed Chair Powell testifies on the Semiannual Monetary Policy Report to Congress.
 10:00 AM: Existing Home Sales for May from the National Association of Realtors (NAR). The consensus is for 3.95 million SAAR, down from 4.00 million in April.
The graph shows existing home sales from 1994 through the report last month.
Housing economist Tom Lawler expects the NAR to report sales of 4.03 million SAAR.
 9:00 AM: S&P/Case-Shiller House Price Index for April.
This graph shows the year-over-year change in the seasonally adjusted National Index, Composite 10 and Composite 20 indexes through the most recent report (the Composite 20 was started in January 2000).
The National index was up 3.4% year-over-year in March.
9:00 AM: FHFA House Price Index for April. This was originally a GSE only repeat sales, however there is also an expanded index.
10:00 AM: Richmond Fed Survey of Manufacturing Activity for June.
10:00 AM: State Employment and Unemployment (Monthly) for May 2024.
10:00 AM: Testimony, Fed Chair Jerome Powell, Semiannual Monetary Policy Report to Congress, Before the U.S. House Financial Services Committee
7:00 AM ET: The Mortgage Bankers Association (MBA) will release the results for the mortgage purchase applications index.
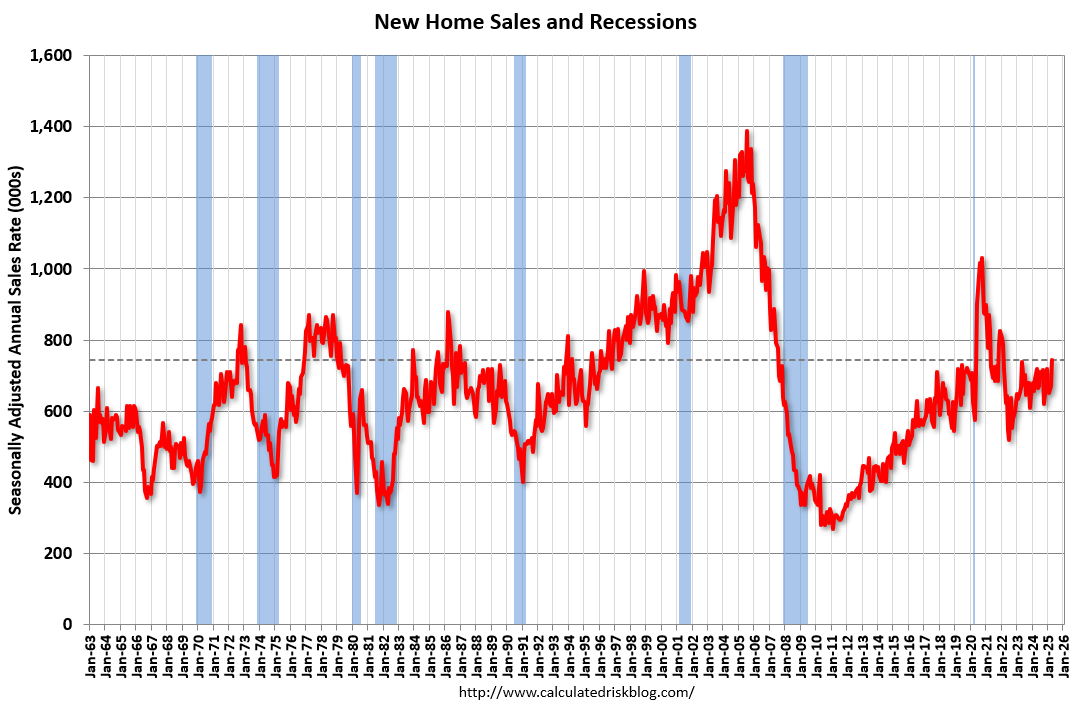 10:00 AM: New Home Sales for May from the Census Bureau.
 This graph shows New Home Sales since 1963. The dashed line is the sales rate for last month.
The consensus is for 710 thousand SAAR, down from 743 thousand in April.
10:00 AM: Testimony, Fed Chair Jerome Powell, Semiannual Monetary Policy Report to Congress, Before the U.S. Senate Committee on Banking, Housing, and Urban Affairs
8:30 AM: The initial weekly unemployment claims report will be released. The consensus is for initial claims to increase to 247 thousand from 245 thousand last week.
8:30 AM: Gross Domestic Product, 1st quarter 2024 (Third estimate). The consensus is that real GDP decreased 0.2% annualized in Q1, unchanged from the second estimate of a 0.2% decrease.
8:30 AM: Durable Goods Orders for May from the Census Bureau. The consensus is for a 4.5% increase in durable goods orders.
8:30 AM ET: Chicago Fed National Activity Index for May. This is a composite index of other data.
10:00 AM: Pending Home Sales Index for May. The consensus is for a 0.1% increase in this index.
11:00 AM: the Kansas City Fed manufacturing survey for June.
During the Day: Census Bureau releases the Vintage 2024 Population Estimates
8:30 AM ET: Personal Income and Outlays, May 2024. The consensus is for a 0.4% increase in personal income, and for a 0.3% increase in personal spending. And for the Core PCE price index to increase 0.1%. PCE prices are expected to be up 2.2% YoY, and core PCE prices up 2.5% YoY.
10:00 AM: University of Michigan's Consumer sentiment index (Final for June).
4:30 PM: Federal Reserve Board announces results from its annual bank stress test
Friday, June 20, 2025
June 20th COVID Update: Weekly COVID Deaths at New Pandemic Low
by Calculated Risk on 6/20/2025 07:11:00 PM
 Note: Mortgage rates are from MortgageNewsDaily.com and are for top tier scenarios.
This will be the last weekly COVID update for now, although I'll start posting again if COVID increases significantly.
For deaths, I'm currently using 4 weeks ago for "now", since the most recent three weeks will be revised significantly.
Note: "Effective May 1, 2024, hospitals are no longer required to report COVID-19 hospital admissions, hospital capacity, or hospital occupancy data." So, I'm no longer tracking hospitalizations.
| COVID Metrics | ||||
|---|---|---|---|---|
| Now | Week Ago | Goal | ||
| Deaths per Week | 181✅ | 211 | ≤3501 | |
| 1my goals to stop weekly posts. 🚩 Increasing number weekly for Deaths. ✅ Goal met. | ||||
 Click on graph for larger image.
This graph shows the weekly (columns) number of deaths reported since Jan 2023.
Although weekly deaths met the original goal to stop posting in June 2024 (previous pandemic low of 314 deaths), I continued to post since COVID deaths increased last summer.
 This appears to be a leading indicator for COVID hospitalizations and deaths. This is close to the lows of May 2024.
Nationally COVID in wastewater is "Low".
Q2 GDP Tracking: Wide Range
by Calculated Risk on 6/20/2025 11:45:00 AM
There will be some trade related distortions in Q2.
From BofA:
Overall, 2Q GDP tracking is down from 2.7% q/q saar to 2.6%. [June 17th estimate]From Goldman:
emphasis added
We lowered our Q2 GDP tracking estimate by 0.1pp to +4.1% (quarter-over-quarter annualized) and our Q2 domestic final sales estimate by the same amount to +0.1%. [June 18th estimate]And from the Atlanta Fed: GDPNow

The GDPNow model estimate for real GDP growth (seasonally adjusted annual rate) in the second quarter of 2025 is 3.4 percent on June 18, down from 3.5 percent on June 17. [June 18th estimate]
California Home Sales "Sputter" in May; 4th Look at Local Markets
by Calculated Risk on 6/20/2025 08:44:00 AM
Today, in the Calculated Risk Real Estate Newsletter: California Home Sales "Sputter" in May; 4th Look at Local Markets
A brief excerpt:
From the California Association of Realtors® (C.A.R.): California housing market sputters for third straight month in May as home sales and prices pull back, C.A.R. reportsThere is much more in the article.May’s sales pace fell 5.1 percent from the 267,710 homes sold in April and was down 4.0 percent from a year ago, when 264,850 homes were sold on an annualized basis. May’s sales level was the lowest in four months. The year-over-year decline was the largest since December 2023 ...In May, sales in these markets were down 3.7% YoY. Last month, in April, these same markets were down 3.4% year-over-year Not Seasonally Adjusted (NSA).
Important: There were fewer working days in May 2025 (21) as in May 2024 (22). So, the year-over-year change in the headline SA data will be higher than for the NSA data.
...
Several local markets - like Illinois, Miami, New Jersey and New York - will report after the NAR release.

Thursday, June 19, 2025
Friday: Philly Fed Mfg
by Calculated Risk on 6/19/2025 08:11:00 PM
 Note: Mortgage rates are from MortgageNewsDaily.com and are for top tier scenarios.
Friday:
• At 8:30 AM ET, the Philly Fed manufacturing survey for June. The consensus is for a reading of 0.0, up from -4.0 last month.
TSA: Airline Travel Down Slightly YoY
by Calculated Risk on 6/19/2025 04:03:00 PM
Here are the daily travel numbers from the TSA.
This data is as of June 17, 2025.
 Click on graph for larger image.
This data shows the 7-day average of daily total traveler throughput from the TSA for the last 6 years.
Air travel is essentially unchanged YoY (down about 1.1% YoY).
The red line is the seven-day average for 2025. Air travel is down slightly from last year.
The red line is the seven-day average for 2025. Air travel is down slightly from last year.
Realtor.com Reports Most Active "For Sale" Inventory since December 2019
by Calculated Risk on 6/19/2025 10:57:00 AM
What this means: On a weekly basis, Realtor.com reports the year-over-year change in active inventory and new listings. On a monthly basis, they report total inventory. For May, Realtor.com reported inventory was up 31.5% YoY, but still down 14.4% compared to the 2017 to 2019 same month levels.
Here is their weekly report: Weekly Housing Trends: Latest as of June 14
• Active inventory climbed 28.1% year over year
The number of homes actively for sale remains on a strong upward trajectory, now 28.1% higher than this time last year. This represents the 84th consecutive week of annual gains in inventory. There were more than 1 million homes for sale again last week, marking the seventh week in a row over the threshold and the highest inventory level since December 2019.
• New listings—a measure of sellers putting homes up for sale—rose 5.7% year over year
New listings rose again last week on an annual basis, up 5.7% compared with the same period last year, a slightly faster growth compared with the previous two weeks.
• The median list price was unchanged year over year
The median list price was flat (0% change) year over year this week and is down 0.4% year to date. The median list price per square foot—which adjusts for changes in home size—rose 0.7% year over year.
Update: The Art of the Soft Landing
by Calculated Risk on 6/19/2025 08:13:00 AM
A year ago I wrote: The Art of the Soft Landing
A few excerpts and an updated graph ...
The "Art of the Soft Landing" requires that the Fed reduce rates quick enough to keep economic growth positive, and slow enough not to reignite inflation. My view is a soft landing is achieved if growth stays positive, inflation returns to target, and the yield curve flattens or reverts to normal (long yields higher than short yields).
The Fed lowered rates and GDP growth was solid in 2024, and although GDP growth was slightly negative in Q1 2025, this was due to trade related distortions and all indications are GDP will be positive in Q2.
Inflation hasn't quite returned to target with PCE core inflation at 2.5% YoY in April. However, inflation appeared to be on the way to the Fed's 2% target until the trade war started.
 And here is an updated graph of 10-Year Treasury Constant Maturity Minus 2-Year Treasury Constant Maturity from FRED for the last 5 years.
The yield curve is no longer inverted.
With the significant changes to policy, the Fed didn't completely meet my definition of a "soft landing", but it was close - and I think they deserve credit.
Wednesday, June 18, 2025
Thursday: Juneteenth Holiday
by Calculated Risk on 6/18/2025 09:09:00 PM
Note: Mortgage rates are from MortgageNewsDaily.com and are for top tier scenarios.
Thursday:
• All US markets will be closed in observance of Juneteenth National Independence Day
AIA: "Architecture firm billings continued to decline in May"
by Calculated Risk on 6/18/2025 03:26:00 PM
Note: This index is a leading indicator primarily for new Commercial Real Estate (CRE) investment.
From the AIA: ABI May 2025: Despite persistent softness, fewer firms report declining billings
The modest uptick in the AIA/Deltek Architecture Billings Index (ABI) score to 47.2 for the month means that fewer firms reported a decrease than in April. In addition, inquiries into new work increased this month for the first time since January, reflecting the modest degree of stabilization in the economy recently. However, the value of new signed design contracts continued to decline, indicating that while clients are starting to explore new projects, they remain hesitant to sign a contract committing to them.• Northeast (43.6); Midwest (43.5); South (49.2); West (44.3)
Business conditions remained soft at firms in all regions of the country in May, although firms located in the South came close to reporting growth. The pace of the decline in that region has slowed over recent months, and firms in that region may be the first to experience growth again. However, firms of all specializations reported declining billings this month, although the pace of the decline slowed at firms with a multifamily residential specialization. Firms specializing in that type of work, as well as in institutional work, look like they’ll be the first ones to turn the corner to growth when conditions start to improve.
...
The ABI score is a leading economic indicator of construction activity, providing an approximately nine-to-twelve-month glimpse into the future of nonresidential construction spending activity. The score is derived from a monthly survey of architecture firms that measures the change in the number of services provided to clients.
emphasis added
• Sector index breakdown: commercial/industrial (43.8); institutional (46.2); multifamily residential (46.1)
 Click on graph for larger image.
This graph shows the Architecture Billings Index since 1996. The index was at 47.2 in May, down from 43.2 in April. Anything below 50 indicates a decrease in demand for architects' services.
This index has indicated contraction for 30 of the last 32 months.
Note: This includes commercial and industrial facilities like hotels and office buildings, multi-family residential, as well as schools, hospitals and other institutions.
This index usually leads CRE investment by 9 to 12 months, so this index suggests a slowdown in CRE investment throughout 2025 and into 2026.
Multi-family billings have been below 50 for the 34 consecutive months. This suggests we will see continued weakness in multi-family starts.
FOMC Projections: GDP Revised Down, Inflation Revised Up
by Calculated Risk on 6/18/2025 02:08:00 PM
Statement here.
Fed Chair Powell press conference video here or on YouTube here, starting at 2:30 PM ET.
Here are the projections. The projections are pretty bearish.
The BEA's advance estimate for Q1 GDP showed real growth at -0.2% annualized. There is a wide range of estimates for Q2 GDP, but it is forecast to be over 3.0% (as Q1 distortions reverse). That would put real growth on pace to be at the low end of the March FOMC projections for Q4 over Q4. So, GDP was revised down for 2025.
| GDP projections of Federal Reserve Governors and Reserve Bank presidents, Change in Real GDP1 | ||||
|---|---|---|---|---|
| Projection Date | 2025 | 2026 | 2027 | |
| Jun 2025 | 1.2 to 1.5 | 1.5 to 1.8 | 1.7 to 2.0 | |
| Mar 2025 | 1.5 to 1.9 | 1.6 to 1.9 | 1.6 to 2.0 | |
The unemployment rate was at 4.2% in May after averaging 4.1% for Q1. The unemployment rate was revised up.
| Unemployment projections of Federal Reserve Governors and Reserve Bank presidents, Unemployment Rate2 | ||||
|---|---|---|---|---|
| Projection Date | 2025 | 2026 | 2027 | |
| Jun 2025 | 4.4 to 4.5 | 4.3 to 4.6 | 4.2 to 4.6 | |
| Mar 2025 | 4.3 to 4.4 | 4.2 to 4.5 | 4.1 to 4.4 | |
As of April 2025, PCE inflation increased 2.1 percent year-over-year (YoY). There will likely be some increase in PCE inflation from trade policy.
Without policy changes (tariffs) it appears inflation would be well below the FOMC forecast! The projections for Q4 2025 PCE inflation were revised up.
| Inflation projections of Federal Reserve Governors and Reserve Bank presidents, PCE Inflation1 | ||||
|---|---|---|---|---|
| Projection Date | 2025 | 2026 | 2027 | |
| Jun 2025 | 2.8 to 3.2 | 2.3-2.6 | 2.0 to 2.2 | |
| Mar 2025 | 2.6 to 2.9 | 2.1 to 2.3 | 2.0 to 2.1 | |
PCE core inflation increased 2.5 percent YoY in April. The projections for core PCE inflation Q4 2025 were revised up.
| Core Inflation projections of Federal Reserve Governors and Reserve Bank presidents, Core Inflation1 | ||||
|---|---|---|---|---|
| Projection Date | 2025 | 2026 | 2027 | |
| Jun 2025 | 2.9 to 3.4 | 2.3-2.6 | 2.0 to 2.2 | |
| Mar 2025 | 2.7 to 3.0 | 2.1 to 2.4 | 2.0 to 2.1 | |


