 RSS Feed
 by Calculated Risk on 4/15/2025 08:11:00 AM
Tuesday, April 15, 2025
U.S. Demographics: Largest 5-year cohorts, and Ten most Common Ages in 2024
Eleven years ago, I wrote: Census Bureau: Largest 5-year Population Cohort is now the "20 to 24" Age Group. Those people are now in the 30 to 34 cohort.
This month the Census Bureau released the population estimates for July 2024 by age, and I've updated the table from the previous posts.
The table below shows the top 10 cohorts by size for 2010, 2024 (just released), and the most recent Census Bureau projections for 2030.
In 2024, the top 6 cohorts were under 45 (the Boomers are fading away), and by 2030 the top 7 cohorts will be under 50. Note: This is using the 2023 projections main series.
There will be plenty of "gray hairs" walking around in 2030, but the key for the economy is the large cohorts in the prime working age.
As I noted in 2014, demographics were positive for apartments, and more recently positive for homeownership.
| Population: Largest 5-Year Cohorts by Year | ||||
|---|---|---|---|---|
| Largest Cohorts | 2010 | 2024 | 2030 | |
| 1 | 45 to 49 years | 30 to 34 years | 35 to 39 years | |
| 2 | 50 to 54 years | 35 to 39 years | 30 to 34 years | |
| 3 | 15 to 19 years | 25 to 29 years | 25 to 29 years | |
| 4 | 20 to 24 years | 20 to 24 years | 40 to 44 years | |
| 5 | 25 to 29 years | 15 to 19 years | 20 to 24 years | |
| 6 | 40 to 44 years | 40 to 44 years | 45 to 49 years | |
| 7 | 10 to 14 years | 60 to 64 years | 15 to 19 years | |
| 8 | 5 to 9 years | 10 to 14 years | 50 to 54 years | |
| 9 | Under 5 years | 50 to 54 years | 65 to 69 years | |
| 10 | 35 to 39 years | 55 to 59 years | 10 to 14 years | |

Click on graph for larger image.
This graph, based on the 2024 population estimate, shows the U.S. population by age in July 2024 according to the Census Bureau.
Note that the largest age group is in the early-to-mid 30s. There are still a number of younger Boomers in their early-to-mid 60s.
Monday, April 14, 2025
Tuesday: NY Fed Mfg
by Calculated Risk on 4/14/2025 07:54:00 PM
 From Matthew Graham at Mortgage News Daily: Mortgage Rates Fall Back Below 7%
Last Friday was notable in that it was the first day since February 19th where the average top tier 30yr fixed mortgage rate ended the day over 7%. Last week was also notable for ranking among the more abrupt weeks for rising rates over the past few years.Tuesday:
Things are getting off to a friendlier start in the present week with the 30yr fixed rate index edging back below 7%--roughly in line with levels seen last Wed/Thu. [30 year fixed 6.98%]
emphasis added
• At 8:30 AM ET, The New York Fed Empire State manufacturing survey for April. The consensus is for a reading of -10.0, up from -20.0.
Lawler: Update on Mortgage/MBS Rates and Spreads
by Calculated Risk on 4/14/2025 02:49:00 PM
From housing economist Tom Lawler: Update on Mortgage/MBS Rates and Spreads
On April 4th, the day after Trump’s “Liberation Day” tariff announcement, the so-called 30-year “current-coupon” MBS yield closed at 5.34%, its lowest level since the middle of last October. Last week’s bond market debacle, however, hit the MBS market especially hard, and the current-coupon MBS yield closed the week at 5.93%, its highest level since the middle of January.
 Obviously a major catalyst for the surge in MBS yields was the sharp increase in intermediate- and long-term Treasury rates. Putting additional upward pressure on MBS yields was the surge in market-implied interest-rate volatility. For example, the ICE BofAML MOVE Index, which is a measure of implied interest rate volatility derived from options on Treasury securities across the yield curve, jumped to 137.26 last Friday, its highest level since May 2023 and up sharply from 101.35 at the end of March.
 Finally, a widely-followed measure of the CCMBS option-adjusted spread to Treasuries from Yield Book increased by about 12 bp last week.
Watch Inventory and Why Measures of Existing Home Inventory appear Different
by Calculated Risk on 4/14/2025 11:16:00 AM
Today, in the Calculated Risk Real Estate Newsletter: Watch Inventory and Why Measures of Existing Home Inventory appear Different
A brief excerpt:
We are in a period of significant policy uncertainty and there isn’t a good historical analog for the current period. However, for housing, the key will be to watch inventory.There is much more in the article.
Existing home inventory will provide clues on house prices, and a combination of existing and new home inventory will indicate what will happen with housing starts.
Watch Inventory
Here are a few examples of when inventory helped me call some turning points for house prices (this section is an update to a previous article):
Starting in January 2005, I was very bearish on housing, but I wasn’t sure when the market would turn. Speculative bubbles can go on and on. However, the increase in inventory in late 2005 (see red arrow on graph below) helped me call the top for house prices in 2006.
Several years later, in early 2012, when many people were still bearish on housing, the plunge in inventory in 2011 (blue arrow on graph below) helped me call the bottom for house prices in early 2012 (see The Housing Bottom is Here).

Housing April 14th Weekly Update: Inventory up 1.6% Week-over-week, Up 33.4% Year-over-year
by Calculated Risk on 4/14/2025 08:21:00 AM
Altos reports that active single-family inventory was up 2.3% week-over-week.
Inventory is now up 12.5% from the seasonal bottom in January and is increasing.
Usually, inventory is up about 5% or 6% from the seasonal low by this week in the year. So, 2025 is seeing a larger than normal pickup in inventory.
The first graph shows the seasonal pattern for active single-family inventory since 2015.
 Click on graph for larger image.
The red line is for 2025. The black line is for 2019.
Inventory was up 33.4% compared to the same week in 2024 (last week it was up 34.7%), and down 17.5% compared to the same week in 2019 (last week it was down 17.4%).
Inventory will pass 2020 levels soon, and it now appears inventory will be close to 2019 levels towards the end of 2025.
 This second inventory graph is courtesy of Altos Research.
As of April 11th, inventory was at 702 thousand (7-day average), compared to 691 thousand the prior week.
Mike Simonsen discusses this data regularly on Youtube
Sunday, April 13, 2025
Sunday Night Futures
by Calculated Risk on 4/13/2025 06:22:00 PM
Weekend:
• Schedule for Week of April 13, 2025
Monday:
• No major economic releases scheduled.
From CNBC: Pre-Market Data and Bloomberg futures S&P 500 are up 48 and DOW futures are up 250 (fair value).
Oil prices were down over the last week with WTI futures at $61.50 per barrel and Brent at $64.76 per barrel. A year ago, WTI was at $86, and Brent was at $93 - so WTI oil prices are down about 28% year-over-year.
Here is a graph from Gasbuddy.com for nationwide gasoline prices. Nationally prices are at $3.15 per gallon. A year ago, prices were at $3.60 per gallon, so gasoline prices are down $0.45 year-over-year.
PCE Inflation expected to be Soft in March
by Calculated Risk on 4/13/2025 08:31:00 AM
The Personal Consumption Expenditures (PCE) price index for March will be released on April 30th. The data released so far suggests the PCE inflation will be soft in March.
From Goldman Sachs economists:
The producer price index (PPI), the PPI excluding food and energy, and the PPI excluding food, energy, and trade were all below consensus expectations in March. The components relevant for core PCE were soft. Based on the details in the PPI and CPI reports, we estimate that the core PCE price index rose 0.08% in March (vs. our expectation of 0.13% before today's PPI report), corresponding to a year-over-year rate of +2.52%.And from BofA:
[W]e are tracking core PCE to rise by 0.1% m/m (0.08% unrounded) in March. This would be a notable deceleration from the first two months of the year. However, February is likely to be revised up significantly to 0.5% m/m due to a very large upward revision to portfolio management. As a result, we expect y/y core PCE to fall to 2.6% from an upwardly revised 2.9%.This is further improvement progress on inflation. If policy had remained unchanged, we'd probably be celebrating a "soft landing". However, the tariffs will likely impact prices in May (the data will be released in June).
Saturday, April 12, 2025
Real Estate Newsletter Articles this Week: "Home Prices Continue to Cool"
by Calculated Risk on 4/12/2025 02:11:00 PM
At the Calculated Risk Real Estate Newsletter this week:
 Click on graph for larger image.
• Part 1: Current State of the Housing Market; Overview for mid-April 2025
• Part 2: Current State of the Housing Market; Overview for mid-April 2025
• 2nd Look at Local Housing Markets in March
• ICE Mortgage Monitor: Home Prices Continue to Cool
• 1st Look at Local Housing Markets in March
This is usually published 4 to 6 times a week and provides more in-depth analysis of the housing market.
Schedule for Week of April 13, 2025
by Calculated Risk on 4/12/2025 08:11:00 AM
The key reports this week are March Retail Sales and Housing Starts.
For manufacturing, the March Industrial Production report, and NY and Philly Fed surveys will be released this week.
Fed Chair Jerome Powell speaks on Wednesday.
No major economic releases scheduled.
8:30 AM: The New York Fed Empire State manufacturing survey for April. The consensus is for a reading of -10.0, up from -20.0.
7:00 AM ET: The Mortgage Bankers Association (MBA) will release the results for the mortgage purchase applications index.
 8:30 AM: Retail sales for March is scheduled to be released. The consensus is for a 1.3% increase in retail sales.
 This graph shows the year-over-year change in retail sales and food service (ex-gasoline) since 1993.
 9:15 AM: The Fed will release Industrial Production and Capacity Utilization for March.
This graph shows industrial production since 1967.
The consensus is for a 0.3% decrease in Industrial Production, and for Capacity Utilization to decrease to 77.9%.
10:00 AM: The April NAHB homebuilder survey. The consensus is for a reading of 38, down from 39. Any number below 50 indicates that more builders view sales conditions as poor than good.
1:30 PM: Speech, Fed Chair Jerome Powell, Economic Outlook, At the Economic Club of Chicago, Chicago, Ill.
8:30 AM: The initial weekly unemployment claims report will be released. The consensus is for 224 initial claims up from 223 thousand last week.
 8:30 AM ET: Housing Starts for March.
 This graph shows single and multi-family housing starts since 1968.
The consensus is for 1.410 million SAAR, down from 1.501 million SAAR in February.
8:30 AM: the Philly Fed manufacturing survey for April. The consensus is for a reading of 6.7, down from 12.5.
All US markets will be closed in observance of Good Friday.
10:00 AM: State Employment and Unemployment (Monthly) for March 2025
Friday, April 11, 2025
April 11th COVID Update: COVID Deaths Continue Declining
by Calculated Risk on 4/11/2025 07:27:00 PM
 Note: Mortgage rates are from MortgageNewsDaily.com and are for top tier scenarios.
For deaths, I'm currently using 4 weeks ago for "now", since the most recent three weeks will be revised significantly.
Note: "Effective May 1, 2024, hospitals are no longer required to report COVID-19 hospital admissions, hospital capacity, or hospital occupancy data." So, I'm no longer tracking hospitalizations.
| COVID Metrics | ||||
|---|---|---|---|---|
| Now | Week Ago | Goal | ||
| Deaths per Week | 466 | 592 | ≤3501 | |
| 1my goals to stop weekly posts. 🚩 Increasing number weekly for Deaths. ✅ Goal met. | ||||
 Click on graph for larger image.
This graph shows the weekly (columns) number of deaths reported since Jan 2023.
Although weekly deaths met the original goal to stop posting in June 2023 (low of 314 deaths), I've continued to post since deaths are above the goal again - and I'll continue to post until weekly deaths are once again below the goal.
Weekly deaths are now decreasing following the winter pickup and just under double the low of last June.
 This appears to be a leading indicator for COVID hospitalizations and deaths. This has been moving down.
Nationally COVID in wastewater is "Low".
Realtor.com Reports Active Inventory Up 30.3% YoY
by Calculated Risk on 4/11/2025 02:59:00 PM
What this means: On a weekly basis, Realtor.com reports the year-over-year change in active inventory and new listings. On a monthly basis, they report total inventory. For March, Realtor.com reported inventory was up 28.5% YoY, but still down 20.2% compared to the 2017 to 2019 same month levels.
Now - on a weekly basis - inventory is up 30.3% YoY.
Realtor.com has monthly and weekly data on the existing home market. Here is their weekly report: Weekly Housing Trends View—Data for Week Ending April 5, 2025 Here is a graph of the year-over-year change in inventory according to realtor.com.
Inventory was up year-over-year for the 74th consecutive week.
Realtor.com has monthly and weekly data on the existing home market. Here is their weekly report: Weekly Housing Trends View—Data for Week Ending April 5, 2025
• Active inventory climbed 30.3% from a year ago
The number of homes actively for sale remains significantly higher than last year, continuing a 74-week streak of annual gains. This year-over-year inventory growth gives buyers more choices and encourages more competitive pricing among sellers. Generally, the number of homes up for sale is still below pre-pandemic norms, and the long-standing supply gap will continue to put pressure on prices in under-supplied areas.
• New listings—a measure of sellers putting homes up for sale—increased 8.6%
New listings were up 8.6% compared with this time last year, marking the 13th straight week of annual growth.
• The median list price increased 0.1% year over year
The national median list price was up 0.1% compared with a year ago, marking the first year-over-year increase after 44 weeks of flat or declining prices. However, more data is needed to determine whether this modest growth signals a true turnaround. In particular, recent economic uncertainty may dampen buyer interest, potentially putting downward pressure on prices.
 Here is a graph of the year-over-year change in inventory according to realtor.com.
 Inventory was up year-over-year for the 74th consecutive week.
New listings have increased but remain below typical pre-pandemic levels.
Median prices are mostly unchanged year-over-year.
Q1 GDP Tracking: Near Zero Growth
by Calculated Risk on 4/11/2025 12:06:00 PM
From BofA:
Since our last publication, our 1Q GDP tracking has remained unchanged at 0.4% q/q saar. [Apr 11th estimate]From Goldman:
emphasis added
We left our Q1 GDP tracking estimate unchanged at +0.3% (quarter-over-quarter annualized). [Apr 3rd estimate]
 And from the Atlanta Fed: GDPNow
The GDPNow model estimate for real GDP growth (seasonally adjusted annual rate) in the first quarter of 2025 is -2.4 percent on April 9, up from -2.8 percent on April 3. The alternative model forecast, which adjusts for imports and exports of gold as described here, is -0.3 percent. After recent releases from the US Census Bureau and the US Bureau of Labor Statistics, both the standard model’s and the alternative model’s forecasts of first-quarter real final sales to private domestic purchasers growth increased from 1.4 percent to 2.0 percent. [Apr 9th estimate]
2nd Look at Local Housing Markets in March
by Calculated Risk on 4/11/2025 09:02:00 AM
Today, in the Calculated Risk Real Estate Newsletter: 2nd Look at Local Housing Markets in March
A brief excerpt:
This is the second look at several early reporting local markets in March. I’m tracking over 40 local housing markets in the US. Some of the 40 markets are states, and some are metropolitan areas. I’ll update these tables throughout the month as additional data is released.There is much more in the article.
Closed sales in March were mostly for contracts signed in January and February when 30-year mortgage rates averaged 6.96% and 6.84%, respectively (Freddie Mac PMMS). This was an increase from the average rate for homes that closed in February. This was before the recent surge in economic uncertainty and stock market volatility that might impact existing home sales.
...
In March, sales in these markets were down 1.3% YoY. Last month, in February, these same markets were down 6.2% year-over-year Not Seasonally Adjusted (NSA).
Important: There were the same number of working days in March 2025 (21) as in March 2024 (21). So, the year-over-year change in the headline SA data will be close to the change in the NSA data (there are other seasonal factors).
...
This was just several early reporting markets. Many more local markets to come!

Thursday, April 10, 2025
Friday: PPI
by Calculated Risk on 4/10/2025 07:50:00 PM
 Note: Mortgage rates are from MortgageNewsDaily.com and are for top tier scenarios.
Friday:
• At 8:30 AM ET, The Producer Price Index for March from the BLS. The consensus is for a 0.2% increase in PPI, and a 0.3% increase in core PPI.
• At 10:00 AM, University of Michigan's Consumer sentiment index (Preliminary for April).
Hotels: Occupancy Rate Decreased 0.6% Year-over-year
by Calculated Risk on 4/10/2025 03:47:00 PM
The U.S. hotel industry reported mixed year-over-year comparisons, according to CoStar’s latest data through 5 April. ...The following graph shows the seasonal pattern for the hotel occupancy rate using the four-week average.
30 March through 5 April 2025 (percentage change from comparable week in 2024):
• Occupancy: 63.8% (-0.6%)
• Average daily rate (ADR): US$160.18 (+1.4%)
• Revenue per available room (RevPAR): US$102.21 (+0.8%)
emphasis added
 Click on graph for larger image.
The red line is for 2025, blue is the median, and dashed light blue is for 2024. Dashed purple is for 2018, the record year for hotel occupancy.
The 4-week average of the occupancy rate is tracking last year and is at the median rate for the period 2000 through 2024 (Blue).
Note: Y-axis doesn't start at zero to better show the seasonal change.
The 4-week average will mostly move sideways until the summer travel season. We might see a hit to occupancy during the summer months due to less international tourism.
Part 2: Current State of the Housing Market; Overview for mid-April 2025
by Calculated Risk on 4/10/2025 12:45:00 PM
Today, in the Calculated Risk Real Estate Newsletter: Part 2: Current State of the Housing Market; Overview for mid-April 2025
A brief excerpt:
Yesterday, in Part 1: Current State of the Housing Market; Overview for mid-April 2025 I reviewed home inventory, housing starts and sales.There is much more in the article.
In Part 2, I will look at house prices, mortgage rates, rents and more.
These “Current State” summaries show us where we came from, where we are, and hopefully give us clues as to where we are going!
Note: Yesterday, I expressed concern about policy impacting housing and the economy. Then, at 12:57 PM ET, Goldman Sachs economists put out a note titled: Moving to a Recession Baseline. They argued - based on announced tariffs - that they were forecasting a recession and for the unemployment rate to rise to 5.7% in Q4.
Minutes later, a 90-day pause for most tariffs was announced (reducing tariffs to 10%, except China). An hour later Goldman Sachs put out a second note: Reverting to Our Previous Non-Recession Baseline. However, they still maintained a 45% change of recession in the next 12 months.
Forecasting is especially difficult with rapidly changing policy!
...
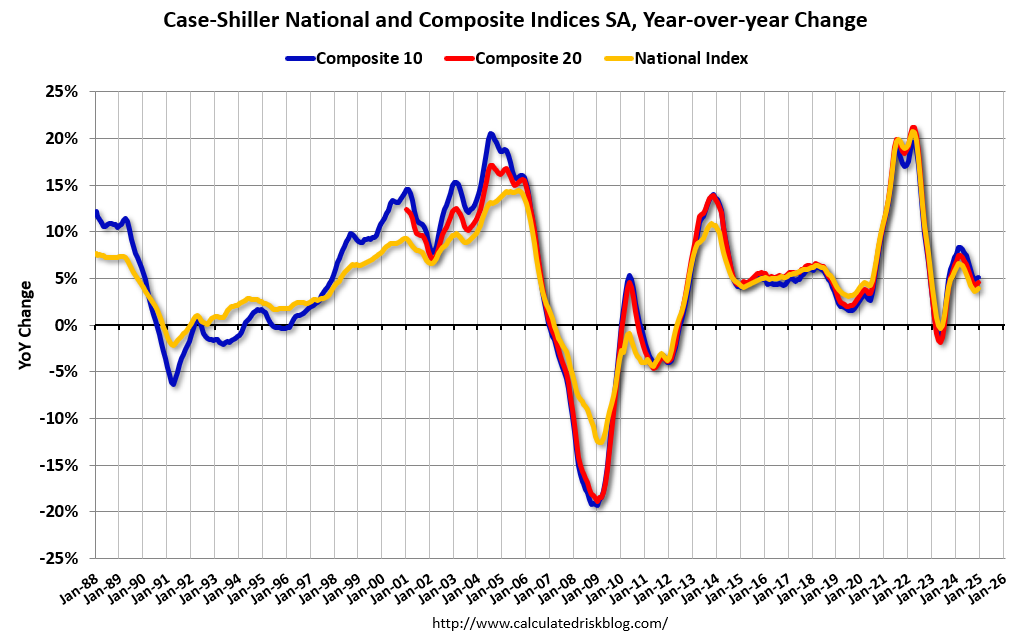
The Case-Shiller National Index increased 4.1% year-over-year (YoY) in January and will be about the same YoY - or slightly lower - in the February report (based on other data).
The MoM increase in the seasonally adjusted (SA) Case-Shiller National Index was at 0.57% (a 7.0% annual rate), This was the 24th consecutive MoM increase in the seasonally adjusted index.
Cleveland Fed: Median CPI increased 0.3% and Trimmed-mean CPI increased 0.2% in March
by Calculated Risk on 4/10/2025 11:20:00 AM
The Cleveland Fed released the median CPI and the trimmed-mean CPI.
According to the Federal Reserve Bank of Cleveland, the median Consumer Price Index rose 0.3% in February. The 16% trimmed-mean Consumer Price Index increased 0.2%. "The median CPI and 16% trimmed-mean CPI are measures of core inflation calculated by the Federal Reserve Bank of Cleveland based on data released in the Bureau of Labor Statistics’ (BLS) monthly CPI report".
 Click on graph for larger image.
This graph shows the year-over-year change for these four key measures of inflation.
On a year-over-year basis, the median CPI rose 3.5% (down slightly unrounded from 3.5% YoY in February), the trimmed-mean CPI rose 3.0% (down from 3.1%), and the CPI less food and energy rose 2.8% (down from 3.1%).
Core PCE is for February was up 2.8% YoY, up from 2.7% in January. Based on the CPI report this morning, Core PCE is expected to decline to 2.6% YoY in March.
YoY Measures of Inflation: Services, Goods and Shelter
by Calculated Risk on 4/10/2025 08:54:00 AM
Here are a few measures of inflation:
The first graph is the one Fed Chair Powell had mentioned two years ago when services less rent of shelter was up around 8% year-over-year. This declined and is now up 3.3% YoY.
 Click on graph for larger image.
This graph shows the YoY price change for Services and Services less rent of shelter through March 2025.
Services were up 3.7% YoY as of March 2025, down from 4.1% YoY in February.
Services less rent of shelter was up 3.3% YoY in March, down from 3.8% YoY in February.
Services less rent of shelter was up 3.3% YoY in March, down from 3.8% YoY in February.
 The second graph shows that goods prices started to increase year-over-year (YoY) in 2020 and accelerated in 2021 due to both strong demand and supply chain disruptions.
Durables were at -1.0% YoY as of March 2025, up from -1.2% YoY in February.
Commodities less food and energy commodities were at 0.0% YoY in March, unchanged from 0.0% YoY in February.
Commodities less food and energy commodities were at 0.0% YoY in March, unchanged from 0.0% YoY in February.
 Here is a graph of the year-over-year change in shelter from the CPI report (through March) and housing from the PCE report (through February)
Shelter was up 4.0% year-over-year in March, down from 4.2% in February. Housing (PCE) was up 4.3% YoY in February, down from 4.5% in January.
This is still catching up with private new lease data.
Core CPI ex-shelter was up 1.8% YoY in March.
BLS: CPI Decreased 0.1% in March; Core CPI increased 0.1%
by Calculated Risk on 4/10/2025 08:36:00 AM
The Consumer Price Index for All Urban Consumers (CPI-U) decreased 0.1 percent on a seasonally adjusted basis in March, after rising 0.2 percent in February, the U.S. Bureau of Labor Statistics reported today. Over the last 12 months, the all items index increased 2.4 percent before seasonal adjustment.The change in CPI was below expectations. I'll post a graph later today after the Cleveland Fed releases the median and trimmed-mean CPI.
The index for energy fell 2.4 percent in March, as a 6.3-percent decline in the index for gasoline more than offset increases in the indexes for electricity and natural gas. The food index, in contrast, rose 0.4 percent in March as the food at home index increased 0.5 percent and the food away from home index rose 0.4 percent over the month.
The index for all items less food and energy rose 0.1 percent in March, following a 0.2-percent increase in February. Indexes that increased over the month include personal care, medical care, education, apparel, and new vehicles. The indexes for airline fares, motor vehicle insurance, used cars and trucks, and recreation were among the major indexes that decreased in March.
The all items index rose 2.4 percent for the 12 months ending March, after rising 2.8 percent over the 12 months ending February. The all items less food and energy index rose 2.8 percent over the last 12 months, the smallest 12-month increase since March 2021. The energy index decreased 3.3 percent for the 12 months ending March. The food index increased 3.0 percent over the last year.
emphasis added
Weekly Initial Unemployment Claims Increase to 223,000
by Calculated Risk on 4/10/2025 08:30:00 AM
The DOL reported:
In the week ending April 5, the advance figure for seasonally adjusted initial claims was 223,000, an increase of 4,000 from the previous week's unrevised level of 219,000. The 4-week moving average was 223,000, unchanged from the previous week's unrevised average of 223,000.The following graph shows the 4-week moving average of weekly claims since 1971.
emphasis added
 Click on graph for larger image.
The dashed line on the graph is the current 4-week average. The four-week average of weekly unemployment claims was unchanged at 223,000.
The previous week was unchanged.
Weekly claims were close to the consensus forecast.


