 RSS Feed
 by Calculated Risk on 3/08/2025 02:11:00 PM
Saturday, March 08, 2025
Real Estate Newsletter Articles this Week: Property Insurance Costs Rose at a Record Rate in 2024
At the Calculated Risk Real Estate Newsletter this week:
 Click on graph for larger image.
• ICE Mortgage Monitor: Property Insurance Costs Rose at a Record Rate in 2024
• Fannie and Freddie: Single Family Serious Delinquency Rates Increased in January
• 1st Look at Local Housing Markets in February
• Asking Rents Mostly Unchanged Year-over-year
• Final Look at Local Housing Markets in January and a Look Ahead to February Sales
This is usually published 4 to 6 times a week and provides more in-depth analysis of the housing market.
Schedule for Week of March 9, 2025
by Calculated Risk on 3/08/2025 08:11:00 AM
The key report this week is February CPI.
No major economic releases scheduled.
6:00 AM ET: NFIB Small Business Optimism Index for February.
 10:00 AM ET: Job Openings and Labor Turnover Survey for January from the BLS.
 This graph shows job openings (black line), hires (purple), Layoff, Discharges and other (red column), and Quits (light blue column) from the JOLTS.
Jobs openings decreased in December to 7.60 million from 8.12 million in November.
7:00 AM ET: The Mortgage Bankers Association (MBA) will release the results for the mortgage purchase applications index.
8:30 AM: The Consumer Price Index for February from the BLS. The consensus is for a 0.3% increase in CPI, and a 0.3% increase in core CPI. The consensus is for CPI to be up 2.9% Year-over-year (YoY), and core CPI to be up 3.2% YoY.
8:30 AM: The initial weekly unemployment claims report will be released. The consensus is for 225 initial claims up from 221 thousand last week.
8:30 AM: The Producer Price Index for February from the BLS. The consensus is for a 0.3% increase in PPI, and a 0.3% increase in core PPI.
12:00 PM: Q4 Flow of Funds Accounts of the United States from the Federal Reserve.
10:00 AM: University of Michigan's Consumer sentiment index (Preliminary for March).
Friday, March 07, 2025
March 7th COVID Update: COVID Deaths Declining
by Calculated Risk on 3/07/2025 07:16:00 PM
 Note: Mortgage rates are from MortgageNewsDaily.com and are for top tier scenarios.
For deaths, I'm currently using 4 weeks ago for "now", since the most recent three weeks will be revised significantly.
Note: "Effective May 1, 2024, hospitals are no longer required to report COVID-19 hospital admissions, hospital capacity, or hospital occupancy data." So I'm no longer tracking hospitalizations.
| COVID Metrics | ||||
|---|---|---|---|---|
| Now | Week Ago | Goal | ||
| Deaths per Week | 735 | 878 | ≤3501 | |
| 1my goals to stop weekly posts. 🚩 Increasing number weekly for Deaths. ✅ Goal met. | ||||
 Click on graph for larger image.
This graph shows the weekly (columns) number of deaths reported since Jan 2023.
Although weekly deaths met the original goal to stop posting in June 2023 (low of 314 deaths), I'm continuing to post now that deaths are above the goal again - and I'll continue to post until weekly deaths are once again below the goal.
Weekly deaths are now decreasing following the winter pickup.
 This appears to be a leading indicator for COVID hospitalizations and deaths. This has moving down recently.
Nationally COVID in wastewater is "Low", down from "High" three weeks ago, according to the CDC.
Wholesale Used Car Prices Decreased in February; Up 0.1% Year-over-year
by Calculated Risk on 3/07/2025 05:13:00 PM
From Manheim Consulting today: Wholesale Used-Vehicle Prices Decreased in February
Wholesale used-vehicle prices (on a mix, mileage, and seasonally adjusted basis) were lower in February compared to January. The Manheim Used Vehicle Value Index (MUVVI) decreased to 204.1, which reflects a 0.1% increase from a year ago. The seasonal adjustment to the index drove the monthly move for the index, as non-seasonally adjusted values rose for the month. The non-adjusted price in February increased by 1.4% compared to January, moving the unadjusted average price up 0.8% year over year.
emphasis added
 Click on graph for larger image.
This index from Manheim Consulting is based on all completed sales transactions at Manheim’s U.S. auctions.
The Manheim index suggests used car prices decreased in February (seasonally adjusted) and were up 0.1% YoY.
Asking Rents Mostly Unchanged Year-over-year
by Calculated Risk on 3/07/2025 01:24:00 PM
Today, in the Real Estate Newsletter: Asking Rents Mostly Unchanged Year-over-year
Brief excerpt:
Another monthly update on rents.This is much more in the article.
Tracking rents is important for understanding the dynamics of the housing market. Slower household formation and increased supply (more multi-family completions) has kept asking rents under pressure. ...
Apartment List: Asking Rent Growth -0.4% Year-over-year ...
On the supply side of the rental market, our national vacancy index now sits at 6.9 percent, the highest reading in the history of that monthly data series, which goes back to the start of 2017. After a historic tightening in 2021, multifamily occupancy has been slowly but consistently easing for over three years amid an influx of new inventory. 2024 saw the most new apartment completions since the mid-1980s, and with nearly 800 thousand units still in the construction pipeline, the supply boom has runway to continue into 2025.Realtor.com: 18th Consecutive Month with Year-over-year Decline in RentsIn the first month of 2025, the median asking rent across the 50 largest U.S. metropolitan areas picked up slightly to $1,703, from $1,695 in December 2024, but it remains down 0.2% from one year ago. This marks the 18th consecutive month in which rents have fallen year over year.

Fed Chair Powell: Economic Outlook "Uncertainty"
by Calculated Risk on 3/07/2025 12:30:00 PM
From Fed Chair Powell: Economic Outlook
Despite elevated levels of uncertainty, the U.S. economy continues to be in a good place. The labor market is solid, and inflation has moved closer to our 2 percent longer-run goal. At the Federal Reserve, we are intently focused on the dual-mandate goals given to us by Congress: maximum employment and stable prices.
Recent Economic Data
Economic growth
The economy has been growing at a solid pace. GDP expanded at a 2.3 percent annual rate in the fourth quarter of last year, extending a period of consistent growth that has been supported by resilient consumer spending. Recent indicators point to a possible moderation in consumer spending relative to the rapid growth rate over the second half of 2024. Further, recent surveys of households and businesses point to heightened uncertainty about the economic outlook. It remains to be seen how these developments might affect future spending and investment. Sentiment readings have not been a good predictor of consumption growth in recent years. We continue to carefully monitor a variety of indicators of household and business spending.
The labor market
Many indicators show that the labor market is solid and broadly in balance. The jobs report released this morning showed employers added 151,000 jobs to payrolls in February and the unemployment rate was 4.1 percent last month. Smoothing over the month-to-month volatility, since September, employers have added a solid 191,000 jobs a month on average. The unemployment rate remains low and has held in a narrow range between 3.9 and 4.2 percent for the past year. The jobs-to-workers gap has narrowed, and the quits rate has moved below pre-pandemic levels. Wages are growing faster than inflation, and at a more sustainable pace than earlier in the pandemic recovery. With wage growth moderating and labor supply and demand having moved into better balance, the labor market is not a significant source of inflationary pressure.
Inflation
Inflation has come down a long way from its mid-2022 peak above 7 percent without a sharp increase in unemployment—a historically unusual and most welcome outcome. While progress in reducing inflation has been broad based, recent readings remain somewhat above our 2 percent objective. The path to sustainably returning inflation to our target has been bumpy, and we expect that to continue. We see ongoing progress in categories that remain elevated, such as housing services and the market-based components of non-housing services. Inflation can be volatile month-to-month, and we do not overreact to one or two readings that are higher or lower than anticipated. Data released last week showed that total PCE prices rose 2.5 percent over the 12 months ending in January and that, excluding the volatile food and energy categories, core PCE prices rose 2.6 percent. We pay close attention to a broad range of measures of inflation expectations, and some near-term measures have recently moved up. We see this in both market- and survey-based measures, and survey respondents, both consumers and businesses, are mentioning tariffs as a driving factor. Beyond the next year or so, however, most measures of longer-term expectations remain stable and consistent with our 2 percent inflation goal.
Monetary Policy
Looking ahead, the new Administration is in the process of implementing significant policy changes in four distinct areas: trade, immigration, fiscal policy, and regulation. It is the net effect of these policy changes that will matter for the economy and for the path of monetary policy. While there have been recent developments in some of these areas, especially trade policy, uncertainty around the changes and their likely effects remains high. As we parse the incoming information, we are focused on separating the signal from the noise as the outlook evolves. We do not need to be in a hurry, and are well positioned to wait for greater clarity.
Policy is not on a preset course. If the economy remains strong but inflation does not continue to move sustainably toward 2 percent, we can maintain policy restraint for longer. If the labor market were to weaken unexpectedly or inflation were to fall more quickly than anticipated, we can ease policy accordingly. Our current policy stance is well positioned to deal with the risks and uncertainties that we face in pursuing both sides of our dual mandate.
Conclusion
Before I conclude, I will note that at our last FOMC meeting, we began our second five-year review of our monetary policy framework. We will consider changes to our consensus statement (Statement on Longer-Run Goals and Monetary Policy Strategy) and to our communications as part of this review. The consensus statement articulates our framework for the conduct of monetary policy in pursuit of the goals assigned to us by Congress. We will consider lessons of the past five years and adapt our approach, where appropriate, to best serve the American people, to whom we are accountable. The 2 percent longer-run inflation goal will be retained and is not a focus of the review.
This public review will be familiar to those who followed our process five years ago. We will hold outreach events around the country involving a wide range of parties, including Fed Listens events. We are open to new ideas and critical feedback. We will host a research conference in Washington in May. Our intent is to wrap up the review by late summer.
Q1 GDP Tracking: Mid-to-High 1% Range
by Calculated Risk on 3/07/2025 10:35:00 AM
Special Note: There was a surge in gold imports in January. There is a time lag for when the imported gold will show up in inventories. GDPNow will correct for this once the gold is included as an increase in inventories, but currently GDPNow just included the import side. That is why GDPNow's tracking estimate of GDP is likely way too low.
From BofA:
Our 1Q GDP tracking is down from 2.3% q/q saar to 1.9% q/q saar since our last weekly publication. Also, after the second estimate of 4Q GDP, our 4Q tracking is up one-tenth to 2.4% q/q saar. [Mar 7th]From Goldman:
emphasis added
The details of the trade balance report indeed indicated that elevated gold imports contributed the bulk of increase in imports in January. Goods exports were softer than suggested by the Advance Economic Indicators report, while wholesale inventories were slightly firmer. Taken together, we lowered our Q1 GDP tracking estimate by 0.3pp to +1.3% (quarter-over-quarter annualized). [Mar 6th estimate]
 And from the Atlanta Fed: GDPNow
The GDPNow model estimate for real GDP growth (seasonally adjusted annual rate) in the first quarter of 2025 is -2.4 percent on March 6, up from -2.8 percent on March 3. After recent releases from the Institute for Supply Management, the US Bureau of Economic Analysis, and the US Census Bureau, the nowcasts of first-quarter real personal consumption expenditures growth and real gross private domestic investment growth increased from 0.0 percent and 2.5 percent, respectively, to 0.4 percent and 4.8 percent, while the nowcast of the contribution of net exports to first-quarter real GDP growth fell from -3.57 percentage points to -3.84 percentage points. [Mar 6th estimate]
Comments on February Employment Report
by Calculated Risk on 3/07/2025 09:05:00 AM
The headline jobs number in the February employment report was slightly below expectations, and December and January payrolls were revised down by 2,000 combined. The participation rate and the employment population ratio decreased, and the unemployment rate increased to 4.1%.
Prime (25 to 54 Years Old) Participation
 Since the overall participation rate is impacted by both cyclical (recession) and demographic (aging population, younger people staying in school) reasons, here is the employment-population ratio for the key working age group: 25 to 54 years old.
The 25 to 54 years old participation rate was unchanged in February at 83.5% from 83.5% in January.
The 25 to 54 employment population ratio decreased to 80.5% from 80.7% the previous month.
Both are down from the recent peaks, but still near the highest level this millennium.
Average Hourly Wages
 The graph shows the nominal year-over-year change in "Average Hourly Earnings" for all private employees from the Current Employment Statistics (CES).
Average Hourly Wages
 The graph shows the nominal year-over-year change in "Average Hourly Earnings" for all private employees from the Current Employment Statistics (CES).
 There was a huge increase at the beginning of the pandemic as lower paid employees were let go, and then the pandemic related spike reversed a year later.
Wage growth has trended down after peaking at 5.9% YoY in March 2022 and was at 4.0% YoY in February.
Wage growth has trended down after peaking at 5.9% YoY in March 2022 and was at 4.0% YoY in February.
Part Time for Economic Reasons
 From the BLS report:
"The number of people employed part time for economic reasons increased by 460,000 to 4.9 million in February. These individuals would have preferred full-time employment but were working part time because their hours had been reduced or they were unable to find full-time jobs."The number of persons working part time for economic reasons increased in February to 4.94 million from 4.48 million in January. This is above the pre-pandemic levels.
These workers are included in the alternate measure of labor underutilization (U-6) that increased to 8.0% from 7.5% in the previous month. This is down from the record high in April 2020 of 22.9% and up from the lowest level on record (seasonally adjusted) in December 2022 (6.6%). (This series started in 1994). This measure is above the 7.0% level in February 2020 (pre-pandemic).
Unemployed over 26 Weeks
 This graph shows the number of workers unemployed for 27 weeks or more.
 According to the BLS, there are 1.46 million workers who have been unemployed for more than 26 weeks and still want a job, up from 1.44 million the previous month.
This is down from post-pandemic high of 4.171 million, and up from the recent low of 1.056 million.
This is above pre-pandemic levels.
Job Streak
Summary:
The headline jobs number in the February employment report was slightly below expectations, and December and January payrolls were revised down by 2,000 combined. The participation rate and the employment population ratio decreased, and the unemployment rate increased to 4.1%.
This is above pre-pandemic levels.
Job Streak
Through February 2025, the employment report indicated positive job growth for 50 consecutive months, putting the current streak in 2nd place of the longest job streaks in US history (since 1939).
| Headline Jobs, Top 10 Streaks | ||
|---|---|---|
| Year Ended | Streak, Months | |
| 1 | 2020 | 113 |
| 2 | N/A | 501 |
| 3 | 1990 | 48 |
| 4 | 2007 | 46 |
| 5 | 1979 | 45 |
| 6 tie | 1943 | 33 |
| 6 tie | 1986 | 33 |
| 6 tie | 2000 | 33 |
| 9 | 1967 | 29 |
| 10 | 1995 | 25 |
| 1Currrent Streak | ||
Summary:
The headline jobs number in the February employment report was slightly below expectations, and December and January payrolls were revised down by 2,000 combined. The participation rate and the employment population ratio decreased, and the unemployment rate increased to 4.1%.
The headline number was decent.
February Employment Report: 151 thousand Jobs, 4.1% Unemployment Rate
by Calculated Risk on 3/07/2025 08:30:00 AM
From the BLS: Employment Situation
Total nonfarm payroll employment rose by 151,000 in February, and the unemployment rate changed little at 4.1 percent, the U.S. Bureau of Labor Statistics reported today. Employment trended up in health care, financial activities, transportation and warehousing, and social assistance. Federal government employment declined.
...
The change in total nonfarm payroll employment for December was revised up by 16,000, from +307,000 to +323,000, and the change for January was revised down by 18,000, from +143,000 to +125,000. With these revisions, employment in December and January combined is 2,000 lower than previously reported.
emphasis added
 Click on graph for larger image.
The first graph shows the jobs added per month since January 2021.
Total payrolls increased by 151 thousand in February. Private payrolls increased by 141 thousand, and public payrolls increased 11 thousand.
Payrolls for December and January were revised down 2 thousand, combined.
Payrolls for December and January were revised down 2 thousand, combined.
 The second graph shows the year-over-year change in total non-farm employment since 1968.
In February, the year-over-year change was 1.95 million jobs. Employment was up solidly year-over-year.
The third graph shows the employment population ratio and the participation rate.
 The Labor Force Participation Rate decreased to 62.4% in February, from 62.6% in January. This is the percentage of the working age population in the labor force.
 The Employment-Population ratio decreased to 59.9% from 60.1% in January (blue line).
I'll post the 25 to 54 age group employment-population ratio graph later.
 The fourth graph shows the unemployment rate.
 The unemployment rate increased to 4.1% in February from 4.0% in January.
This was slightly below consensus expectations, and December and January payrolls were revised down by 2,000 combined.
Thursday, March 06, 2025
Friday: Employment Report, Fed Chair Powell Speaks
by Calculated Risk on 3/06/2025 07:10:00 PM
 Note: Mortgage rates are from MortgageNewsDaily.com and are for top tier scenarios.
Friday:
• At 8:30 AM ET, Employment Report for February. The consensus is for 158,000 jobs added, and for the unemployment rate to be unchanged at 4.0%.
• At 12:30 PM: Speech, Fed Chair Jerome Powell, Economic Outlook, At The University of Chicago Booth School of Business 2025 U.S. Monetary Policy Forum, New York, N.Y.
February Employment Preview
by Calculated Risk on 3/06/2025 02:34:00 PM
On Friday at 8:30 AM ET, the BLS will release the employment report for February. The consensus is for 158,000 jobs added, and for the unemployment rate to be unchanged at 4.0%.
From Goldman Sachs:
We estimate nonfarm payrolls rose by 170k in February, slightly above consensus of +160k but below the three-month average of +237k. Alternative measures of employment growth indicated a firm pace of job creation, and we expect continued, albeit moderating, contributions from catch-up hiring and the recent surge in immigration. ... We estimate that the unemployment rate was unchanged on a rounded basis at 4.0%From BofA:
emphasis added
Feb non-farm payrolls are likely to print at a robust 185k. Government jobs are expected to come in at a slightly smaller than average 25k due to the federal hiring freeze. Given the muted claims data in the survey week, we do not expect DOGE driven job cuts to be a sizable drag on Feb data. Although, the colder than average weather could pose some downside risks. We expect the u-rate to remain at 4.0%.• ADP Report: The ADP employment report showed 77,000 private sector jobs were added in February. This was well below consensus forecasts and suggests job gains below consensus expectations, however, in general, ADP hasn't been very useful in forecasting the BLS report.
• ISM Surveys: Note that the ISM indexes are diffusion indexes based on the number of firms hiring (not the number of hires). The ISM® manufacturing employment index decreased to 47.6%, down from 50.3% the previous month. This would suggest about 30,000 jobs lost in manufacturing. The ADP report indicated 18,000 manufacturing jobs added in February.
The ISM® services employment index increased to 53.9%, from 52.3%. This would suggest 180,000 jobs added in the service sector. Combined this suggests 150,000 jobs added, close to consensus expectations. (Note: The ISM surveys have been way off recently)
• Unemployment Claims: The weekly claims report showed about the same initial unemployment claims during the reference week at 215,000 in February compared to 213,500 in January. This suggests layoffs in February were about the same as in January.
• Conclusion: Over the last year, employment gains averaged 168 thousand per month - and that is probably the current trend. With some bounce back from the cold weather in January, my guess is headline employment gains will be above consensus in February.
1st Look at Local Housing Markets in February
by Calculated Risk on 3/06/2025 11:50:00 AM
Today, in the Calculated Risk Real Estate Newsletter: 1st Look at Local Housing Markets in February
A brief excerpt:
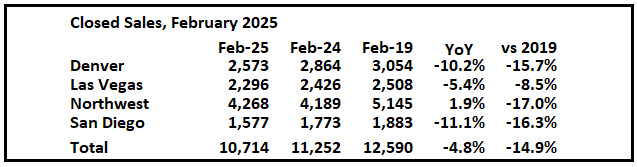
NOTE: The tables for active listings, new listings and closed sales all include a comparison to February 2019 for each local market (some 2019 data is not available).There is much more in the article.
This is the first look at a few early reporting local markets in February. I’m tracking over 40 local housing markets in the US. Some of the 40 markets are states, and some are metropolitan areas. I’ll update these tables throughout the month as additional data is released.
Closed sales in February were mostly for contracts signed in December and January when 30-year mortgage rates averaged 6.72% and 6.96%, respectively (Freddie Mac PMMS). This was an increase from the average rate for homes that closed in January, and up slightly from the average rate of 6.7% in December 2023 and January 2024.
...
In February, sales in these markets were down 4.8% YoY. Last month, in January, these same markets were up 7.2% year-over-year Not Seasonally Adjusted (NSA).
Note that most of these early reporting markets have shown stronger year-over-year sales than most other markets for the last several months.
Important: There was one fewer working day in February 2025 (19) as compared to February 2024 (20). So, the year-over-year change in the headline SA data will be above the change in the NSA data (there are other seasonal factors).
...
This was just a few early reporting markets. Many more local markets to come!
Trade Deficit increased to $131.4 Billion in January
by Calculated Risk on 3/06/2025 08:52:00 AM
The Census Bureau and the Bureau of Economic Analysis reported:
The U.S. Census Bureau and the U.S. Bureau of Economic Analysis announced today that the goods and services deficit was $131.4 billion in January, up $33.3 billion from $98.1 billion in December, revised.
January exports were $269.8 billion, $3.3 billion more than December exports. January imports were $401.2 billion, $36.6 billion more than December imports.
emphasis added
 Click on graph for larger image.
Both exports and imports increased in January.
Exports were up 4.1% year-over-year; imports were up 23.1% year-over-year.
Both imports and exports have generally increased recently.
The second graph shows the U.S. trade deficit, with and without petroleum.
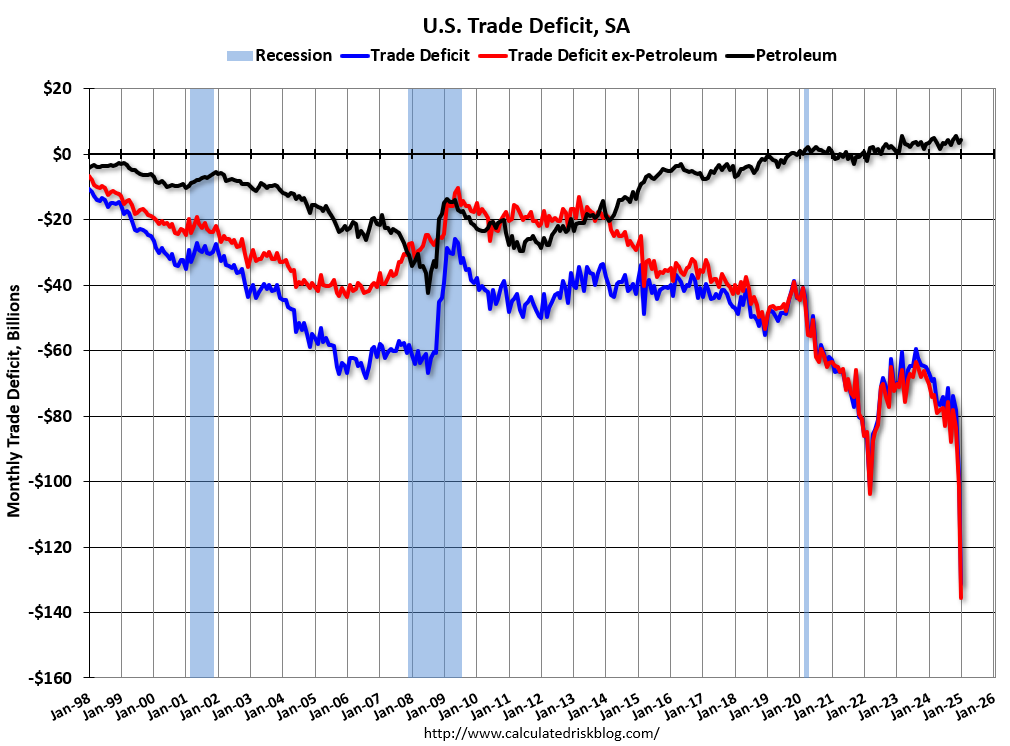 The blue line is the total deficit, and the black line is the petroleum deficit, and the red line is the trade deficit ex-petroleum products.
Note that net, exports of petroleum products are positive and have been increasing.
The trade deficit with China increased to $31.7 billion from $23.7 billion a year ago.
The surge in imports in January happened as some importers were avoiding the coming tariffs.
Weekly Initial Unemployment Claims Decrease to 221,000
by Calculated Risk on 3/06/2025 08:30:00 AM
The DOL reported:
In the week ending March 1, the advance figure for seasonally adjusted initial claims was 221,000, a decrease of 21,000 from the previous week's unrevised level of 242,000. The 4-week moving average was 224,250, an increase of 250 from the previous week's unrevised average of 224,000.The following graph shows the 4-week moving average of weekly claims since 1971.
emphasis added
 Click on graph for larger image.
The dashed line on the graph is the current 4-week average. The four-week average of weekly unemployment claims increased to 224,250.
The previous week was unrevised.
Weekly claims were lower than the consensus forecast.
Wednesday, March 05, 2025
Thursday: Unemployment Claims, Trade Deficit
by Calculated Risk on 3/05/2025 07:45:00 PM
 Note: Mortgage rates are from MortgageNewsDaily.com and are for top tier scenarios.
Thursday:
• At 8:30 AM ET, The initial weekly unemployment claims report will be released. The consensus is for 234 initial claims down from 242 thousand last week.
• Also, at 8:30 AM, U.S. International Trade in Goods and Services for January from the Census Bureau. The consensus is for a record U.S. trade deficit of $128.3 billion from $98.4 billion in December. Many importers were racing to beat potential tariffs.
CoreLogic: Home Prices Increased 3.3% Year-over-year in January
by Calculated Risk on 3/05/2025 03:25:00 PM
Notes: This CoreLogic House Price Index report is for January. The recent Case-Shiller index release was for December. The CoreLogic HPI is a three-month weighted average and is not seasonally adjusted (NSA).
From CoreLogic: CoreLogic: Home Price Growth Largely Flat in January
U.S. home price growth in January 2025 was largely flat at 3.3% year over year. Although prices are expected to eek out gains in the coming year, with our economists predicting a 3.6% increase from January 2025 to January 2026, there are stark differences between regions.This was the smaller YoY increase as reported for December.
The Northeast continues to buck overall national trends, remaining unbothered by slower job growth, elevated interest rates, and ongoing affordability concerns. Meanwhile, in the Mountain West, prices are the furthest from their record highs. In Hawaii, prices declined by 4.4%.
Despite this, national single-family home prices are forecast to reach a new peak in March 2025. Currently, the median sales price for all single-family homes in the U.S. is $375,000.
“Flattening home price changes over the last six months suggest further price deceleration is ahead,” said Dr. Selma Hepp, CoreLogic Chief Economist. “More importantly, compressed monthly changes highlight the general lack of home-buying demand that continues to characterize the current housing market. While this year's cold winter and large natural disasters play a role in dampening demand, falling consumer sentiment suggests potential homebuyers are wary of the short-term economic outlook and future inflation. Nevertheless, with the spring home buying season upon us, the recent improvements in mortgage rates may help invite homebuyers back into the market.”
emphasis added
This map is from the report.

• CoreLogic analysis suggests that Florida markets are continuing to fall out of favor while western New York is gaining popularity.
• Our economists anticipate further price deceleration in 2025, although recent improvements in mortgage rates may spur homebuying this spring.
• National home price growth is flat on a monthly basis. Annual home price growth is tracking just above inflation.
• Florida and Arizona top the charts for markets where the risk of price decline is very high.
Fed's Beige Book: "Overall economic activity rose slightly"
by Calculated Risk on 3/05/2025 02:00:00 PM
Overall economic activity rose slightly since mid-January. Six Districts reported no change, four reported modest or moderate growth, and two noted slight contractions. Consumer spending was lower on balance, with reports of solid demand for essential goods mixed with increased price sensitivity for discretionary items, particularly among lower-income shoppers. Unusual weather conditions in some regions over recent weeks weakened demand for leisure and hospitality services. Vehicle sales were modestly lower on balance. Manufacturing activity exhibited slight to modest increases across a majority of Districts. Contacts in manufacturing, ranging from petrochemical products to office equipment, expressed concerns over the potential impact of looming trade policy changes. Banking activity was slightly higher on balance among Districts that reported on it. Residential real estate markets were mixed, and reports pointed to ongoing inventory constraints. Construction activity declined modestly for both residential and nonresidential units. Some contacts in the sector also expressed nervousness around the impact of potential tariffs on the price of lumber and other materials. Agricultural conditions deteriorated some among reporting Districts. Overall expectations for economic activity over the coming months were slightly optimistic.
Labor Markets
Employment nudged slightly higher on balance, with four Districts reporting a slight increase, seven reporting no change, and one reporting a slight decline. Multiple Districts cited job growth in health care and finance, while employment declines were reported in manufacturing and information technology. Labor availability improved for many sectors and Districts, though there were occasional reports of a tight labor market in targeted sectors or occupations. Contacts in multiple Districts said rising uncertainty over immigration and other matters was influencing current and future labor demand. Wages grew at a modest-to-moderate pace, which was slightly slower than the previous report, with several Districts noting that wage pressures were easing.
Prices
Prices increased moderately in most Districts, but several Districts reported an uptick in the pace of increase relative to the previous reporting period. Input price pressures were generally greater than sales price pressures, particularly in manufacturing and construction. Many Districts noted that higher prices for eggs and other food ingredients were impacting food processors and restaurants. Reports of substantial increases in insurance and freight transportation costs were also widespread. Firms in multiple Districts noted difficulty passing input costs on to customers. However, contacts in most Districts expected potential tariffs on inputs would lead them to raise prices, with isolated reports of firms raising prices preemptively.
...
This report was prepared at the Federal Reserve Bank of Minneapolis based on information collected on or before February 24, 2025.
emphasis added
ICE Mortgage Monitor: Property Insurance Costs Rose at a Record Rate in 2024
by Calculated Risk on 3/05/2025 11:14:00 AM
Today, in the Real Estate Newsletter: ICE Mortgage Monitor: Property Insurance Costs Rose at a Record Rate in 2024
Brief excerpt:
Property Insurance Premiums Increased Sharply in 2024There is much more in the newsletter.
Here is a chart from the Mortgage Monitor. These increases are largely being driven by losses due to natural disasters.
• The average annual property insurance premium among mortgaged single-family homes rose by a record $276 (+14%) to $2,290 in 2024There is much more in the mortgage monitor.
• That’s the largest single-year increase on record dating back to 2013 when ICE began tracking the metric, and when stacked on top of the $245 (14%) increase seen in 2023 caps off a 61% ($872) increase over the past 5 years
• Property insurance costs continue to be the fastest-growing subcomponent of monthly home payments compared with principal, interest, and property taxes
• The average total mortgage payment (PITI) rose 6% last year, with the 14% rise in property insurance costs significantly outpacing an 8% rise in interest payments and the 5% rise in property taxes among all outstanding mortgages
• While all other subcomponents rose, the amount of principal paid on the average mortgage held flat from 2023
• Over the past 5 years we’ve seen 21-22% increases in principal, interest, and tax payments among the active mortgage population, roughly a third the rise in property insurance
ISM® Services Index Increased to 53.5% in February
by Calculated Risk on 3/05/2025 10:00:00 AM
(Posted with permission). The ISM® Services index was at 53.5%, up from 52.8% last month. The employment index increased to 53.9%, from 52.3%. Note: Above 50 indicates expansion, below 50 in contraction.
From the Institute for Supply Management: Services PMI® at 53.5% February 2025 Services ISM® Report On Business®
Economic activity in the services sector expanded for the eighth consecutive month in February, say the nation's purchasing and supply executives in the latest Services ISM® Report On Business®. The Services PMI® registered 53.5 percent, indicating expansion for the 54th time in 57 months since recovery from the coronavirus pandemic-induced recession began in June 2020.This was close to consensus expectations.
The report was issued today by Steve Miller, CPSM, CSCP, Chair of the Institute for Supply Management® (ISM®) Services Business Survey Committee: “In February, the Services PMI® registered 53.5 percent, 0.7 percentage point higher than the January figure of 52.8 percent. The Business Activity Index registered 54.4 percent in February, 0.1 percentage point lower than the 54.5 percent recorded in January. This is the index’s 57th consecutive month of expansion. The New Orders Index recorded a reading of 52.2 percent in February, 0.9 percentage point higher than the January figure of 51.3 percent. The Employment Index remained in expansion territory for the fifth consecutive month; the reading of 53.9 percent is a 1.6-percentage point increase compared to the 52.3 percent recorded in January.
emphasis added
ADP: Private Employment Increased 77,000 in February
by Calculated Risk on 3/05/2025 08:15:00 AM
“Policy uncertainty and a slowdown in consumer spending might have led to layoffs or a slowdown in hiring last month,” said Nela Richardson, chief economist, ADP. “Our data, combined with other recent indicators, suggests a hiring hesitancy among employers as they assess the economic climate ahead.”This was below the consensus forecast of 140,000. The BLS report will be released Friday, and the consensus is for 158,000 non-farm payroll jobs added in February.
emphasis added


