 RSS Feed
 by Calculated Risk on 2/24/2025 10:51:00 AM
Monday, February 24, 2025
The Normal Seasonal Change for Median House Prices
Earlier, in the CalculatedRisk Real Estate Newsletter on January existing home sales, NAR: Existing-Home Sales Decreased to 4.08 million SAAR in January, I mentioned that the median price typically bottoms seasonally in January (contracts signed mostly in November and December) and peaks in June (April and May contracts).
Below is a table of the seasonal changes from January to June (all median prices Not Seasonally Adjusted, NSA).
Note: In 2020, prices increased late into the year and peaked in October, but prices peaked in June for all the other years.
| Change in Median House Price from January to June | ||||||
|---|---|---|---|---|---|---|
| 2018 | 2019 | 2020 | 2021 | 2022 | 2023 | |
| January to June | 13.7% | 14.4% | 10.6% | 20.8% | 16.8% | 12.8% |
The NAR reported the median price was $396,900 in January 2025, down 7.0% from $426,900 in June 2024.
We should expect the median price to increase seasonally over the next 5 months, but only slightly in February.
Housing Feb 24th Weekly Update: Inventory Up 0.3% Week-over-week, Up 28.7% Year-over-year
by Calculated Risk on 2/24/2025 08:11:00 AM
Altos reports that active single-family inventory was up 0.3% week-over-week.
Inventory always declines seasonally in the Winter and usually bottoms in January or February. Inventory is now up 2.5% from the bottom six weeks ago in January.
The first graph shows the seasonal pattern for active single-family inventory since 2015.
 Click on graph for larger image.
The red line is for 2025. The black line is for 2019.
Inventory was up 28.7% compared to the same week in 2024 (last week it was up 29.2%), and down 21.9% compared to the same week in 2019 (last week it was down 22.1%).
Back in June 2023, inventory was down almost 54% compared to 2019, so the gap to more normal inventory levels has closed significantly!
 This second inventory graph is courtesy of Altos Research.
As of Feb 21st, inventory was at 640 thousand (7-day average), compared to 638 thousand the prior week.
Mike Simonsen discusses this data regularly on Youtube
Sunday, February 23, 2025
Sunday Night Futures
by Calculated Risk on 2/23/2025 06:17:00 PM
Weekend:
• Schedule for Week of February 23, 2025
• Housing Starts and Recessions
Monday:
• At 8:30 AM ET, Chicago Fed National Activity Index for January. This is a composite index of other data.
• At 10:30 AM, Dallas Fed Survey of Manufacturing Activity for February.
From CNBC: Pre-Market Data and Bloomberg futures S&P 500 are up 13 and DOW futures are up 67 (fair value).
Oil prices were down over the last week with WTI futures at $70.40 per barrel and Brent at $74.43 per barrel. A year ago, WTI was at $78, and Brent was at $84 - so WTI oil prices are down about 10% year-over-year.
Here is a graph from Gasbuddy.com for nationwide gasoline prices. Nationally prices are at $3.11 per gallon. A year ago, prices were at $3.26 per gallon, so gasoline prices are down $0.15 year-over-year.
Housing Starts and Recessions
by Calculated Risk on 2/23/2025 11:04:00 AM
This morning, Carl Quintanilla posted a graph on Bluesky from BESPOKE suggesting the US is heading towards a recession.
 Quintanilla quoted BESPOKE:
“On a 12-month average basis, .. Housing Starts have completely rolled over from their peak ..Housing is the basis of one of my favorite models for business cycle forecasting. And policy changes will clearly have a negative impact on homebuilders. Early in February, I expressed my "increasing concern" about the negative economic impact of "executive / fiscal policy errors", however, I concluded that post by noting that I was not currently on recession watch.
“.. Recessions have always followed a rollover in Housing Starts, and the only question is timing.”
Here is an update to a graph that uses new home sales, single family housing starts and residential investment. (I prefer single family starts to total starts). The purpose of this graph is to show that these three indicators generally reach peaks and troughs together. Note that Residential Investment is quarterly and single-family starts and new home sales are monthly.
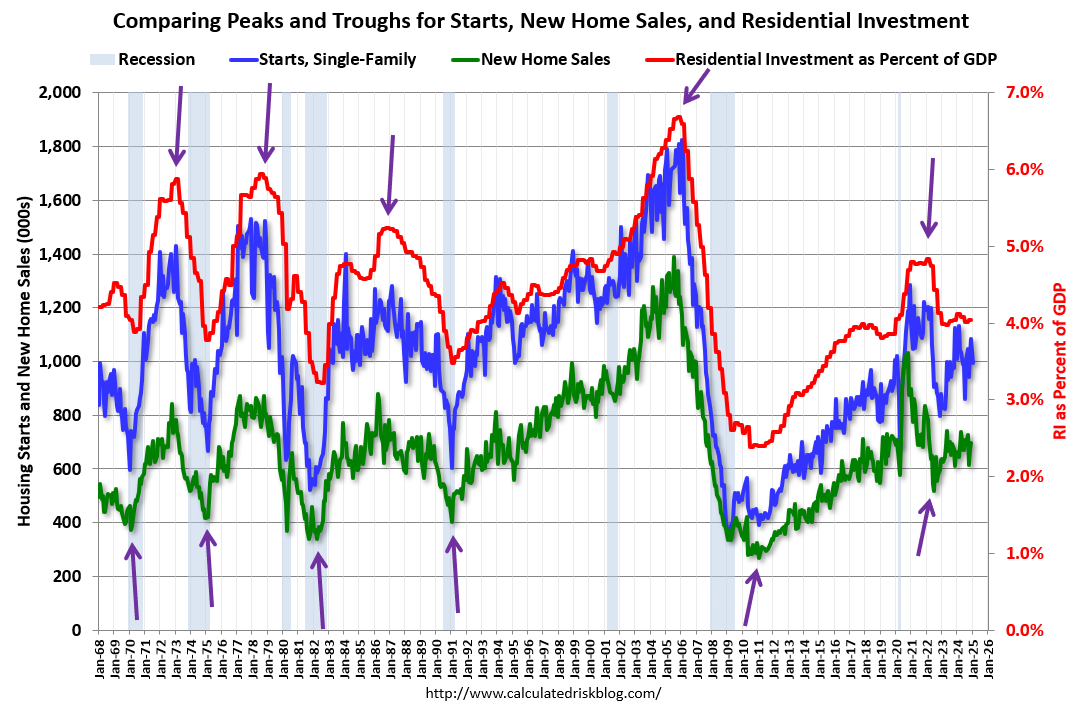 The arrows point to some of the earlier peaks and troughs for these three measures - and the most recent peak.
New home sales peaked in 2020 as pandemic buying soared. Then new home sales and single-family starts turned down in 2021, but that was partly due to the huge surge in sales during the pandemic. In 2022, both new home sales and single-family starts turned down in response to higher mortgage rates.
This decline in residential investment would typically have suggested that a recession was coming, however I looked past the pandemic distortions and correctly predicted no recession! The low level of existing home inventory led me to predict that new home sales would pick up - and that happened. We can't be a slave to any model.
 This second graph shows the YoY change in New Home Sales from the Census Bureau. Currently new home sales (based on 3-month average) are down 1% year-over-year!
Usually when the YoY change in New Home Sales falls about 20%, a recession will follow. An exception for this data series was the mid '60s when the Vietnam buildup kept the economy out of recession. Another exception was in late 2021 - we saw a significant YoY decline in new home sales related to the pandemic and the surge in new home sales in the second half of 2020. I ignored that downturn as a pandemic distortion. Also note that the sharp decline in 2010 was related to the housing tax credit policy in 2009 - and was just a continuation of the housing bust.
The YoY change in new home sales in late 2022 and early 2023 suggested a possible recession. But as I noted earlier, I was able to look past the pandemic distortion and was able to predict a pickup in new home sales due to the low level of existing home inventory and because homebuilders could offer mortgage incentives that would somewhat offset the sharp increase in mortgage rates.

Another indicator I like to use is heavy truck sales. This graph shows heavy truck sales since 1967 using data from the BEA. The dashed line is the January 2025 seasonally adjusted annual sales rate (SAAR). Note: "Heavy trucks - trucks more than 14,000 pounds gross vehicle weight."
Heavy truck sales were at 534 thousand SAAR in January, up from 454 thousand in December, and up 4.6% from 510 thousand SAAR in January 2025.
Usually, heavy truck sales decline sharply prior to a recession, however sales were strong in January.
I share BESPOKE's concern about the potential negative impact of policy on housing starts, but I think it is way too early to start predicting a recession.
Saturday, February 22, 2025
Real Estate Newsletter Articles this Week: Mortgage Delinquencies Increase, Foreclosures Remain Low
by Calculated Risk on 2/22/2025 02:11:00 PM
At the Calculated Risk Real Estate Newsletter this week:
 Click on graph for larger image.
• NAR: Existing-Home Sales Decreased to 4.08 million SAAR in January
• Housing Starts Decreased to 1.366 million Annual Rate in January
• The "Neutral" Rate and Implications for 30-year Mortgage Rates
• California Home Sales Down 1.9% YoY in January; 4th Look at Local Housing Markets
• Lawler: Early Read on Existing Home Sales in January
This is usually published 4 to 6 times a week and provides more in-depth analysis of the housing market.
Schedule for Week of February 23, 2025
by Calculated Risk on 2/22/2025 08:11:00 AM
The key reports this week are January New Home sales, the second estimate of Q4 GDP, Personal Income and Outlays for January, and Case-Shiller house prices.
For manufacturing, the February Dallas, Kansas City, and Richmond Fed manufacturing surveys will be released.
8:30 AM ET: Chicago Fed National Activity Index for January. This is a composite index of other data.
10:30 AM: Dallas Fed Survey of Manufacturing Activity for February.
9:00 AM: FHFA House Price Index for December 2024. This was originally a GSE only repeat sales, however there is also an expanded index.
 9:00 AM: S&P/Case-Shiller House Price Index for December.
This graph shows the year-over-year change for the Case-Shiller National, Composite 10 and Composite 20 indexes, through the most recent report (the Composite 20 was started in January 2000).
The consensus is for a 4.5% year-over-year increase in the Comp 20 index for December, up from 4.3% in November.
10:00 AM: Richmond Fed Survey of Manufacturing Activity for February.
7:00 AM ET: The Mortgage Bankers Association (MBA) will release the mortgage purchase applications index.
 10:00 AM: New Home Sales for January from the Census Bureau.
 This graph shows New Home Sales since 1963.
The dashed line is the sales rate for last month.
The consensus is that new home sales decreased to 678 thousand SAAR, down from 698 thousand in December.
----- Thursday, February 27th -----
8:30 AM: The initial weekly unemployment claims report will be released. The consensus is for an increase to 225 thousand from 219 thousand last week.
8:30 AM: Gross Domestic Product, 4th Quarter and Year 2024 (Second Estimate) The consensus is that real GDP increased 2.3% annualized in Q4, unchanged from the advance estimate of 2.3%.
8:30 AM: Durable Goods Orders for January from the Census Bureau. The consensus is for a 1.8% increase in durable goods orders.
10:00 AM: Pending Home Sales Index for January. The consensus is for a 1.2% decrease in the index.
11:00 AM: the Kansas City Fed manufacturing survey for February.
----- Friday, February 28th -----
8:30 AM ET: Personal Income and Outlays for January. The consensus is for a 0.3% increase in personal income, and for a 0.2% increase in personal spending. And for the Core PCE price index to increase 0.2%. PCE prices are expected to be up 2.5% YoY, and core PCE prices up 2.6% YoY.
9:45 AM: Chicago Purchasing Managers Index for February.
8:30 AM: The initial weekly unemployment claims report will be released. The consensus is for an increase to 225 thousand from 219 thousand last week.
8:30 AM: Gross Domestic Product, 4th Quarter and Year 2024 (Second Estimate) The consensus is that real GDP increased 2.3% annualized in Q4, unchanged from the advance estimate of 2.3%.
8:30 AM: Durable Goods Orders for January from the Census Bureau. The consensus is for a 1.8% increase in durable goods orders.
10:00 AM: Pending Home Sales Index for January. The consensus is for a 1.2% decrease in the index.
11:00 AM: the Kansas City Fed manufacturing survey for February.
8:30 AM ET: Personal Income and Outlays for January. The consensus is for a 0.3% increase in personal income, and for a 0.2% increase in personal spending. And for the Core PCE price index to increase 0.2%. PCE prices are expected to be up 2.5% YoY, and core PCE prices up 2.6% YoY.
9:45 AM: Chicago Purchasing Managers Index for February.
Friday, February 21, 2025
February 21st COVID Update: COVID in Wastewater Declining
by Calculated Risk on 2/21/2025 07:03:00 PM
 Note: Mortgage rates are from MortgageNewsDaily.com and are for top tier scenarios.
For deaths, I'm currently using 4 weeks ago for "now", since the most recent three weeks will be revised significantly.
Note: "Effective May 1, 2024, hospitals are no longer required to report COVID-19 hospital admissions, hospital capacity, or hospital occupancy data." So I'm no longer tracking hospitalizations.
| COVID Metrics | ||||
|---|---|---|---|---|
| Now | Week Ago | Goal | ||
| Deaths per Week | 859 | 953 | ≤3501 | |
| 1my goals to stop weekly posts. 🚩 Increasing number weekly for Deaths. ✅ Goal met. | ||||
 Click on graph for larger image.
This graph shows the weekly (columns) number of deaths reported since Jan 2023.
Although weekly deaths met the original goal to stop posting in June 2023 (low of 314 deaths), I'm continuing to post now that deaths are above the goal again - and I'll continue to post until weekly deaths are once again below the goal.
Weekly deaths are now decreasing following the winter pickup.
 This appears to be a leading indicator for COVID hospitalizations and deaths. This has moving down recently.
Nationally COVID in wastewater is "Moderate", down from "High" last week, according to the CDC.
Q1 GDP Tracking: Around 2%
by Calculated Risk on 2/21/2025 02:06:00 PM
From BofA:
We initiated our 1Q US GDP tracker with the January retail sales print on February 14. Since then, our 1Q GDP tracker is down two-tenths to 2.3% q/q saar from our official forecast of 2.5% q/q saar. Meanwhile, our 4Q GDP tracking is down two-tenths to 2.2% q/q saar since our last weekly publication. [Feb 21st]From Goldman:
emphasis added
[W]e lowered our Q1 GDP tracking estimate by 0.1pp to +1.9% (quarter-over-quarter annualized) and our Q1 domestic final sales estimate by 0.1pp to +2.1%. We left our Q4 past quarter tracking estimate unchanged at +2.1%. [Feb 19th estimate]And from the Atlanta Fed: GDPNow
[T]he GDPNow model estimate for real GDP growth (seasonally adjusted annual rate) in the first quarter of 2025 is 2.3 percent on February 19, unchanged from February 14 after rounding. [Feb 19th estimate]
Newsletter: Existing-Home Sales Decreased to 4.08 million SAAR in January
by Calculated Risk on 2/21/2025 11:05:00 AM
Today, in the CalculatedRisk Real Estate Newsletter: NAR: Existing-Home Sales Decreased to 4.08 million SAAR in January
Excerpt:
Sales in January (4.08 million SAAR) were down 4.9% from the previous month and were 2.0% above the January 2024 sales rate. This was the fourth consecutive year-over-year increase after declining YoY every month for over 3 years.There is much more in the article.
...
Sales Year-over-Year and Not Seasonally Adjusted (NSA)
The fourth graph shows existing home sales by month for 2024 and 2025.
Sales increased 2.0% year-over-year compared to January 2024.

NAR: Existing-Home Sales Decreased to 4.08 million SAAR in January
by Calculated Risk on 2/21/2025 10:00:00 AM
From the NAR: Existing-Home Sales Decreased 4.9% in January, But Increased Year-Over-Year for Fourth Consecutive Month
Existing-home sales retreated in January, according to the National Association of REALTORS®. Sales slipped in three major U.S. regions and held steady in the Midwest. Year-over-year, sales rose in three regions and were unchanged in the South.
Total existing-home sales – completed transactions that include single-family homes, townhomes, condominiums and co-ops – descended 4.9% from December to a seasonally adjusted annual rate of 4.08 million in January. Year-over-year, sales improved 2.0% (up from 4 million in January 2024).
...
Total housing inventory registered at the end of January was 1.18 million units, up 3.5% from December and 16.8% from one year ago (1.01 million). Unsold inventory sits at a 3.5-month supply at the current sales pace, up from 3.2 months in December and 3.0 months in January 2024.
emphasis added
Click on graph for larger image.This graph shows existing home sales, on a Seasonally Adjusted Annual Rate (SAAR) basis since 1994.
Sales in January (4.08 million SAAR) were down 4.9% from the previous month and were 2.0% above the January 2024 sales rate. This was the fourth consecutive year-over-year increase after declining YoY every month for over 3 years.
The second graph shows nationwide inventory for existing homes.
 According to the NAR, inventory increased to 1.18 million in January from 1.14 million the previous month.
 According to the NAR, inventory increased to 1.18 million in January from 1.14 million the previous month.
Headline inventory is not seasonally adjusted, and inventory usually decreases to the seasonal lows in December and January, and peaks in mid-to-late summer.
The last graph shows the year-over-year (YoY) change in reported existing home inventory and months-of-supply. Since inventory is not seasonally adjusted, it really helps to look at the YoY change. Note: Months-of-supply is based on the seasonally adjusted sales and not seasonally adjusted inventory.
 Inventory was up 16.8% year-over-year (blue) in January compared to January 2024.
Months of supply (red) increased to 3.5 months in January from 3.2 months the previous month.
The sales rate was below the consensus forecast. I'll have more later.
The last graph shows the year-over-year (YoY) change in reported existing home inventory and months-of-supply. Since inventory is not seasonally adjusted, it really helps to look at the YoY change. Note: Months-of-supply is based on the seasonally adjusted sales and not seasonally adjusted inventory.
 Inventory was up 16.8% year-over-year (blue) in January compared to January 2024.
 Months of supply (red) increased to 3.5 months in January from 3.2 months the previous month.
The sales rate was below the consensus forecast. I'll have more later.
ICE: Mortgage Delinquency Rate Decreased in January
by Calculated Risk on 2/21/2025 08:07:00 AM
• Delinquencies fell 24 basis points (bps) to 3.47% in January; that’s 10 bps higher than last year, but 33 bps below pre-pandemic levels
• Foreclosure starts jumped by 30% and sales rose by 25% in January – driven by an expiration in the VA foreclosure moratorium – with active inventory rising by 7% in the month
• While the number of borrowers past due as a result of last year’s hurricanes has fallen from 58K to 41K in recent months, the financial impact from the recent Los Angeles wildfires is emerging
• An estimated 680 homeowners in the path of the Los Angeles wildfires missed their January mortgage payment, and ICE’s daily mortgage performance data suggests the number of past-due borrowers could surpass 2,800 by the end of February.
• Prepayment activity (SMM) fell to 0.48% in January, its lowest level in nearly a year, driven by the combination of modestly higher rates and the typical seasonal slowdown in home sale activity
emphasis added
 Click on graph for larger image.
Here is a table from ICE.
Thursday, February 20, 2025
Friday: Existing Home Sales
by Calculated Risk on 2/20/2025 07:01:00 PM
 Note: Mortgage rates are from MortgageNewsDaily.com and are for top tier scenarios.
Friday:
• At 10:00 AM ET, Existing Home Sales for January from the National Association of Realtors (NAR). The consensus is for 4.17 million SAAR, down from 4.24 million.
• Also at 10:00 AM, University of Michigan's Consumer sentiment index (Final for February).
Realtor.com Reports Active Inventory Up 27.6% YoY
by Calculated Risk on 2/20/2025 03:25:00 PM
What this means: On a weekly basis, Realtor.com reports the year-over-year change in active inventory and new listings. On a monthly basis, they report total inventory. For January, Realtor.com reported inventory was up 24.6% YoY, but still down 24.8% compared to the 2017 to 2019 same month levels.
Now - on a weekly basis - inventory is up 27.6% YoY.
Realtor.com has monthly and weekly data on the existing home market. Here is their weekly report: Weekly Housing Trends View—Data for Week Ending Feb. 15, 2025 Here is a graph of the year-over-year change in inventory according to realtor.com.
Inventory was up year-over-year for the 67th consecutive week.
Realtor.com has monthly and weekly data on the existing home market. Here is their weekly report: Weekly Housing Trends View—Data for Week Ending Feb. 15, 2025
• Active inventory increased, with for-sale homes 27.6% above year-ago levels
For the 67th consecutive week, the number of homes for sale has increased compared with the same time last year. This week also marked the sixth straight week where the growth rate has increased, fueled by the entrance of many new listings on the market.
• New listings—a measure of sellers putting homes up for sale—increased 5%
Newly listed inventory increased year over year for the sixth week in a row, as sellers go online for the spring buying season. Despite mortgage rates remaining stubbornly high and many prospective sellers feeling the lock-in effect due to their lower previous rates, new homes are hitting the market at a faster pace than in 2024 at this time.
 Here is a graph of the year-over-year change in inventory according to realtor.com.
 Inventory was up year-over-year for the 67th consecutive week.
New listings have jumped recently but remain below typical pre-pandemic levels.
California Home Sales Down 1.9% YoY in January; 4th Look at Local Housing Markets
by Calculated Risk on 2/20/2025 12:36:00 PM
Today, in the Calculated Risk Real Estate Newsletter: California Home Sales Down 1.9% YoY in January; 4th Look at Local Housing Markets
A brief excerpt:
Here a few more local markets prior to the NAR release tomorrow.There is much more in the article.
The NAR is scheduled to release January Existing Home sales on Friday, February 21st at 10:00 AM. The consensus is for 4.10 million SAAR, down from 4.24 million in December. Last year, the NAR reported sales in January 2024 at 4.00 million SAAR.
Housing economist Tom Lawler expects the NAR to report sales of 4.09 million SAAR for January.
...
From the California Association of Realtors® (C.A.R.): Elevated mortgage rates drag down January home sales, C.A.R. reportsJanuary’s sales pace fell from the 282,490 homes sold in December and was down 1.9 percent from a year ago, when a revised 259,160 homes were sold on an annualized basis. The January sales level was the lowest in 13 months, and the double-digit month-to-month sales decline was the biggest decrease in 30 months. The year-over-year decline was the first in eight months....
Several local markets - like Illinois, Miami, New Jersey and New York - will report after the NAR release.
LA Ports: Record Inbound Traffic for January
by Calculated Risk on 2/20/2025 09:49:00 AM
This was a new record for imports in January, eclipsing the previous recent (Jan 2022) by 17%!
Container traffic gives us an idea about the volume of goods being exported and imported - and usually some hints about the trade report since LA area ports handle about 40% of the nation's container port traffic.
The following graphs are for inbound and outbound traffic at the ports of Los Angeles and Long Beach in TEUs (TEUs: 20-foot equivalent units or 20-foot-long cargo container).
To remove the strong seasonal component for inbound traffic, the first graph shows the rolling 12-month average.
 Click on graph for larger image.
On a rolling 12-month basis, inbound traffic increased 1.9% in January compared to the rolling 12 months ending in December. Outbound traffic was unchanged compared to the rolling 12 months ending the previous month.
The 2nd graph is the monthly data (with a strong seasonal pattern for imports).
 Usually imports peak in the July to October period as retailers import goods for the Christmas holiday and then decline sharply and bottom in the Winter depending on the timing of the Chinese New Year.
 Usually imports peak in the July to October period as retailers import goods for the Christmas holiday and then decline sharply and bottom in the Winter depending on the timing of the Chinese New Year.
 Imports were up 25% YoY in January and exports were down slightly YoY.
This was a very strong July through January period as importers were likely stockpiling goods prior to the increase in tariffs.
Weekly Initial Unemployment Claims Increase to 219,000
by Calculated Risk on 2/20/2025 08:30:00 AM
The DOL reported:
In the week ending February 15, the advance figure for seasonally adjusted initial claims was 219,000, an increase of 5,000 from the previous week's revised level. The previous week's level was revised up by 1,000 from 213,000 to 214,000. The 4-week moving average was 215,250, a decrease of 1,000 from the previous week's revised average. The previous week's average was revised up by 250 from 216,000 to 216,250.The following graph shows the 4-week moving average of weekly claims since 1971.
emphasis added
 Click on graph for larger image.
The dashed line on the graph is the current 4-week average. The four-week average of weekly unemployment claims decreased to 215,250.
The previous week was revised up.
Weekly claims were above the consensus forecast.
Wednesday, February 19, 2025
Thursday: Unemployment Claims, Philly Fed Mfg
by Calculated Risk on 2/19/2025 07:24:00 PM
 Note: Mortgage rates are from MortgageNewsDaily.com and are for top tier scenarios.
Thursday:
• At 8:30 AM ET, The initial weekly unemployment claims report will be released. The consensus is for an increase to 216 thousand from 213 thousand last week.
• Also at 8:30 AM, The Philly Fed manufacturing survey for February. The consensus is for a reading of 25.4, down from 44.3.
AIA: Architecture Billings "Billings remain soft to start the new year"
by Calculated Risk on 2/19/2025 04:01:00 PM
Note: This index is a leading indicator primarily for new Commercial Real Estate (CRE) investment.
From the AIA: ABI January 2025: Architecture firm billings remain soft to start the new year
The AIA/Deltek Architecture Billings Index (ABI) score was 45.6 for the month, slightly above the December score. This means that while a majority of firms still saw their billings decrease in January, the share of firms experiencing that decrease was slightly smaller than in December. Inquiries into new projects continued to grow at the same slow pace as in recent months, but the value of newly signed design contracts declined for the eleventh consecutive month as clients remained cautious about committing to new projects during the ongoing economic uncertainty. (Note that every January, the seasonal adjustment factors for all ABI data series are revised, leading to revisions in recent historical data.)• Northeast (41.1); Midwest (45.6); South (46.0); West (48.8)
Billings were also soft at firms in all regions of the country in January. Firms located in the West saw very modest billings growth in the fourth quarter of 2024, but unfortunately, billings returned to negative territory to start the new year. Business conditions remained softest at firms located in the Northeast, which has been the trend in recent months. And billings softened further at firms located in the South, which saw more encouraging signs last fall, before weakening again. Billings also declined at firms of all specializations in January. Firms with a commercial/industrial specialization continued to be most likely to report softening business conditions, but billings have weakened at firms of all specializations in recent months.
...
The ABI score is a leading economic indicator of construction activity, providing an approximately nine-to-twelve-month glimpse into the future of nonresidential construction spending activity. The score is derived from a monthly survey of architecture firms that measures the change in the number of services provided to clients.
emphasis added
• Sector index breakdown: commercial/industrial (43.1); institutional (47.4); multifamily residential (45.0)
 Click on graph for larger image.
This graph shows the Architecture Billings Index since 1996. The index was at 45.6 in January, up from 44.1 in December. Anything below 50 indicates a decrease in demand for architects' services.
This index has indicated contraction for 26 of the last 28 months.
Note: This includes commercial and industrial facilities like hotels and office buildings, multi-family residential, as well as schools, hospitals and other institutions.
This index usually leads CRE investment by 9 to 12 months, so this index suggests a slowdown in CRE investment in 2025.
Note: This includes commercial and industrial facilities like hotels and office buildings, multi-family residential, as well as schools, hospitals and other institutions.
This index usually leads CRE investment by 9 to 12 months, so this index suggests a slowdown in CRE investment in 2025.
Multi-family billings remained negative has been negative for the last 30 months. This suggests we will see further weakness in multi-family starts.
FOMC Minutes: Concern about tariffs, "take time" on any additional Rate Cuts
by Calculated Risk on 2/19/2025 02:00:00 PM
From the Fed: Minutes of the Federal Open Market Committee, January 28–29, 2025. Excerpt:
With regard to the outlook for inflation, participants expected that, under appropriate monetary policy, inflation would continue to move toward 2 percent, although progress could remain uneven. Participants cited various factors as likely to put continuing downward pressure on inflation, including an easing in nominal wage growth, well-anchored longer-term inflation expectations, waning business pricing power, and the Committee's still-restrictive monetary policy stance. A few noted, however, that the current target range for the federal funds rate may not be far above its neutral level. Furthermore, some participants commented that with supply and demand in the labor market roughly in balance and in light of recent productivity gains, labor market conditions were unlikely to be a source of inflationary pressure in the near future. However, other factors were cited as having the potential to hinder the disinflation process, including the effects of potential changes in trade and immigration policy as well as strong consumer demand. Business contacts in a number of Districts had indicated that firms would attempt to pass on to consumers higher input costs arising from potential tariffs. In addition, some participants noted that some market- or survey-based measures of expected inflation had increased recently, although many participants emphasized that longer-term measures of expected inflation had remained well anchored. Some participants remarked that reported inflation at the beginning of the year was harder than usual to interpret because of the difficulties in fully removing seasonal effects, and a couple of participants commented that any increase in reported inflation in the first quarter due to such difficulties would imply a corresponding decrease in reported inflation in other quarters of the year.
...
In discussing the outlook for monetary policy, participants observed that the Committee was well positioned to take time to assess the evolving outlook for economic activity, the labor market, and inflation, with the vast majority pointing to a still-restrictive policy stance. Participants indicated that, provided the economy remained near maximum employment, they would want to see further progress on inflation before making additional adjustments to the target range for the federal funds rate. Participants noted that policy decisions were not on a preset course and were conditional on the evolution of the economy, the economic outlook, and the balance of risks.
emphasis added
Newsletter: Housing Starts Decreased to 1.366 million Annual Rate in January
by Calculated Risk on 2/19/2025 09:17:00 AM
Today, in the Calculated Risk Real Estate Newsletter: Housing Starts Decreased to 1.366 million Annual Rate in January
A brief excerpt:
Total housing starts in January were below expectations; however, starts in November and December were revised up.There is much more in the article.
The third graph shows the month-to-month comparison for total starts between 2024 (blue) and 2025 (red).
Total starts were down 0.7% in January compared to January 2024. There were significant regional differences in January with starts in the Northeast region down sharply year-over-year (likely weather related).
Single family starts have been up year-over-year in 14 of the last 19 months, whereas multi-family has been up year-over-year in only 4 of last 20 months.


