 RSS Feed
 by Calculated Risk on 2/04/2025 04:40:00 PM
Tuesday, February 04, 2025
U.S. Courts: Bankruptcy Filings Increase 14 Percent in 2024; 33% Below Pre-Pandemic Levels
From the U.S. Courts: Bankruptcy Filings Rise 14.2 Percent
Total bankruptcy filings rose 14.2 percent, with increases in both business and non-business bankruptcies, in the twelve-month period ending Dec. 31, 2024. This continues an ongoing rebound in filings after more than a decade of sharply dropping totals.
According to statistics released by the Administrative Office of the U.S. Courts, annual bankruptcy filings totaled 517,308 in the year ending December 2024, compared with 452,990 cases in the previous year.
Business filings rose 22.1 percent, from 18,926 to 23,107, in the year ending Dec. 31, 2024. Non-business bankruptcy filings rose 13.9 percent to 494,201, compared with 434,064 in December 2023.
Bankruptcy totals for the previous 12 months are reported four times annually.
For more than a decade, total filings fell steadily, from a high of nearly 1.6 million in September 2010 to a low of 380,634 in June 2022. Total filings have increased each quarter since then, but they remain far lower than historical highs.
emphasis added
 Click on graph for larger image.
This graph shows the business and non-business bankruptcy filings by calendar year since 1997.
The sharp decline in 2006 was due to the so-called "Bankruptcy Abuse Prevention and Consumer Protection Act of 2005".
2024 was the 4th lowest year for bankruptcy filings, and 33% below the pre-pandemic level in 2019.
Heavy Truck Sales Increased 5% YoY in January
by Calculated Risk on 2/04/2025 02:44:00 PM
This graph shows heavy truck sales since 1967 using data from the BEA. The dashed line is the January 2025 seasonally adjusted annual sales rate (SAAR) of 534 thousand.
Heavy truck sales really collapsed during the great recession, falling to a low of 180 thousand SAAR in May 2009. Then heavy truck sales increased to a new record high of 570 thousand SAAR in April 2019.
 Click on graph for larger image.
Note: "Heavy trucks - trucks more than 14,000 pounds gross vehicle weight."
Heavy truck sales declined sharply at the beginning of the pandemic, falling to a low of 288 thousand SAAR in May 2020.
Heavy truck sales were at 534 thousand SAAR in January, up from 454 thousand in December, and up 4.6% from 510 thousand SAAR in January 2025.
Usually, heavy truck sales decline sharply prior to a recession. Currently heavy truck sales are solid.
As I mentioned yesterday, light vehicle sales decreased in January.
 The second graph shows light vehicle sales since the BEA started keeping data in 1967.
 Light vehicle sales were at 15.60 million SAAR in January, down from 16.87 million in November, and up 3.8% from 15.03 million in January 2024.
Fannie and Freddie: Single Family Serious Delinquency Rates Increased in December
by Calculated Risk on 2/04/2025 11:27:00 AM
Today, in the Calculated Risk Real Estate Newsletter: Fannie and Freddie: Single Family Serious Delinquency Rates Increased in December
Excerpt:
Freddie Mac reported that the Single-Family serious delinquency rate in December was 0.59%, up from 0.56% November. Freddie's rate is up year-over-year from 0.55% in December 2023, however, this is below the pre-pandemic level of 0.60%.
Freddie's serious delinquency rate peaked in February 2010 at 4.20% following the housing bubble and peaked at 3.17% in August 2020 during the pandemic.
Fannie Mae reported that the Single-Family serious delinquency rate in December was 0.56%, up from 0.53% in November. The serious delinquency rate is up year-over-year from 0.55% in December 2023, however, this is below the pre-pandemic lows of 0.65%.
The Fannie Mae serious delinquency rate peaked in February 2010 at 5.59% following the housing bubble and peaked at 3.32% in August 2020 during the pandemic.

There is much more in the article.
BLS: Job Openings Decreased to 7.6 million in December
by Calculated Risk on 2/04/2025 10:00:00 AM
From the BLS: Job Openings and Labor Turnover Summary
The number of job openings decreased to 7.6 million on the last business day of December, the U.S. Bureau of Labor Statistics reported today. Over the month, hires and total separations were little changed at 5.5 million and 5.3 million, respectively. Within separations, quits (3.2 million) and layoffs and discharges (1.8 million) changed little.The following graph shows job openings (black line), hires (dark blue), Layoff, Discharges and other (red column), and Quits (light blue column) from the JOLTS.
emphasis added
This series started in December 2000.
Note: The difference between JOLTS hires and separations is similar to the CES (payroll survey) net jobs headline numbers. This report is for December; the employment report this Friday will be for January.
 Click on graph for larger image.
Note that hires (dark blue) and total separations (red and light blue columns stacked) are usually pretty close each month. This is a measure of labor market turnover. When the blue line is above the two stacked columns, the economy is adding net jobs - when it is below the columns, the economy is losing jobs.
The spike in layoffs and discharges in March 2020 is labeled, but off the chart to better show the usual data.
Jobs openings decreased in December to 7.60 million from 8.12 million in November.
The number of job openings (black) were down 15% year-over-year.
Quits were down 7% year-over-year. These are voluntary separations. (See light blue columns at bottom of graph for trend for "quits").
Monday, February 03, 2025
Tuesday: Job Openings
by Calculated Risk on 2/03/2025 08:31:00 PM
 From Matthew Graham at Mortgage News Daily: Mortgage Rates Stay Flat Despite Underlying Market Volatility
We know that mortgage rates are driven by financial markets and we know that financial markets have experienced volatility amid the roll-out of new tariffs over the weekend. But rates are starting the current week right in line with Friday's latest levels (themselves, little-changed from any other day last week). [30 year fixed 7.05%]Tuesday:
emphasis added
• At 10:00 AM ET, Job Openings and Labor Turnover Survey for December from the BLS.
Vehicles Sales Decrease to 15.60 million SAAR in January
by Calculated Risk on 2/03/2025 05:00:00 PM
Wards Auto released their estimate of light vehicle sales for January: U.S. Light-Vehicle Sales Start 2025 With 4% Increase in January (pay site).
There did not appear to be an end-of-month boost in demand, either as a rebound from the mid-month weather-related losses or pull-ahead volume in case of still-possible future tariff-related price increases. However, January’s gain marked the fourth straight year-over-year increase in volume and fifth consecutive for the seasonally adjusted annual rate.
 Click on graph for larger image.
This graph shows light vehicle sales since 2006 from the BEA (blue) and Wards' estimate for January (red).
Sales in January (15.60 million SAAR) were down 7.1% from December, and up 3.8% from January 2024.
Sales in January were at the consensus forecast.
Sales in January were at the consensus forecast.
The second graph shows light vehicle sales since the BEA started keeping data in 1967.

This was the best January since 2021.

Fed January SLOOS Survey: Banks reported Weaker Demand for Residential Real Estate
by Calculated Risk on 2/03/2025 02:00:00 PM
From the Federal Reserve: The January 2025 Senior Loan Officer Opinion Survey on Bank Lending Practices
The January 2025 Senior Loan Officer Opinion Survey on Bank Lending Practices (SLOOS) addressed changes in the standards and terms on, and demand for, bank loans to businesses and households over the past three months, which generally correspond to the fourth quarter of 2024.
Regarding loans to businesses over the fourth quarter, survey respondents reported, on balance, tighter lending standards for commercial and industrial (C&I) loans to firms of all sizes. Meanwhile, banks reported stronger demand for C&I loans to large and middle-market firms, while demand for C&I loans to small firms remained basically unchanged. Furthermore, banks generally reported tighter standards and basically unchanged demand for commercial real estate (CRE) loans.
For loans to households, banks reported, on balance, basically unchanged lending standards and weaker demand across most categories of residential real estate (RRE) loans. In addition, standards reportedly tightened for credit card loans and remained basically unchanged for auto and other consumer loans, while demand weakened for credit card and other consumer loans but remained basically unchanged for auto loans. Further, banks reported basically unchanged lending standards and demand for home equity lines of credit (HELOCs).
The January SLOOS included a set of special questions inquiring about banks’ expectations for changes in lending standards, borrower demand, and loan performance over 2025. Banks reported expecting lending standards to either ease or remain basically unchanged and demand to strengthen across all loan categories. In addition, banks generally reported expecting loan quality to improve for loans to businesses but to either deteriorate or remain basically unchanged for most consumer loan types.
emphasis added
 Click on graph for larger image.
This graph on Residential Real Estate demand is from the Senior Loan Officer Survey Charts.
This graph is for demand and shows that demand has been weak since late 2021.
The left graph is from 1990 to 2014. The right graph is from 2015 to Q4 2024.
ICE Mortgage Monitor: “Lowest calendar year home price growth of any year since 2011”
by Calculated Risk on 2/03/2025 11:49:00 AM
Today, in the Real Estate Newsletter: ICE Mortgage Monitor: “Lowest calendar year home price growth of any year since 2011”
Brief excerpt:
Here is the year-over-year in house prices according to the ICE Home Price Index (HPI). The ICE HPI is a repeat sales index. ICE reports the median price change of the repeat sales. The index was up 3.4% year-over-year in December.There is much more in the newsletter.
Source: ICE Home Price Index (HPI)
• Annual home price growth edged slightly higher in December, closing out the year at +3.4%There is much more in the mortgage monitor including an extensive analysis of the financial impact of the California wildfires.
• That marks the lowest calendar year home price growth of any year since 2011 when the housing market was nearing its trough following the Great Financial Crisis
• In fact, 2024’s growth was a full percentage point below the +4.4% growth seen in both 2014 and 2018, which were previously the lowest growth years in the past decade
• The modest uptick in December’s annual home price growth rate was a result of softer price gains in late 2023 rolling out of the backward-looking 12-month window, rather than a strengthening of prices in December
• On a seasonally adjusted basis, prices rose by 0.2% in the month, roughly equivalent November, and slightly below October, following the brief dip in 30-year rates to near 6% in the lead-up to the Fed’s 50 bps rate cut in September
• If current seasonally adjusted monthly gains persist, the annual home price growth rate is poised to begin cooling again in the early months of 2025

Construction Spending Increased 0.5% in December
by Calculated Risk on 2/03/2025 10:17:00 AM
From the Census Bureau reported that overall construction spending increased:
Construction spending during December 2024 was estimated at a seasonally adjusted annual rate of $2,192.2 billion, 0.5 percent above the revised November estimate of $2,180.3 billion. The December figure is 4.3 percent above the December 2023 estimate of $2,101.3 billion.Private spending increased and public spending decreased:
The value of construction in 2024 was $2,154.4 billion, 6.5 percent above the $2,023.7 billion spent in 2023.
emphasis added
Spending on private construction was at a seasonally adjusted annual rate of $1,688.5 billion, 0.9 percent above the revised November estimate of $1,674.1 billion. ...
In December, the estimated seasonally adjusted annual rate of public construction spending was $503.6 billion, 0.5 percent below the revised November estimate of $506.2 billion.
 Click on graph for larger image.
This graph shows private residential and nonresidential construction spending, and public spending, since 1993. Note: nominal dollars, not inflation adjusted.
Private residential (red) spending is 4.2% below the peak in 2022.
Private non-residential (blue) spending is at a new peak.
Public construction spending is 0.6% below the peak in October 2024.
 The second graph shows the year-over-year change in construction spending.
On a year-over-year basis, private residential construction spending is up 6.0%. Private non-residential spending is up 2.3% year-over-year. Public spending is up 4.3% year-over-year.
This was above consensus expectations and spending for the previous two months was revised up.
ISM® Manufacturing index Increased to 50.9% in January
by Calculated Risk on 2/03/2025 10:00:00 AM
(Posted with permission). The ISM manufacturing index indicated expansion. The PMI® was at 50.9% in January, up from 49.2% in December. The employment index was at 50.3%, up from 45.4% the previous month, and the new orders index was at 55.1%, up from 52.1%.
From ISM: Manufacturing PMI® at 50.9% January 2025 Manufacturing ISM® Report On Business®
Economic activity in the manufacturing sector expanded in January after 26 consecutive months of contraction, say the nation's supply executives in the latest Manufacturing ISM® Report On Business®.This suggests manufacturing expanded in January. This was above the consensus forecast.
The report was issued today by Timothy R. Fiore, CPSM, C.P.M., Chair of the Institute for Supply Management® (ISM®) Manufacturing Business Survey Committee:
“The Manufacturing PMI® registered 50.9 percent in January, 1.7 percentage points higher compared to the seasonally adjusted 49.2 percent recorded in December. The overall economy continued in expansion for the 57th month after one month of contraction in April 2020. (A Manufacturing PMI® above 42.3 percent, over a period of time, generally indicates an expansion of the overall economy.) The New Orders Index was in expansion territory for the third month after seven months of contraction, strengthening again to a reading of 55.1 percent, 3 percentage points higher than the seasonally adjusted 52.1 percent recorded in December. The January reading of the Production Index (52.5 percent) is 2.6 percentage points higher than December’s seasonally adjusted figure of 49.9 percent. The index returned to expansion after eight months in contraction. The Prices Index continued in expansion (or ‘increasing’) territory, registering 54.9 percent, up 2.4 percentage points compared to the reading of 52.5 percent in December. The Backlog of Orders Index registered 44.9 percent, down 1 percentage point compared to the 45.9 percent recorded in December. The Employment Index registered 50.3 percent, up 4.9 percentage points from December’s seasonally adjusted figure of 45.4 percent.
emphasis added
Housing Feb 3rd Weekly Update: Inventory Down 0.3% Week-over-week, Up 27.7% Year-over-year
by Calculated Risk on 2/03/2025 08:11:00 AM
Altos reports that active single-family inventory was down 0.3% week-over-week.
Inventory always declines seasonally in the Winter and usually bottoms in late January or February. Inventory is now up 1.7% from the bottom three weeks ago. If three weeks ago was the seasonal bottom, that would be very early in the year, but that has happened before.
The first graph shows the seasonal pattern for active single-family inventory since 2015.
 Click on graph for larger image.
The red line is for 2024. The black line is for 2019.
Inventory was up 27.7% compared to the same week in 2024 (last week it was up 26.5%), and down 22.2% compared to the same week in 2019 (last week it was down 23.0%).
Back in June 2023, inventory was down almost 54% compared to 2019, so the gap to more normal inventory levels has closed significantly!
 This second inventory graph is courtesy of Altos Research.
As of Jan 31st, inventory was at 635 thousand (7-day average), compared to 637 thousand the prior week.
Mike Simonsen discusses this data regularly on Youtube
Sunday, February 02, 2025
Monday: ISM Manufacturing, Construction Spending, Vehicle Sales
by Calculated Risk on 2/02/2025 07:23:00 PM
Weekend:
• Schedule for Week of February 2, 2025
Monday:
• At 10:00 AM ET, ISM Manufacturing Index for January. The consensus is for the ISM to be at 49.5, up from 49.3 in December.
• Also at 10:00 AM, Construction Spending for December. The consensus is for a 0.1% increase in construction spending.
• All day, Light vehicle sales for January. Sales were at 16.8 million in December (Seasonally Adjusted Annual Rate). Wards expects vehicle sales to decrease to 15.6 million SAAR in January.
• At 2:00 PM, Senior Loan Officer Opinion Survey on Bank Lending Practices (SLOOS).
From CNBC: Pre-Market Data and Bloomberg futures S&P 500 are down 95 and DOW futures are down 470 (fair value).
Oil prices were down over the last week with WTI futures at $74.05 per barrel and Brent at $76.39 per barrel. A year ago, WTI was at $72, and Brent was at $80 - so WTI oil prices are up about 3% year-over-year.
Here is a graph from Gasbuddy.com for nationwide gasoline prices. Nationally prices are at $3.05 per gallon. A year ago, prices were at $3.15 per gallon, so gasoline prices are down $0.10 year-over-year.
Hotels: Occupancy Rate Decreased 3.4% Year-over-year
by Calculated Risk on 2/02/2025 08:25:00 AM
As expected with the MLK Day holiday, the U.S. hotel industry reported mixed year-over-year comparisons, according to CoStar’s latest data through 25 January. ...The following graph shows the seasonal pattern for the hotel occupancy rate using the four-week average.
119-25 January 2025 (percentage change from comparable week in 2024):
• Occupancy: 54.3% (-3.4%)
• Average daily rate (ADR): US$154.21 (+3.4%)
• Revenue per available room (RevPAR): US$83.74 (-0.2%)
emphasis added
 Click on graph for larger image.
The red line is for 2025, blue is the median, and dashed light blue is for 2024. Dashed purple is for 2018, the record year for hotel occupancy.
The 4-week average of the occupancy rate is tracking both last year and the median rate for the period 2000 through 2024 (Blue).
Note: Y-axis doesn't start at zero to better show the seasonal change.
This is the weakest period of the year for hotel occupancy and the 4-week average will increase seasonally for the next few months.
Saturday, February 01, 2025
Update: Lumber Prices Up 6% YoY
by Calculated Risk on 2/01/2025 05:15:00 PM
This might be something to watch again. Here is another monthly update on lumber prices.
SPECIAL NOTE: The CME group discontinued the Random Length Lumber Futures contract on May 16, 2023. I switched to a physically-delivered Lumber Futures contract that was started in August 2022. Unfortunately, this impacts long term price comparisons since the new contract was priced about 24% higher than the old random length contract for the period when both contracts were available.
This graph shows CME random length framing futures through August 2022 (blue), and the new physically-delivered Lumber Futures (LBR) contract starting in August 2022 (Red).
On January 31, 2025, LBR was at $592.50 per 1000 board feet, up 6.4% from a year ago.
 Click on graph for larger image.
There is somewhat of a seasonal demand for lumber, and lumber prices frequently peak in the first half of the year.
We didn't see a significant runup in the Spring period of 2023 or 2024 due to the housing slowdown.
But we might see an increase due to the tariffs on Canada.
Real Estate Newsletter Articles this Week: New Home Sales Increase to 698,000 Annual Rate in December
by Calculated Risk on 2/01/2025 02:11:00 PM
At the Calculated Risk Real Estate Newsletter this week:
 Click on graph for larger image.
• New Home Sales Increase to 698,000 Annual Rate in December
• Case-Shiller: National House Price Index Up 3.8% year-over-year in November
• Inflation Adjusted House Prices 1.1% Below 2022 Peak
• Freddie Mac House Price Index Increased in December; Up 4.0% Year-over-year
• Final Look at Local Housing Markets in December and a Look Ahead to January Sales
This is usually published 4 to 6 times a week and provides more in-depth analysis of the housing market.
Schedule for Week of February 2, 2025
by Calculated Risk on 2/01/2025 08:11:00 AM
The key reports scheduled for this week are the January employment report and the December trade deficit.
Other key indicators include the January ISM manufacturing index and January vehicle sales.
10:00 AM: ISM Manufacturing Index for January. The consensus is for the ISM to be at 49.5, up from 49.3 in December.
10:00 AM: Construction Spending for December. The consensus is for a 0.1% increase in construction spending.
 All day: Light vehicle sales for January. Sales were at 16.8 million in December (Seasonally Adjusted Annual Rate).
This graph shows light vehicle sales since the BEA started keeping data in 1967. The dashed line is the December sales rate.
Wards expects vehicle sales to decrease to 15.6 million SAAR in January.
2:00 PM: Senior Loan Officer Opinion Survey on Bank Lending Practices (SLOOS).
----- Tuesday, February 4th -----
 10:00 AM ET: Job Openings and Labor Turnover Survey for December from the BLS.
This graph shows job openings (black line), hires (purple), Layoff, Discharges and other (red column), and Quits (light blue column) from the JOLTS.
Jobs openings increased in November to 8.10 million from 7.84 million in October.
The number of job openings (black) were down 9% year-over-year. Quits were down 13% year-over-year.
----- Wednesday, February 5th -----
7:00 AM ET: The Mortgage Bankers Association (MBA) will release the mortgage purchase applications index.
8:15 AM: The ADP Employment Report for January. This report is for private payrolls only (no government). The consensus is for 150,000 payroll jobs added in January, up from 122,000 added in December.
 8:30 AM: Trade Balance report for December from the Census Bureau.
This graph shows the U.S. trade deficit, with and without petroleum, through the most recent report. The blue line is the total deficit, and the black line is the petroleum deficit, and the red line is the trade deficit ex-petroleum products.
The consensus is the trade deficit to be $87.0 billion. The U.S. trade deficit was at $78.2 billion in November.
10:00 AM: ISM Services Index for January.
----- Thursday, February 6th -----
8:30 AM: The initial weekly unemployment claims report will be released. The consensus is for a increase to 214 thousand from 207 thousand last week.
----- Friday, February 7th -----
 8:30 AM: Employment Report for December. The consensus is for 170,000 jobs added, and for the unemployment rate to be unchanged at 4.1%.
There were 256,000 jobs added in December, and the unemployment rate was at 4.1%.
This graph shows the jobs added per month since January 2021.
NOTE: For the household survey, new population controls will be used - and this will boost overall household employment. For the establishment survey, the annual benchmark revision will be included, lowering past job growth.
10:00 AM: University of Michigan's Consumer sentiment index (Preliminary for January).
2:00 PM: Senior Loan Officer Opinion Survey on Bank Lending Practices (SLOOS).
 10:00 AM ET: Job Openings and Labor Turnover Survey for December from the BLS.
 This graph shows job openings (black line), hires (purple), Layoff, Discharges and other (red column), and Quits (light blue column) from the JOLTS.
Jobs openings increased in November to 8.10 million from 7.84 million in October.
The number of job openings (black) were down 9% year-over-year. Quits were down 13% year-over-year.
7:00 AM ET: The Mortgage Bankers Association (MBA) will release the mortgage purchase applications index.
8:15 AM: The ADP Employment Report for January. This report is for private payrolls only (no government). The consensus is for 150,000 payroll jobs added in January, up from 122,000 added in December.
 8:30 AM: Trade Balance report for December from the Census Bureau.
 This graph shows the U.S. trade deficit, with and without petroleum, through the most recent report. The blue line is the total deficit, and the black line is the petroleum deficit, and the red line is the trade deficit ex-petroleum products.
The consensus is the trade deficit to be $87.0 billion. The U.S. trade deficit was at $78.2 billion in November.
10:00 AM: ISM Services Index for January.
8:30 AM: The initial weekly unemployment claims report will be released. The consensus is for a increase to 214 thousand from 207 thousand last week.
 8:30 AM: Employment Report for December. The consensus is for 170,000 jobs added, and for the unemployment rate to be unchanged at 4.1%.
There were 256,000 jobs added in December, and the unemployment rate was at 4.1%.
This graph shows the jobs added per month since January 2021.
NOTE: For the household survey, new population controls will be used - and this will boost overall household employment. For the establishment survey, the annual benchmark revision will be included, lowering past job growth.
10:00 AM: University of Michigan's Consumer sentiment index (Preliminary for January).
Friday, January 31, 2025
January 31st COVID Update: COVID in Wastewater Increasing
by Calculated Risk on 1/31/2025 07:38:00 PM
 Note: Mortgage rates are from MortgageNewsDaily.com and are for top tier scenarios.
For deaths, I'm currently using 4 weeks ago for "now", since the most recent three weeks will be revised significantly.
Note: "Effective May 1, 2024, hospitals are no longer required to report COVID-19 hospital admissions, hospital capacity, or hospital occupancy data." So I'm no longer tracking hospitalizations.
| COVID Metrics | ||||
|---|---|---|---|---|
| Now | Week Ago | Goal | ||
| Deaths per Week🚩 | 773 | 628 | ≤3501 | |
| 1my goals to stop weekly posts. 🚩 Increasing number weekly for Deaths. ✅ Goal met. | ||||
 Click on graph for larger image.
This graph shows the weekly (columns) number of deaths reported since Jan 2023.
Although weekly deaths met the original goal to stop posting, I'm continuing to post now that deaths are above the goal again - and at a minimum, I'll continue to post through the Winter.
Weekly deaths have been increasing, and weekly deaths are well above the low of 313 in early June 2024.
 This appears to be a leading indicator for COVID hospitalizations and deaths.
Nationally COVID in wastewater is "High" according to the CDC.
Initial Q1 GDP Tracking: Mid-to-high 2% Range
by Calculated Risk on 1/31/2025 02:09:00 PM
From Goldman:
We launched our Q1 GDP tracking estimate at +2.6% (quarter-over-quarter annualized) and our Q1 domestic final sales estimate at +2.3%. We launched our past-quarter GDP tracking estimate at +2.3%, in line with the advance reading. [Jan 31st estimate]And from the Atlanta Fed: GDPNow
emphasis added
The initial GDPNow model estimate for real GDP growth (seasonally adjusted annual rate) in the first quarter of 2025 is 2.9 percent on January 31. The initial estimate of last quarter's real GDP growth rate released by the US Bureau of Economic Analysis on January 30 was 2.3 percent, the same as the final GDPNow model nowcast after rounding. [Jan 31st estimate]
Freddie Mac House Price Index Increased in December; Up 4.0% Year-over-year
by Calculated Risk on 1/31/2025 10:42:00 AM
Today, in the Calculated Risk Real Estate Newsletter: Freddie Mac House Price Index Increased in December; Up 4.0% Year-over-year
A brief excerpt:
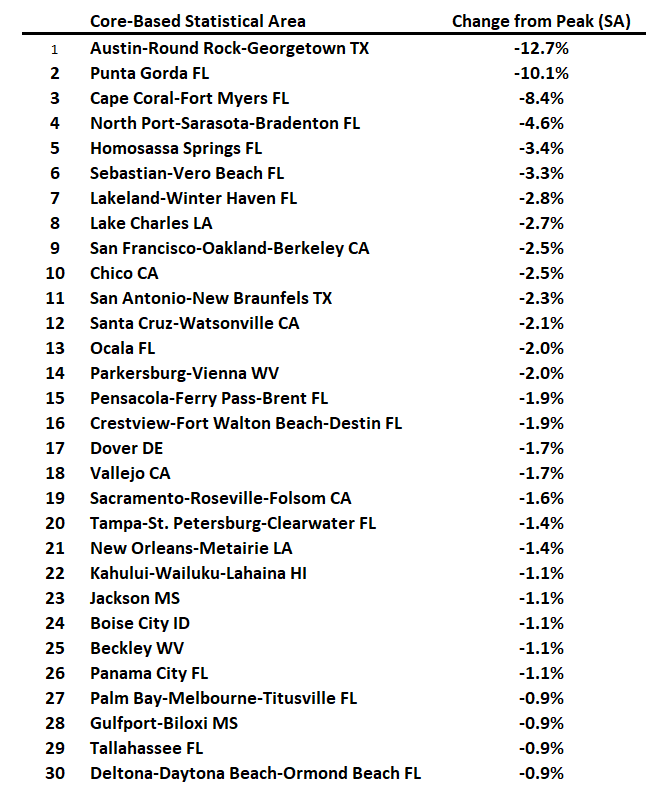
Freddie Mac reported that its “National” Home Price Index (FMHPI) increased 0.54% month-over-month on a seasonally adjusted (SA) basis in December. On a year-over-year basis, the National FMHPI was up 4.0% in December, up from up 3.9% YoY in November. The YoY increase peaked at 19.0% in July 2021, and for this cycle, bottomed at up 0.9% YoY in May 2023. ...There is much more in the article!
For cities (Core-based Statistical Areas, CBSA), here are the 30 cities with the largest declines from the peak, seasonally adjusted. Austin continues to be the worst performing city. However, 6 of the 7 cities with the largest price declines are in Florida (and Florida has 14 of the 30 cities with the largest price declines).
Personal Income increased 0.4% in December; Spending increased 0.7%
by Calculated Risk on 1/31/2025 08:30:00 AM
The BEA released the Personal Income and Outlays report for December:
Personal income increased $92.0 billion (0.4 percent at a monthly rate) in December, according to estimates released today by the U.S. Bureau of Economic Analysis. Disposable personal income (DPI)—personal income less personal current taxes—increased $79.7 billion (0.4 percent) and personal consumption expenditures (PCE) increased $133.6 billion (0.7 percent).The December PCE price index increased 2.6 percent year-over-year (YoY), up from 2.4 percent YoY in November, and down from the recent peak of 7.0 percent in June 2022.
Personal outlays—the sum of PCE, personal interest payments, and personal current transfer payments—increased $129.5 billion in December. Personal saving was $843.2 billion in December and the personal saving rate—personal saving as a percentage of disposable personal income—was 3.8 percent.
emphasis added
The PCE price index, excluding food and energy, increased 2.8 percent YoY, unchanged from 2.8 percent in November, and down from the recent peak of 5.4 percent in February 2022.
The following graph shows real Personal Consumption Expenditures (PCE) through December 2024 (2017 dollars). Note that the y-axis doesn't start at zero to better show the change.
 Click on graph for larger image.
The dashed red lines are the quarterly levels for real PCE.
Personal income was at expectations, and PCE was slightly above expectations.
Inflation was slightly above expectations.


