 RSS Feed
 by Calculated Risk on 9/28/2024 02:11:00 PM
Saturday, September 28, 2024
Real Estate Newsletter Articles this Week: Case-Shiller National HPI Up 5.0% year-over-year in July
At the Calculated Risk Real Estate Newsletter this week:
 Click on graph for larger image.
• Case-Shiller: National House Price Index Up 5.0% year-over-year in July
• New Home Sales Decrease to 716,000 Annual Rate in August
• Inflation Adjusted House Prices 1.5% Below 2022 Peak
• Fannie and Freddie: Single Family Serious Delinquency Rate Ticked Up in August
• Watch Months-of-Supply!
This is usually published 4 to 6 times a week and provides more in-depth analysis of the housing market.
Schedule for Week of September 29, 2024
by Calculated Risk on 9/28/2024 08:11:00 AM
The key report scheduled for this week is the September employment report on Friday.
Other key indicators include the September ISM Manufacturing and Services indices and September auto sales.
10:30 AM: Dallas Fed Survey of Manufacturing Activity for September.
9:45 AM: Chicago Purchasing Managers Index for September. The consensus is for a reading of 46.5, up from 46.1 in August.
1:55 PM: Speech, Fed Chair Jerome Powell, Economic Outlook, At the National Association for Business Economics (NABE) Annual Meeting, Nashville, Tenn
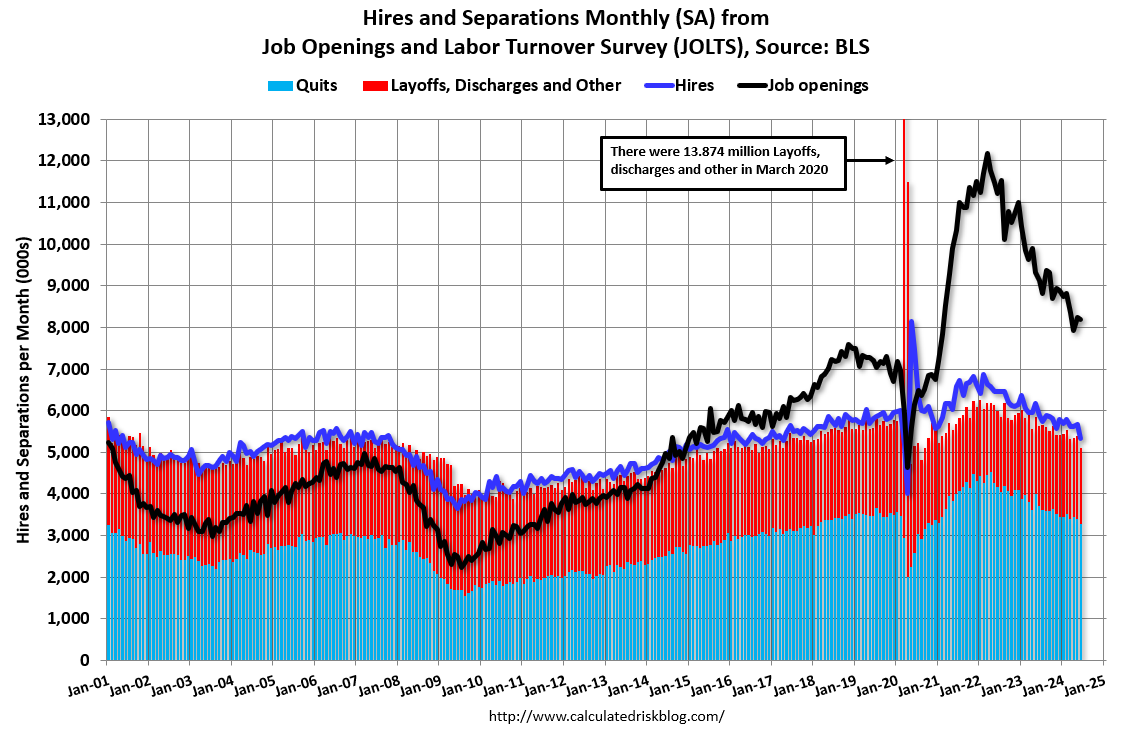 10:00 AM: Job Openings and Labor Turnover Survey for August from the BLS.
 This graph shows job openings (black line), hires (purple), Layoff, Discharges and other (red column), and Quits (light blue column) from the JOLTS.
10:00 AM: ISM Manufacturing Index for September. The consensus is for a reading of 47.6, up from 47.2 in August.
10:00 AM: Construction Spending for August. The consensus is for a 0.1% increase.
 All day: Light vehicle sales for September.
The consensus is for sales of 15.7 million SAAR, up from 15.1 million SAAR in August (Seasonally Adjusted Annual Rate).
This graph shows light vehicle sales since the BEA started keeping data in 1967. The dashed line is the current sales rate.
7:00 AM ET: The Mortgage Bankers Association (MBA) will release the results for the mortgage purchase applications index.
8:15 AM: The ADP Employment Report for September. This report is for private payrolls only (no government). The consensus is for 110,000 jobs added, up from 99,000 in August.
8:30 AM: The initial weekly unemployment claims report will be released. The consensus is for 224 thousand initial claims, up from 218 thousand last week.
10:00 AM: the ISM Services Index for September.
 8:30 AM: Employment Report for September. The consensus is for 145,000 jobs added, and for the unemployment rate to be unchanged at 4.2%.
There were 142,000 jobs added in August, and the unemployment rate was at 4.2%.
This graph shows the jobs added per month since January 2021.
Friday, September 27, 2024
September 27th COVID Update: Wastewater Measure Declining
by Calculated Risk on 9/27/2024 07:20:00 PM
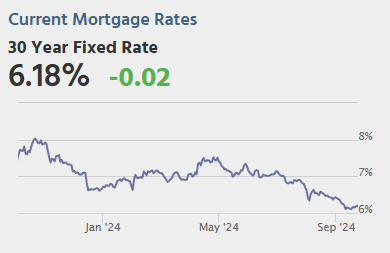
 Note: Mortgage rates are from MortgageNewsDaily.com and are for top tier scenarios.
For deaths, I'm currently using 4 weeks ago for "now", since the most recent three weeks will be revised significantly.
Note: "Effective May 1, 2024, hospitals are no longer required to report COVID-19 hospital admissions, hospital capacity, or hospital occupancy data." So I'm no longer tracking hospitalizations.
| COVID Metrics | ||||
|---|---|---|---|---|
| Now | Week Ago | Goal | ||
| Deaths per Week🚩 | 1,239 | 1,176 | ≤3501 | |
| 1my goals to stop weekly posts, 🚩 Increasing number weekly for Deaths ✅ Goal met. | ||||
 Click on graph for larger image.
This graph shows the weekly (columns) number of deaths reported.
Although weekly deaths met the original goal to stop posting, I'm going to continue to post now that deaths are above the goal again.
Weekly deaths are quadruple the low of 302 in early June.
 This appears to be a leading indicator for COVID hospitalizations and deaths.
COVID in wastewater is now declining suggesting weekly deaths will start declining soon.
Fannie and Freddie: Single Family Serious Delinquency Rate Ticked Up in August
by Calculated Risk on 9/27/2024 05:32:00 PM
Today, in the Calculated Risk Real Estate Newsletter: Fannie and Freddie: Single Family Serious Delinquency Rate Ticked Up in August
Brief excerpt:
Single-family serious delinquencies increased slightly in August, and multi-family serious delinquencies decreased slightly.
...
Freddie Mac reports that the multi-family delinquencies rate decreased to 0.38% in August, down from 0.39% in July, and down from the recent peak of 0.44% in January.
This graph shows the Freddie multi-family serious delinquency rate since 2012. Rates were still high in 2012 following the housing bust and financial crisis.
The multi-family rate increased following the pandemic and has increased recently as rent growth slowed, vacancy rates increased and borrowing costs increased sharply. The rate surged higher in January and has moved mostly sideways at an elevated level since then.

There is much more in the article.
ICE: "Home prices continued to cool in August, with prices up +3.0%" YoY
by Calculated Risk on 9/27/2024 11:46:00 AM
Note: This is a repeat sales index (like Case-Shiller and FHFA). ICE is releasing this index early this month.
Several cities in Florida are now seeing year-over-year price declines (as inventory surges).
From ICE:
From ICE:
• Home prices continued to cool in August, with prices up +3.0% from the same time last year according to the ICE Home Price Index, marking the slowest rate of home price growth in over a year
• On an adjusted basis prices rose by +0.12% in the month – the slowest adjusted monthly growth since last November – equivalent to a seasonally adjusted annualized rate (SAAR) of +1.4%
• While those soft monthly gains suggest that the annual home price growth rate may slow further in September, the market may be poised to catch a two different tail winds in coming months
• The first will come from softer comparable sales from late 2023 when mortgage rates had climbed above 7.5%, with the second coming from easing 30-year rates and improved affordability in September
• August home price gains were driven by mortgage rates in the high 6% range in July, before they trended sharply lower through August and September
• September home prices were driven by rates in the mid-6% range, while October prices will be driven by 30-year rates that have been in the low 6% range
• It will be worth watching the housing supply/demand and price dynamics closely in coming months given the sharp downward trend in mortgage rates in recent weeks Price growth slowed across two-thirds of the nation’s largest markets in August
• The strongest cooling was seen in the Midwest and Northeast – areas of the country that, while slightly cooler than recent months, continue to see the strongest home price growth nationwide
• On the other end of the spectrum, 1 in 4 of the nation’s largest markets saw prices edge lower on a seasonally adjusted basis, led by North Port, Cape Coral, Austin TX, Memphis, Tucson, and Atlanta
• A dozen major markets are now seeing home prices below last year’s levels, including Cape Coral and North Port where prices are down 6.4% and 5.7%, respectively, from this same time last year
• Of the 12 markets where prices have fallen over the past 12 months, 7 are in the state of Florida along with San Francisco, Austin, San Antonio, Memphis, and New Orleans
emphasis added
Q3 GDP Tracking: Around 3%
by Calculated Risk on 9/27/2024 10:50:00 AM
From BofA:
Since our last weekly publication, our 3Q GDP tracking estimate is down two-tenths to 2.3% q/q saar while 2Q GDP came in at 3.0% q/q saar in the final official estimate. [Sept 27th estimate]From Goldman:
emphasis added
The details of yesterday’s durable goods report and this morning’s Advance Economic Indicators report were stronger than our previous GDP tracking assumptions, while the details of the PCE report were slightly softer. On net, we boosted our Q3 GDP tracking estimate by 0.2pp to +3.2% (quarter-over-quarter annualized). Our Q3 domestic final sales estimate stands at +2.8%. [Sept 27th estimate]And from the Atlanta Fed: GDPNow
The GDPNow model estimate for real GDP growth (seasonally adjusted annual rate) in the third quarter of 2024 is 3.1 percent on September 27, up from 2.9 percent on September 18. After recent releases from the US Census Bureau, the US Bureau of Economic Analysis, and the National Association of Realtors, a decline in the nowcast of real personal consumption expenditures growth was more than offset by increases in the nowcasts of real gross private domestic investment growth and the contribution of net exports to third-quarter real GDP growth. [Sept 27th estimate]
PCE Measure of Shelter Increases to 5.3% YoY in August
by Calculated Risk on 9/27/2024 09:15:00 AM
Here is a graph of the year-over-year change in shelter from the CPI report and housing from the PCE report this morning, both through August 2024.
 CPI Shelter was up 5.2% year-over-year in August, up from 5.0 in July, and down from the cycle peak of 8.2% in March 2023.
Housing (PCE) was up 5.3% YoY in August, up from 5.2% in July, and down from the cycle peak of 8.3% in April 2023.
Since asking rents are mostly flat year-over-year, these measures will slowly continue to decline over the next year.
Since asking rents are mostly flat year-over-year, these measures will slowly continue to decline over the next year.
 The second graph shows PCE prices, Core PCE prices and Core ex-housing over the last 3 months (annualized):
Key measures are slightly below the Fed's target on a 3-month basis. Note: There appears to be some residual seasonality distorting PCE prices in Q1, especially in January.
3-month annualized change:
PCE Price Index: 1.5%
Core PCE Prices: 2.1%
Core minus Housing: 1.5%
Core PCE Prices: 2.1%
Core minus Housing: 1.5%
Personal Income increased 0.2% in August; Spending increased 0.2%
by Calculated Risk on 9/27/2024 08:30:00 AM
The BEA released the Personal Income and Outlays report for August:
Personal income increased $50.5 billion (0.2 percent at a monthly rate) in August, according to estimates released today by the U.S. Bureau of Economic Analysis. Disposable personal income (DPI), personal income less personal current taxes, increased $34.2 billion (0.2 percent) and personal consumption expenditures (PCE) increased $47.2 billion (0.2 percent).The August PCE price index increased 2.2 percent year-over-year (YoY), down from 2.5 percent YoY in July, and down from the recent peak of 7.2 percent in June 2022.
The PCE price index increased 0.1 percent. Excluding food and energy, the PCE price index increased 0.1 percent. Real DPI increased 0.1 percent in August and real PCE increased 0.1 percent; goods increased less than 0.1 percent and services increased 0.2 percent.
emphasis added
The PCE price index, excluding food and energy, increased 2.7 percent YoY, up from 2.6 percent in July, and down from the recent peak of 5.6 percent in February 2022.
The following graph shows real Personal Consumption Expenditures (PCE) through August 2024 (2017 dollars). Note that the y-axis doesn't start at zero to better show the change.
 Click on graph for larger image.
The dashed red lines are the quarterly levels for real PCE.
Personal income was above expectations, and PCE was below expectations.
Inflation was below expectations.
Using the two-month method to estimate Q3 real PCE growth, real PCE was increasing at a 3.3% annual rate in Q3 2024. (Using the mid-month method, real PCE was increasing at 2.6%). This suggests solid PCE growth in Q3.
Thursday, September 26, 2024
Friday: Personal Income & Outlays
by Calculated Risk on 9/26/2024 08:21:00 PM
 Note: Mortgage rates are from MortgageNewsDaily.com and are for top tier scenarios.
Thursday:
• At 8:30 AM ET Personal Income and Outlays, August 2024. The consensus is for a 0.4% increase in personal income, and for a 0.3% increase in personal spending. And for the Core PCE price index to increase 0.2%.
• At 10:00 AM, University of Michigan's Consumer sentiment index (Final for September). The consensus is for a reading of 67.7.
September Vehicle Sales Forecast: 16.1 million SAAR, Up 2% YoY
by Calculated Risk on 9/26/2024 04:19:00 PM
From WardsAuto: September U.S. Light-Vehicle Sales Forecast for 9-Month-High SAAR Despite Drop in Volume (pay content). Brief excerpt:
If September’s outlook holds true, Q3 sales will decline 1.8% year-over-year. However, deliveries in October-December, goosed by two additional selling days vs. the year-ago period, are forecast to rise 7.4% from like-2023, leaving volume for entire-2024 at 15.9 million, up from 2023’s 15.5 million.
emphasis added
 Click on graph for larger image.
This graph shows actual sales from the BEA (Blue), and Wards forecast for September (Red).
On a seasonally adjusted annual rate basis, the Wards forecast of 16.1 million SAAR, would be up 6.4% from last month, and up 2.1% from a year ago.
Inflation Adjusted House Prices 1.5% Below 2022 Peak; Price-to-rent index is 7.8% below 2022 peak
by Calculated Risk on 9/26/2024 12:26:00 PM
Today, in the Calculated Risk Real Estate Newsletter: Inflation Adjusted House Prices 1.5% Below 2022 Peak
Excerpt:
It has been over 18 years since the bubble peak. In the July Case-Shiller house price index on Tuesday, the seasonally adjusted National Index (SA), was reported as being 74% above the bubble peak in 2006. However, in real terms, the National index (SA) is about 11% above the bubble peak (and historically there has been an upward slope to real house prices). The composite 20, in real terms, is 2% above the bubble peak.
People usually graph nominal house prices, but it is also important to look at prices in real terms. As an example, if a house price was $300,000 in January 2010, the price would be $432,000 today adjusted for inflation (44% increase). That is why the second graph below is important - this shows "real" prices.
The third graph shows the price-to-rent ratio, and the fourth graph is the affordability index. The last graph shows the 5-year real return based on the Case-Shiller National Index.
...
The second graph shows the same two indexes in real terms (adjusted for inflation using CPI).
In real terms (using CPI), the National index is 1.5% below the recent peak, and the Composite 20 index is 1.8% below the recent peak in 2022. Both indexes increased in July in real terms.
It has now been 26 months since the real peak in house prices. Typically, after a sharp increase in prices, it takes a number of years for real prices to reach new highs (see House Prices: 7 Years in Purgatory)

NAR: Pending Home Sales Increase 0.6% in August; Down 3.0% Year-over-year
by Calculated Risk on 9/26/2024 10:00:00 AM
From the NAR: Pending Home Sales Edged Up 0.6% in August
Pending home sales in August rose 0.6%, according to the National Association of REALTORS®. The Midwest, South and West posted monthly gains in transactions, while the Northeast recorded a loss. Year-over-year, the West registered growth, but the Northeast, Midwest and South declined.This was well below expectations. Note: Contract signings usually lead sales by about 45 to 60 days, so this would usually be for closed sales in September and October.
The Pending Home Sales Index (PHSI)* – a forward-looking indicator of home sales based on contract signings – increased to 70.6 in August. Year over year, pending transactions were down 3.0%. An index of 100 is equal to the level of contract activity in 2001.
“A slight upward turn reflects a modest improvement in housing affordability, primarily because mortgage rates descended to 6.5% in August,” said NAR Chief Economist Lawrence Yun. “However, contract signings remain near cyclical lows even as home prices keep marching to new record highs.”
...
The Northeast PHSI diminished 4.6% from last month to 61.6, a drop of 2.2% from August 2023. The Midwest index intensified 3.2% to 70.0 in August, down 3.6% from one year ago.
The South PHSI grew 0.1% to 83.6 in August, receding 5.3% from the prior year. The West index increased 3.2% in August to 58.0, up 2.7% from August 2023.
emphasis added
Weekly Initial Unemployment Claims Decrease to 218,000
by Calculated Risk on 9/26/2024 08:39:00 AM
The DOL reported:
In the week ending September 21, the advance figure for seasonally adjusted initial claims was 218,000, a decrease of 4,000 from the previous week's revised level. The previous week's level was revised up by 3,000 from 219,000 to 222,000. The 4-week moving average was 224,750, a decrease of 3,500 from the previous week's revised average. The previous week's average was revised up by 750 from 227,500 to 228,250.The following graph shows the 4-week moving average of weekly claims since 1971.
emphasis added
 Click on graph for larger image.
The dashed line on the graph is the current 4-week average. The four-week average of weekly unemployment claims decreased to 224,750.
The previous week was revised up.
Weekly claims were below the consensus forecast.
Q2 GDP Growth Unrevised at 3.0% Annual Rate
by Calculated Risk on 9/26/2024 08:30:00 AM
Real gross domestic product (GDP) increased at an annual rate of 3.0 percent in the second quarter of 2024, according to the "third" estimate released by the U.S. Bureau of Economic Analysis. In the first quarter, real GDP increased 1.6 percent (revised).Here is a Comparison of Third and Second Estimates. PCE growth was revised down from 2.9% to 2.8%. Residential investment was revised down from -2.0% to -2.8%.
The GDP estimate released today is based on more complete source data than were available for the "second" estimate issued last month. In the second estimate, the increase in real GDP was also 3.0 percent. The update primarily reflected upward revisions to private inventory investment and federal government spending that were offset by downward revisions to nonresidential fixed investment and exports. Imports, which are a subtraction in the calculation of GDP, were revised up.
emphasis added
Wednesday, September 25, 2024
Thursday: GDP, Unemployment Claims, Durable Goods, Fed Chair Powell, Pending Home Sales
by Calculated Risk on 9/25/2024 07:13:00 PM
 Note: Mortgage rates are from MortgageNewsDaily.com and are for top tier scenarios.
Thursday:
• At 8:30 AM ET, The initial weekly unemployment claims report will be released. The consensus is for 226 thousand initial claims, up from 219 thousand last week.
• Also at 8:30 AM, Gross Domestic Product, 2nd Quarter 2024 (Third Estimate), and Corporate Profits (Revised) The consensus is that real GDP increased 3.0% annualized in Q2, unchanged from the second estimate of 3.0%.
• Also at 8:30 AM, Durable Goods Orders for August from the Census Bureau. The consensus is for a 2.8% decrease in durable goods orders.
• At 9:20 AM, Speech, Fed Chair Jerome Powell, Opening Remarks (via pre-recorded video), At the 2024 U.S. Treasury Market Conference, Federal Reserve Bank of New York, New York, N.Y.
• At 10:00 AM, Pending Home Sales Index for August. The consensus is 3.1% increase in the index.
• At 11:00 AM, the Kansas City Fed manufacturing survey for September.
ICE: Mortgage Delinquency Rate Decreased in August
by Calculated Risk on 9/25/2024 02:21:00 PM
• The national delinquency rate fell 3 basis points (bps) to 3.34% in August, dropping 0.9% for the month but up 5.1% from last year
• The number of borrowers a single payment past due dropped by -26K, while 60-day delinquencies rose marginally by 1K
• Serious delinquencies (loans 90+ days past due but not in active foreclosure) rose 14K (+3.3%) to a six-month high, but remain historically low
• Foreclosure starts fell by 9% from the month prior and remain 32% below their 2019 levels
• Active foreclosure inventory also improved in the month, with the share of mortgages in foreclosure hitting the second-lowest level on record outside of the COVID-19 moratorium
• 5.6K foreclosure sales were completed nationally in August – a +2.6% month-over-month increase, yet down -18.1% from last year and 58% below 2019 levels Prepayment activity (SMM) rose to 0.62% – a level not seen in two years (August 2022) – on easing rates, rising by 4.7% from July and 18.0% from last year
emphasis added
 Click on graph for larger image.
Here is a table from ICE.
New Home Sales Decrease to 716,000 Annual Rate in August; Median New Home Price is Down 9% from the Peak
by Calculated Risk on 9/25/2024 11:02:00 AM
Today, in the Calculated Risk Real Estate Newsletter: New Home Sales Decrease to 716,000 Annual Rate in August
Brief excerpt:
The Census Bureau reported New Home Sales in August were at a seasonally adjusted annual rate (SAAR) of 716 thousand. The previous three months were revised up.There is much more in the article.
...
The next graph shows new home sales for 2023 and 2024 by month (Seasonally Adjusted Annual Rate). Sales in August 2024 were up 9.8% from August 2023.
New home sales, seasonally adjusted, have increased year-over-year in 16 of the last 17 months.

New Home Sales Decrease to 716,000 Annual Rate in August
by Calculated Risk on 9/25/2024 10:00:00 AM
The Census Bureau reports New Home Sales in August were at a seasonally adjusted annual rate (SAAR) of 716 thousand.
The previous three months were revised up.
Sales of new single-family houses in August 2024 were at a seasonally adjusted annual rate of 716,000, according to estimates released jointly today by the U.S. Census Bureau and the Department of Housing and Urban Development. This is 4.7 percent below the revised July rate of 751,000, but is 9.8 percent above the August 2023 estimate of 652,000.
emphasis added
 Click on graph for larger image.
The first graph shows New Home Sales vs. recessions since 1963. The dashed line is the current sales rate.
New home sales were close to pre-pandemic levels.
The second graph shows New Home Months of Supply.
 The months of supply increased in August to 7.8 months from 7.3 months in July.
 The all-time record high was 12.2 months of supply in January 2009. The all-time record low was 3.3 months in August 2020.
This is well above the top of the normal range (about 4 to 6 months of supply is normal).
"The seasonally-adjusted estimate of new houses for sale at the end of August was 467,000. This represents a supply of 7.8 months at the current sales rate."Sales were above expectations of 700 thousand SAAR, and sales for the three previous months were revised up. I'll have more later today.
MBA: Mortgage Applications Increased in Weekly Survey
by Calculated Risk on 9/25/2024 07:00:00 AM
From the MBA: Mortgage Applications Increase in Latest MBA Weekly Survey
Mortgage applications increased 11.0 percent from one week earlier, according to data from the Mortgage Bankers Association’s (MBA) Weekly Applications Survey for the week ending September 20, 2024.
The Market Composite Index, a measure of mortgage loan application volume, increased 11.0 percent on a seasonally adjusted basis from one week earlier. On an unadjusted basis, the Index increased 11 percent compared with the previous week. The Refinance Index increased 20 percent from the previous week and was 175 percent higher than the same week one year ago. The seasonally adjusted Purchase Index increased 1 percent from one week earlier. The unadjusted Purchase Index increased 0.4 percent compared with the previous week and was 2 percent higher than the same week one year ago.
“Mortgage applications increased to their highest level since July 2022, boosted by a 20 percent increase in refinance applications after a large increase the prior week. The 30-year fixed rate decreased for the eighth straight week to 6.13 percent, while the FHA rate decreased to 5.99 percent, breaking the psychologically important 6 percent level,” Joel Kan, MBA’s Vice President and Deputy Chief Economist. “As a result of lower rates, week-over-week gains for both conventional and government refinance applications increased sharply. The refinance share of applications is now at 55.7 percent, and while the level of refinance activity is still modest compared to prior refi waves, they now account for the majority of applications, given the seasonal slowdown in purchase activity.”
Added Kan, “Average loan sizes were higher both for purchase and refinance applications, which pushed the overall average loan size to its highest in the survey’s history at $413,100.”
...
The average contract interest rate for 30-year fixed-rate mortgages with conforming loan balances ($766,550 or less) decreased to 6.13 percent from 6.15 percent, with points increasing to 0.57 from 0.56 (including the origination fee) for 80 percent loan-to-value ratio (LTV) loans.
emphasis added
 Click on graph for larger image.
The first graph shows the MBA mortgage purchase index.
According to the MBA, purchase activity is up 2.0% year-over-year unadjusted.
Red is a four-week average (blue is weekly).
Purchase application activity is up about 18% from the lows in late October 2023, but still about 2% below the lowest levels during the housing bust.

The second graph shows the refinance index since 1990.
With higher mortgage rates, the refinance index declined sharply in 2022 - and mostly flat lined for two years - but has increased significantly recently as mortgage rates declined.
Tuesday, September 24, 2024
Wednesday: New Home Sales
by Calculated Risk on 9/24/2024 07:21:00 PM
 Note: Mortgage rates are from MortgageNewsDaily.com and are for top tier scenarios.
Wednesday:
• At 7:00 AM ET, The Mortgage Bankers Association (MBA) will release the results for the mortgage purchase applications index.
• At 10:00 AM: New Home Sales for August from the Census Bureau. The consensus is for 700 thousand SAAR, down from 739 thousand in July.


