 RSS Feed
 by Calculated Risk on 9/14/2024 08:11:00 AM
Saturday, September 14, 2024
Schedule for Week of September 15, 2024
The key reports this week are August Retail Sales, Housing Starts and Existing Home sales.
For manufacturing, August Industrial Production, and the September New York and Philly Fed surveys will be released this week.
The FOMC meets this week and is expected to cut rates.
8:30 AM ET: The New York Fed Empire State manufacturing survey for September. The consensus is for a reading of -4.0, up from -4.7.
 8:30 AM ET: Retail sales for August will be released. The consensus is for a 0.2% increase in retail sales.
This graph shows retail sales since 1992. This is monthly retail sales and food service, seasonally adjusted (total and ex-gasoline).
 9:15 AM: The Fed will release Industrial Production and Capacity Utilization for August.
This graph shows industrial production since 1967.
The consensus is for a 0.1% increase in Industrial Production, and for Capacity Utilization to increase to 77.9%.
10:00 AM: The September NAHB homebuilder survey. The consensus is for a reading of 40, up from 39 in August. Any number below 50 indicates that more builders view sales conditions as poor than good.
7:00 AM ET: The Mortgage Bankers Association (MBA) will release the results for the mortgage purchase applications index.
 8:30 AM: Housing Starts for August.
 This graph shows single and total housing starts since 1968.
The consensus is for 1.250 million SAAR, up from 1.238 million SAAR.
During the day: The AIA's Architecture Billings Index for August (a leading indicator for commercial real estate).
2:00 PM: FOMC Meeting Announcement. The Fed is expected to cut rates 25bp at this meeting.
2:00 PM: FOMC Forecasts This will include the Federal Open Market Committee (FOMC) participants' projections of the appropriate target federal funds rate along with the quarterly economic projections.
2:30 PM: Fed Chair Jerome Powell holds a press briefing following the FOMC announcement.
8:30 AM: The initial weekly unemployment claims report will be released. The consensus is for 235 thousand initial claims, up from 230 thousand last week.
8:30 AM: the Philly Fed manufacturing survey for September. The consensus is for a reading of 2.0, up from -7.0.
 10:00 AM: Existing Home Sales for August from the National Association of Realtors (NAR). The consensus is for 3.85 million SAAR, down from 3.95 million in July.
The graph shows existing home sales from 1994 through the report last month.
10:00 AM: State Employment and Unemployment (Monthly) for August 2024
Friday, September 13, 2024
September 13th COVID Update: Wastewater Measure Still High
by Calculated Risk on 9/13/2024 07:23:00 PM
 Note: Mortgage rates are from MortgageNewsDaily.com and are for top tier scenarios.
For deaths, I'm currently using 4 weeks ago for "now", since the most recent three weeks will be revised significantly.
Note: "Effective May 1, 2024, hospitals are no longer required to report COVID-19 hospital admissions, hospital capacity, or hospital occupancy data." So I'm no longer tracking hospitalizations.
| COVID Metrics | ||||
|---|---|---|---|---|
| Now | Week Ago | Goal | ||
| Deaths per Week | 998 | 998 | ≤3501 | |
| 1my goals to stop weekly posts, 🚩 Increasing number weekly for Deaths ✅ Goal met. | ||||
 Click on graph for larger image.
This graph shows the weekly (columns) number of deaths reported.
Although weekly deaths met the original goal to stop posting, I'm going to continue to post now that deaths are above the goal again.
Weekly deaths are more than triple the low of 302 in early June.
 This appears to be a leading indicator for COVID hospitalizations and deaths.
COVID in wastewater is mostly moving sideways.
2nd Look at Local Housing Markets in August
by Calculated Risk on 9/13/2024 03:13:00 PM
Today, in the Calculated Risk Real Estate Newsletter: 2nd Look at Local Housing Markets in August
A brief excerpt:
NOTE: The tables for active listings, new listings and closed sales all include a comparison to August 2019 for each local market (some 2019 data is not available).There is much more in the article.
This is the second look at several early reporting local markets in August. I’m tracking over 40 local housing markets in the US. Some of the 40 markets are states, and some are metropolitan areas. I’ll update these tables throughout the month as additional data is released.
Closed sales in August were mostly for contracts signed in June and July when 30-year mortgage rates averaged 6.92% and 6.85%, respectively (Freddie Mac PMMS).
...
In August, sales in these markets were down 5.3% YoY. Last month, in July, these same markets were up 4.1% year-over-year Not Seasonally Adjusted (NSA).
Important: There was one fewer working day in August 2024 compared to August 2023 (22 vs 23), so seasonally adjusted sales up be up more than NSA sales. Last month, in July 2024, there were two more working days compared to July 2023 (22 vs 20), so seasonally adjusted sales were lower than the NSA data suggests.
...
This was just a several early reporting markets. Many more local markets to come!

Part 1: Current State of the Housing Market; Overview for mid-September 2024
by Calculated Risk on 9/13/2024 09:16:00 AM
Today, in the Calculated Risk Real Estate Newsletter: Part 1: Current State of the Housing Market; Overview for mid-September 2024
A brief excerpt:
This 2-part overview for mid-September provides a snapshot of the current housing market.There is much more in the article.
I always focus first on inventory, since inventory usually tells the tale!
...
Here is a graph of new listing from Realtor.com’s August 2024 Monthly Housing Market Trends Report showing new listings were down 0.9% year-over-year in August. New listings are still well below pre-pandemic levels. From Realtor.com:
Just like buyers, sellers pulled back this August as newly listed homes were 0.9% below last year’s levels and a reversal from July’s 8.4% gain. This breaks a nine-month streak of increasing listing activity. We think the sharp decrease in mortgage rates seen in mid-August could lead to an increase in listings in the coming months as lower rates begin to entice the marginal homeowner to sell.Note the seasonality for new listings. December and January are seasonally the weakest months of the year for new listings, followed by February and November. New listings will be up year-over-year in 2024, but still below normal levels.
There are always people that need to sell due to the so-called 3 D’s: Death, Divorce, and Disease. Also, in certain times, some homeowners will need to sell due to unemployment or excessive debt. Neither is much of an issue right now, except possibly in Florida with very expensive homeowner’s insurance (due to impacts from climate change), and special assessments for condo owners due to deferred maintenance.
And there are homeowners who want to sell for a number of reasons: upsizing (more babies), downsizing, moving for a new job, or moving to a nicer home or location (move-up buyers). It is some of the “want to sell” group that has been locked in with the golden handcuffs over the last couple of years, since it is financially difficult to move when your current mortgage rate is around 3%, and your new mortgage rate will around 6.15%.
But time is a factor for this “want to sell” group, and eventually some of them will take the plunge. And early data suggests new listings will be up year-over-year in September.

Q3 GDP Tracking: Mid 2% Range
by Calculated Risk on 9/13/2024 08:17:00 AM
From BofA:
Since our last weekly publication, our 3Q GDP tracking estimate remains unchanged at 2.3% q/q saar while our 2Q GDP tracking estimate went down two-tenths to 2.8% q/q saar. [Sept 13th estimate]From Goldman:
emphasis added
We lowered our Q3 GDP forecast to 2.5% (qoq ar) [Sept 10th estimate]And from the Atlanta Fed: GDPNow
The GDPNow model estimate for real GDP growth (seasonally adjusted annual rate) in the third quarter of 2024 is 2.5 percent on September 9, up from 2.1 percent on September 4. [Sept 9th estimate]
Thursday, September 12, 2024
Friday: Misc
by Calculated Risk on 9/12/2024 07:06:00 PM
 Note: Mortgage rates are from MortgageNewsDaily.com and are for top tier scenarios.
Friday:
• At 10:00 AM: University of Michigan's Consumer sentiment index (Preliminary for September).
Realtor.com Reports Active Inventory Up 33.4% YoY
by Calculated Risk on 9/12/2024 04:30:00 PM
What this means: On a weekly basis, Realtor.com reports the year-over-year change in active inventory and new listings. On a monthly basis, they report total inventory. For August, Realtor.com reported inventory was up 5.8% YoY, but still down 26.4% compared to the 2017 to 2019 same month levels.
Now - on a weekly basis - inventory is up 33.4% YoY.
Realtor.com has monthly and weekly data on the existing home market. Here is their weekly report: Weekly Housing Trends View—Data for Week Ending Sept. 7, 2024 Here is a graph of the year-over-year change in inventory according to realtor.com.
Inventory was up year-over-year for the 44th consecutive week.
Realtor.com has monthly and weekly data on the existing home market. Here is their weekly report: Weekly Housing Trends View—Data for Week Ending Sept. 7, 2024
• Active inventory increased, with for-sale homes 33.4% above year-ago levels
For the 44th consecutive week dating to November 2023, the number of listings for sale has grown year over year, and this week continues a string of growth rates in the mid-30% range that started in April. This is a slight decrease from last week’s gain of 34.6%.
• New listings—a measure of sellers putting homes up for sale—ticked higher this week by 9.9% from one year ago
The recent easing of mortgage rates has encouraged many sellers to return to the market, with the year-over-year growth in new listings experiencing its largest increase in a month. What’s more, the rate was nearly double last week’s gain of 5.5%.
 Here is a graph of the year-over-year change in inventory according to realtor.com.
 Inventory was up year-over-year for the 44th consecutive week.
However, inventory is still historically low.
New listings remain below typical pre-pandemic levels.
The "Home ATM" Mostly Closed in Q2
by Calculated Risk on 9/12/2024 12:58:00 PM
Today, in the Real Estate Newsletter: The "Home ATM" Mostly Closed in Q2
Excerpt:
During the housing bubble, many homeowners borrowed heavily against their perceived home equity - jokingly calling it the “Home ATM” - and this contributed to the subsequent housing bust, since so many homeowners had negative equity in their homes when house prices declined.There is much more in the article. You can subscribe at https://calculatedrisk.substack.com/.
Unlike during the housing bubble, very few homeowners have negative equity now. From CoreLogic this morning: Homeowner Equity Insights – Q2 2024The report shows that U.S. homeowners with mortgages (which account for roughly 62% of all properties) saw home equity increase by 8.0% year over year, representing a collective gain of $1.3 trillion and an average increase of $25,000 per borrower since the second quarter of 2023, bringing the total net homeowner equity to over $17.6 trillion in the second quarter of 2024. …
From the second quarter of 2023 to the second quarter of 2024, the total number of mortgaged homes in negative equity decreased by 4.2%, to 1 million homes or 1.7% of all mortgaged properties.Here is the quarterly increase in mortgage debt from the Federal Reserve’s Financial Accounts of the United States - Z.1 (sometimes called the Flow of Funds report) released today. In the mid ‘00s, there was a large increase in mortgage debt associated with the housing bubble.
In Q2 2024, mortgage debt increased $99 billion, up from $31 billion in Q1, and down from the cycle peak of $467 billion in Q2 2021. Note the almost 7 years of declining mortgage debt as distressed sales (foreclosures and short sales) wiped out a significant amount of debt.
However, some of this debt is being used to increase the housing stock (purchase new homes), so this isn’t all Mortgage Equity Withdrawal (MEW).

Fed's Flow of Funds: Household Net Worth Increased $2.8 Trillion in Q2
by Calculated Risk on 9/12/2024 12:29:00 PM
The Federal Reserve released the Q2 2024 Flow of Funds report today: Financial Accounts of the United States.
The net worth of households and nonprofits rose to $163.8 trillion during the second quarter of 2024. The value of directly and indirectly held corporate equities increased $0.7 trillion and the value of real estate increased $1.8 trillion.
...
Household debt increased 3.2 percent at an annual rate in the second quarter of 2024. Consumer credit grew at an annual rate of 1.6 percent, while mortgage debt (excluding charge-offs) grew at an annual rate of 3 percent.
 Click on graph for larger image.
The first graph shows Households and Nonprofit net worth as a percent of GDP.
Net worth increased $2.8 trillion in Q2 to an all-time high. As a percent of GDP, net worth increased in Q2, but is below the peak in 2021.
This includes real estate and financial assets (stocks, bonds, pension reserves, deposits, etc.) net of liabilities (mostly mortgages). Note that this does NOT include public debt obligations.
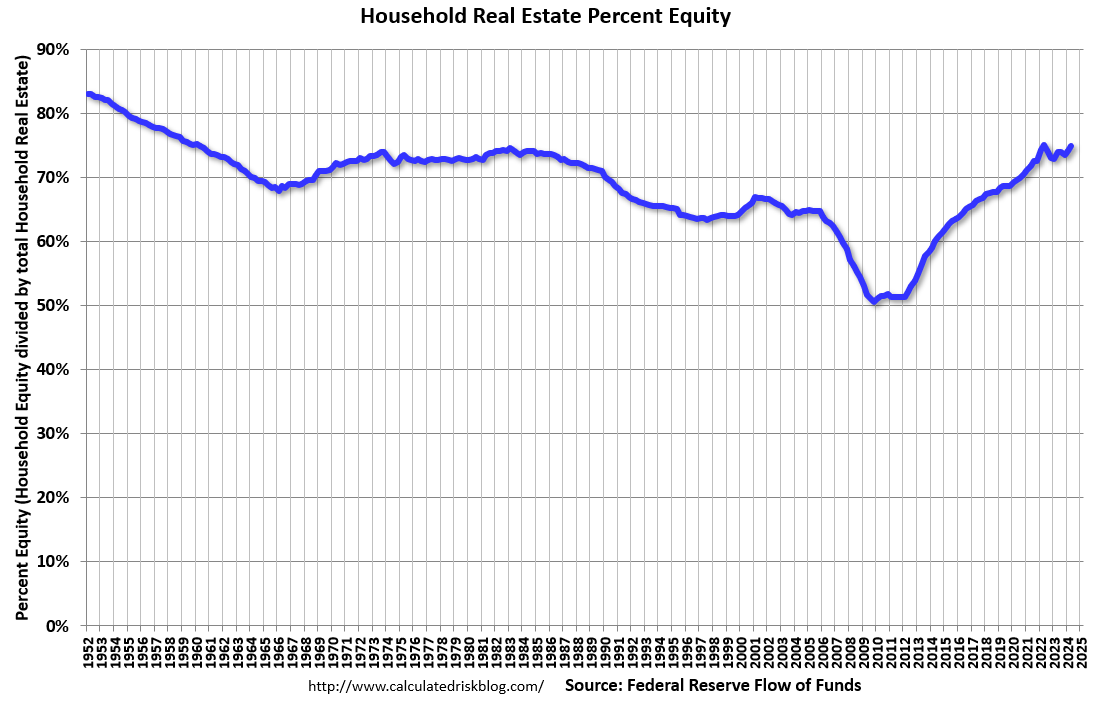
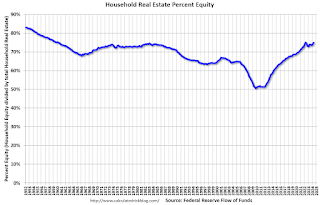 The second graph shows homeowner percent equity since 1952.
Household percent equity (as measured by the Fed) collapsed when house prices fell sharply in 2007 and 2008.
In Q2 2024, household percent equity (of household real estate) was at 74.9% - up from 74.2% in Q1, 2024. This is close to the highest percent equity since the 1960s.
Note: This includes households with no mortgage debt.
 The third graph shows household real estate assets and mortgage debt as a percent of GDP.
Mortgage debt increased by $98 billion in Q2.
Mortgage debt is up $2.34 trillion from the peak during the housing bubble, but, as a percent of GDP is at 45.9% - down from Q1 - and down from a peak of 73.3% of GDP during the housing bust.
The value of real estate, as a percent of GDP, increased in Q2 - but is below the peak in Q2 2022, and is well above the average of the last 30 years.
 The second graph shows homeowner percent equity since 1952.
 Household percent equity (as measured by the Fed) collapsed when house prices fell sharply in 2007 and 2008.
In Q2 2024, household percent equity (of household real estate) was at 74.9% - up from 74.2% in Q1, 2024. This is close to the highest percent equity since the 1960s.
Note: This includes households with no mortgage debt.
 The third graph shows household real estate assets and mortgage debt as a percent of GDP.
 Mortgage debt increased by $98 billion in Q2.
Mortgage debt is up $2.34 trillion from the peak during the housing bubble, but, as a percent of GDP is at 45.9% - down from Q1 - and down from a peak of 73.3% of GDP during the housing bust.
The value of real estate, as a percent of GDP, increased in Q2 - but is below the peak in Q2 2022, and is well above the average of the last 30 years.
CoreLogic: 1.11 million Homeowners with Negative Equity in Q2 2024
by Calculated Risk on 9/12/2024 09:51:00 AM
From CoreLogic: CoreLogic: US Homeowners See Equity Gains Continue to Climb, but at a Slower Pace in Q2
CoreLogic® ... today released the Homeowner Equity Report (HER) for the second quarter of 2024. The report shows that U.S. homeowners with mortgages (which account for roughly 62% of all properties) saw home equity increase by 8.0% year over year, representing a collective gain of $1.3 trillion and an average increase of $25,000 per borrower since the second quarter of 2023, bringing the total net homeowner equity to over $17.6 trillion in the second quarter of 2024.The above graph is from CoreLogic and compares Q2 2024 to Q1 2024 equity distribution by LTV. There are still a few properties with LTV over 125%. But most homeowners have a significant amount of equity.
...
“Persistent home price growth has continued to fuel home equity gains for existing homeowners who now average about $315,000 in equity and almost $129,000 more than at the onset of the pandemic.” said Dr. Selma Hepp, chief economist for CoreLogic. “The substantial accumulation of home equity for existing homeowners has served as an important financial buffer in times of uncertainty, as some homeowners facing higher costs of homeowners’ insurance and taxes and have had to tap into their equity to prevent falling behind on their mortgages. As a result, mortgage delinquency rates have remained at historical lows despite the inflationary pressures and higher costs of almost all non-mortgage homeownership-related expenses.”
Negative equity, also referred to as underwater or upside-down mortgages, applies to borrowers who owe more on their mortgages than their homes are currently worth.
Negative equity has continued to see a recent decrease across the country. Las Vegas and Los Angeles are the least challenged, with negative equity shares of all mortgages at 0.6% and 0.7%, respectively.
As of the second quarter of 2024, the quarterly and annual changes in negative equity were:
Click on graph for larger image.
• Quarterly change: From the second quarter of 2023 to the second quarter of 2024, the total number of mortgaged homes in negative equity decreased by 4.2%, to 1 million homes or 1.7% of all mortgaged properties.
• Annual change: From the second quarter of 2023 to the first second of 2024, the total number of homes in negative equity decreased by 15%, to 1.1 million homes or 2.0% of all mortgaged properties.
emphasis added

 This is a very different picture than at the start of the housing bust when many homeowners had little equity.
The second graph is from a 2011 CoreLogic report and shows a large number of homeowners with negative equity - even as house prices were nearing a bottom!
On a year-over-year basis, the number of homeowners with negative equity has decreased to 1.11 million.
On a year-over-year basis, the number of homeowners with negative equity has decreased to 1.11 million.
Weekly Initial Unemployment Claims Increase to 230,000
by Calculated Risk on 9/12/2024 08:30:00 AM
The DOL reported:
In the week ending September 7, the advance figure for seasonally adjusted initial claims was 230,000, an increase of 2,000 from the previous week's revised level. The previous week's level was revised up by 1,000 from 227,000 to 228,000. The 4-week moving average was 230,750, an increase of 500 from the previous week's revised average. The previous week's average was revised up by 250 from 230,000 to 230,250.The following graph shows the 4-week moving average of weekly claims since 1971.
emphasis added
 Click on graph for larger image.
The dashed line on the graph is the current 4-week average. The four-week average of weekly unemployment claims increased to 230,750.
The previous week was revised up.
Weekly claims were above the consensus forecast.
Wednesday, September 11, 2024
Thursday: Unemployment Claims, PPI, Q2 Flow of Funds
by Calculated Risk on 9/11/2024 07:09:00 PM
 Note: Mortgage rates are from MortgageNewsDaily.com and are for top tier scenarios.
Thursday:
• At 8:30 AM ET, The initial weekly unemployment claims report will be released. The consensus is for 225 thousand initial claims, down from 227 thousand last week.
• At 8:30 AM, The Producer Price Index for August from the BLS. The consensus is for a 0.2% increase in PPI, and a 0.2% increase in core PPI.
• At 12:00 PM, Q2 Flow of Funds Accounts of the United States from the Federal Reserve.
Early Look at 2025 Cost-Of-Living Adjustments and Maximum Contribution Base
by Calculated Risk on 9/11/2024 04:02:00 PM
The BLS reported this morning:
The Consumer Price Index for Urban Wage Earners and Clerical Workers (CPI-W) increased 2.4 percent over the last 12 months to an index level of 308.640 (1982-84=100). For the month, the index was unchanged prior to seasonal adjustment.CPI-W is the index that is used to calculate the Cost-Of-Living Adjustments (COLA). The calculation dates have changed over time (see Cost-of-Living Adjustments), but the current calculation uses the average CPI-W for the three months in Q3 (July, August, September) and compares to the average for the highest previous average of Q3 months. Note: this is not the headline CPI-U and is not seasonally adjusted (NSA).
• In 2023, the Q3 average of CPI-W was 301.236.
The 2023 Q3 average was the highest Q3 average, so we only have to compare Q3 this year to last year.
 Click on graph for larger image.
This graph shows CPI-W since January 2000. The red lines are the Q3 average of CPI-W for each year.
Note: The year labeled is for the calculation, and the adjustment is effective for December of that year (received by beneficiaries in January of the following year).
CPI-W was up 2.4% year-over-year in August, and although this is early - we need the data for July, August and September - my guess is COLA will probably be around 2.4% this year, the smallest increase since 1.3% in 2021.
Contribution and Benefit Base
The contribution base will be adjusted using the National Average Wage Index. This is based on a one-year lag. The National Average Wage Index is not available for 2023 yet, although we know wages increased solidly in 2023. If wages increased 5% in 2023, then the contribution base next year will increase to around $177,000 in 2025, from the current $168,600.
Remember - this is an early look. What matters is average CPI-W, NSA, for all three months in Q3 (July, August and September).
Cleveland Fed: Median CPI increased 0.3% and Trimmed-mean CPI increased 0.2% in August
by Calculated Risk on 9/11/2024 12:17:00 PM
The Cleveland Fed released the median CPI and the trimmed-mean CPI.
According to the Federal Reserve Bank of Cleveland, the median Consumer Price Index rose 0.3% in August. The 16% trimmed-mean Consumer Price Index increased 0.2%. "The median CPI and 16% trimmed-mean CPI are measures of core inflation calculated by the Federal Reserve Bank of Cleveland based on data released in the Bureau of Labor Statistics’ (BLS) monthly CPI report".
 Click on graph for larger image.
This graph shows the year-over-year change for these four key measures of inflation.
Note: The Cleveland Fed released the median CPI details. Fuel oil and other fuels decreased at a 17% annual rate in August (and will likely decrease further in September).
According to the Federal Reserve Bank of Cleveland, the median Consumer Price Index rose 0.3% in August. The 16% trimmed-mean Consumer Price Index increased 0.2%. "The median CPI and 16% trimmed-mean CPI are measures of core inflation calculated by the Federal Reserve Bank of Cleveland based on data released in the Bureau of Labor Statistics’ (BLS) monthly CPI report".
 Click on graph for larger image.
This graph shows the year-over-year change for these four key measures of inflation.
On a year-over-year basis, the median CPI rose 4.2% (down from 4.2% in July, rounded), the trimmed-mean CPI rose 3.2% (down from 3.3%), and the CPI less food and energy rose 3.2% (unchanged from 3.2%).
Core PCE is for July was up 2.6% YoY, unchanged from 2.6% in June.
Note: The Cleveland Fed released the median CPI details. Fuel oil and other fuels decreased at a 17% annual rate in August (and will likely decrease further in September).
Rent and Owner's equivalent rent are still high, and if we exclude rent, median CPI would be around -1% month-over-month, annualized.
Asking Rents Mostly Unchanged Year-over-year
by Calculated Risk on 9/11/2024 09:44:00 AM
Today, in the Real Estate Newsletter: Asking Rents Mostly Unchanged Year-over-year
Brief excerpt:
Tracking rents is important for understanding the dynamics of the housing market. For example, the sharp increase in rents helped me deduce that there was a surge in household formation in 2021 (See from September 2021: Household Formation Drives Housing Demand). Now that household formation has slowed, and multi-family completions have increased, rents are under pressure....
Welcome to the September 2024 Apartment List National Rent Report. Our model captured an average rent decrease of -0.1% in August, and today the nationwide median rent stands at $1,412. This signals the end of the rental market’s annual busy season, as well as the second consecutive summer of modest rent growth, as the market remains sluggish thanks to a windfall of new supply. If historical trends hold, rents will continue to fall on a monthly basis for the remainder of the year.

Realtor.com: 12th Consecutive Month with Year-over-year Decline in Rents
In July 2024, the U.S. median rent continued to decline year over year for the 12th month in a row, down $12 (-0.7%) for 0-2 bedroom properties across the top 50 metros, faster than the rate of -0.4% seen in June 2024. The median asking rent was $1,741, down by $2 from last month, reflecting a similar seasonal trend as observed in the for-sale market.
YoY Measures of Inflation: Services, Goods and Shelter
by Calculated Risk on 9/11/2024 08:54:00 AM
Here are a few measures of inflation:
The first graph is the one Fed Chair Powell had mentioned when services less rent of shelter was up around 8% year-over-year. This declined and is now up 4.3% YoY.
 Click on graph for larger image.
This graph shows the YoY price change for Services and Services less rent of shelter through August 2024.
Services were up 4.8% YoY as of August 2024, down from 4.9% YoY in July.
Services less rent of shelter was up 4.3% YoY in August, down from 4.6% YoY in July.
Services less rent of shelter was up 4.3% YoY in August, down from 4.6% YoY in July.
 The second graph shows that goods prices started to increase year-over-year (YoY) in 2020 and accelerated in 2021 due to both strong demand and supply chain disruptions.
Durables were at -4.2% YoY as of August 2024, down from -4.1% YoY in July.
Commodities less food and energy commodities were at -1.7% YoY in August, unchanged from -1.7% YoY in July.
Commodities less food and energy commodities were at -1.7% YoY in August, unchanged from -1.7% YoY in July.
 Here is a graph of the year-over-year change in shelter from the CPI report (through August) and housing from the PCE report (through July)
Shelter was up 5.2% year-over-year in August, up from 5.0% in July. Housing (PCE) was up 5.3% YoY in July, down from 5.3% in June (rounded).
The BLS noted: "The index for shelter rose 0.5 percent in August and was the main factor in the all items increase."
This is still catching up with private data.
Core CPI ex-shelter was up 1.7% YoY in August, down from 1.8% in July.
BLS: CPI Increased 0.2% in August; Core CPI increased 0.3%
by Calculated Risk on 9/11/2024 08:30:00 AM
The Consumer Price Index for All Urban Consumers (CPI-U) increased 0.2 percent on a seasonally adjusted basis, the same increase as in July, the U.S. Bureau of Labor Statistics reported today. Over the last 12 months, the all items index increased 2.5 percent before seasonal adjustment.The change in CPI was at expectation and core CPI slightly above expectations. I'll post a graph later today after the Cleveland Fed releases the median and trimmed-mean CPI.
The index for shelter rose 0.5 percent in August and was the main factor in the all items increase. The food index increased 0.1 percent in August, after rising 0.2 percent in July. The index for food away from home rose 0.3 percent over the month, while the index for food at home was unchanged. The energy index fell 0.8 percent over the month, after being unchanged the preceding month.
The index for all items less food and energy rose 0.3 percent in August, after rising 0.2 percent the preceding month. Indexes which increased in August include shelter, airline fares, motor vehicle insurance, education, and apparel. The indexes for used cars and trucks, household furnishings and operations, medical care, communication, and recreation were among those that decreased over the month.
The all items index rose 2.5 percent for the 12 months ending August, the smallest 12-month increase since February 2021. The all items less food and energy index rose 3.2 percent over the last 12 months. The energy index decreased 4.0 percent for the 12 months ending August. The food index increased 2.1 percent over the last year.
emphasis added
MBA: Mortgage Applications Increased in Weekly Survey
by Calculated Risk on 9/11/2024 07:00:00 AM
From the MBA: Mortgage Applications Increase in Latest MBA Weekly Survey
Mortgage applications increased 1.4 percent from one week earlier, according to data from the Mortgage Bankers Association’s (MBA) Weekly Applications Survey for the week ending September 6, 2024. This week’s results include an adjustment for the Labor Day Holiday.
The Market Composite Index, a measure of mortgage loan application volume, increased 1.4 percent on a seasonally adjusted basis from one week earlier. On an unadjusted basis, the Index decreased 10 percent compared with the previous week. The Refinance Index increased 1 percent from the previous week and was 106 percent higher than the same week one year ago. The seasonally adjusted Purchase Index increased 2 percent from one week earlier. The unadjusted Purchase Index decreased 10 percent compared with the previous week and was 3 percent lower than the same week one year ago.
“Mortgage rates declined for the sixth consecutive week, with the 30-year fixed rate decreasing to 6.29 percent, the lowest rate since February 2023. Treasury yields have been responding to data showing a picture of cooling inflation, a slowing job market, and the anticipated first rate cut from the Federal Reserve later this month,” said Joel Kan, MBA’s Vice President and Deputy Chief Economist. “With rates almost a full percentage point lower than a year ago, refinance applications continue to run much higher than last year’s pace. However, there is still somewhat limited refinance potential as many borrowers still have sub-5 percent rates. It is a positive development that there are homeowners who can benefit from a refinance as rates continues to move lower.”
Added Kan, “Purchase applications increased over the week and are edging closer to last year’s levels. Despite the drop in rates, affordability challenges and other factors such as limited inventory might still be hindering purchase decisions.”
...
The average contract interest rate for 30-year fixed-rate mortgages with conforming loan balances ($766,550 or less) decreased to 6.29 percent from 6.43 percent, with points decreasing to 0.55 from 0.56 (including the origination fee) for 80 percent loan-to-value ratio (LTV) loans.
emphasis added
 Click on graph for larger image.
The first graph shows the MBA mortgage purchase index.
According to the MBA, purchase activity is down 3% year-over-year unadjusted.
Red is a four-week average (blue is weekly).
Purchase application activity is up about 10% from the lows in late October 2023, but still below the lowest levels during the housing bust.

The second graph shows the refinance index since 1990.
With higher mortgage rates, the refinance index declined sharply in 2022 - and mostly flat lined for two years - but has increased recently as mortgage rates declined.
Tuesday, September 10, 2024
Wednesday: CPI
by Calculated Risk on 9/10/2024 07:16:00 PM
 Note: Mortgage rates are from MortgageNewsDaily.com and are for top tier scenarios.
Wednesday:
• At 7:00 AM ET, The Mortgage Bankers Association (MBA) will release the results for the mortgage purchase applications index.
• At 8:30 AM, The Consumer Price Index for August from the BLS. The consensus is for a 0.2% increase in CPI, and a 0.2% increase in core CPI. The consensus is for CPI to be up 2.6% year-over-year (down from 2.9% in July) and core CPI to be up 3.2% YoY (unchanged from 3.2% in July).
CoreLogic: US Home Prices Increased 4.3% Year-over-year in July, "Notable Cooling"
by Calculated Risk on 9/10/2024 03:54:00 PM
Notes: This CoreLogic House Price Index report is for July. The recent Case-Shiller index release was for June. The CoreLogic HPI is a three-month weighted average and is not seasonally adjusted (NSA).
From CoreLogic: CoreLogic: Annual US Home Price Growth Dips Below 5% as Summer Brings Notable Cooling to the Housing Market
• U.S. home prices posted a 4.3% year-over-year gain in July, with no states posting double-digit gains.This was a smaller YoY increase than reported for May, and down from the 5.8% YoY increase reported at the beginning of 2024.
• Home prices showed no gains in July compared with the month before – the first July since 2010 that home prices didn’t increase outside the 2022 declines following a surge in mortgage rates
• By August, home prices are forecast to rise only 0.2% as the summer slowdown continues.
• Miami once again took the lead as the metro with the greatest price growth among the top 10 largest metros
...
U.S. year-over-year home price gains inched down, reaching 4.3% in July, falling further from the previous month’s 4.7% and resting below 5% for the third consecutive month. On a month-over-month basis, home prices decreased by 0.01% in July 2024 compared with June 2024. We will likely see home prices continue to slide for the remainder of the year as sales across the country slow. Although July marked the 150th consecutive month of annual growth, monthly home price growth is starting to slip, and annual forecasts are showing smaller anticipated gains. By August, home prices are forecast to rise only 0.2%, and next year, prices will inch up by 2.2%.
Much of this sluggishness can be attributed to high mortgage interest rates that are continuing to challenge the housing market. As buyers remain cautious, sales remain low. However, the highly anticipated rate cuts from the Federal Reserve this fall may help improve consumer purchase sentiment for the housing market.
“Housing demand continued to buckle under the pressure of high mortgage rates and unaffordable home prices, leading to a considerable slowing of home price gains during the summer. July’s prices were essentially flat from the month before, which was notably cooler than the average gain of 0.4% recorded between June and July in years prior to the pandemic and especially during the pandemic,” said Dr. Selma Hepp chief economist for CoreLogic. “The question for home prices going forward is whether the upcoming rate cut from the Fed and expected continuation of falling mortgage rates will be sufficient to motivate potential homebuyers who may start to fear cooling labor market and continued uncertainty of a soft landing, along with anticipation around the presidential election. And while lower mortgage rates are a boost to affordability and are likely to help buyer demand, the usual fall housing market slowdown is upon us and is likely to contain any significant surge in activity.”
emphasis added


