 RSS Feed
 by Calculated Risk on 6/23/2024 06:36:00 PM
Sunday, June 23, 2024
Sunday Night Futures
Weekend:
• Schedule for Week of June 23, 2024
Monday:
• At 10:30 AM ET, Dallas Fed Survey of Manufacturing Activity for June.
From CNBC: Pre-Market Data and Bloomberg futures S&P 500 and DOW futures are little changed (fair value).
Oil prices were up over the last week with WTI futures at $80.73 per barrel and Brent at $85.24 per barrel. A year ago, WTI was at $69, and Brent was at $74 - so WTI oil prices are up about 17% year-over-year.
Here is a graph from Gasbuddy.com for nationwide gasoline prices. Nationally prices are at $3.42 per gallon. A year ago, prices were at $3.56 per gallon, so gasoline prices are down $0.14 year-over-year.
Hotels: Occupancy Rate Decreased 0.6% Year-over-year
by Calculated Risk on 6/23/2024 01:04:00 PM
The U.S. hotel industry reported higher performance results from the previous week but mixed comparisons year over year, according to CoStar’s latest data through 15 June. ...The following graph shows the seasonal pattern for the hotel occupancy rate using the four-week average.
9-15 June 2024 (percentage change from comparable week in 2023):
• Occupancy: 70.3% (-0.6%)
• Average daily rate (ADR): US$161.70 (+0.9%)
• Revenue per available room (RevPAR): US$113.62 (+0.3%)
emphasis added
 Click on graph for larger image.
The red line is for 2024, blue is the median, and dashed light blue is for 2023. Dashed purple is for 2018, the record year for hotel occupancy.
The 4-week average of the occupancy rate is tracking last year and is slightly above the median rate for the period 2000 through 2023 (Blue).
Note: Y-axis doesn't start at zero to better show the seasonal change.
The 4-week average of the occupancy rate will now increase seasonally with the summer travel season.
Saturday, June 22, 2024
Real Estate Newsletter Articles this Week: Single Family Starts Down Slightly Year-over-year in May; Multi-Family Starts Down 50%
by Calculated Risk on 6/22/2024 02:11:00 PM
At the Calculated Risk Real Estate Newsletter this week:
 Click on graph for larger image.
• Single Family Starts Down Slightly Year-over-year in May; Multi-Family Starts Down 50%
• NAR: Existing-Home Sales Decreased to 4.11 million SAAR in May
• Lawler: Early Read on Existing Home Sales in May
• 4th Look at Local Housing Markets in May; California Home Sales Down 6% YoY in May
• Comparing the Current Housing Market to the 1978 to 1982 period
This is usually published 4 to 6 times a week and provides more in-depth analysis of the housing market.
Schedule for Week of June 23, 2024
by Calculated Risk on 6/22/2024 08:11:00 AM
The key reports this week are May New Home sales, the third estimate of Q1 GDP, Personal Income and Outlays for May and the April Case-Shiller house price index.
For manufacturing, the June Dallas, Kansas City and Richmond Fed manufacturing surveys will be released.
10:30 AM: Dallas Fed Survey of Manufacturing Activity for June.
8:30 AM ET: Chicago Fed National Activity Index for May. This is a composite index of other data.
 9:00 AM: S&P/Case-Shiller House Price Index for April.
This graph shows the year-over-year change in the seasonally adjusted National Index, Composite 10 and Composite 20 indexes through the most recent report (the Composite 20 was started in January 2000).
The National index was up 6.5% year-over-year in March.
9:00 AM: FHFA House Price Index for April. This was originally a GSE only repeat sales, however there is also an expanded index.
10:00 AM: Richmond Fed Survey of Manufacturing Activity for June.
10:00 AM: State Employment and Unemployment (Monthly) for May 2024.
7:00 AM ET: The Mortgage Bankers Association (MBA) will release the results for the mortgage purchase applications index.
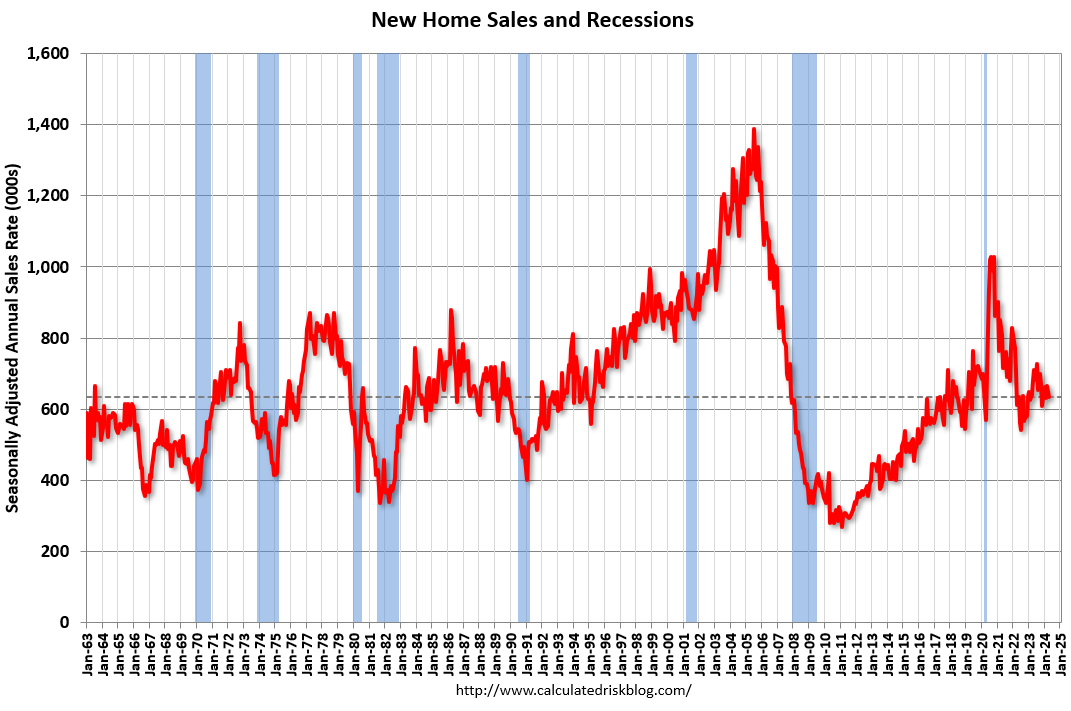 10:00 AM: New Home Sales for May from the Census Bureau.
 This graph shows New Home Sales since 1963. The dashed line is the sales rate for last month.
The consensus is for 650 thousand SAAR, up from 634 thousand in April.
During the day: The AIA's Architecture Billings Index for May (a leading indicator for commercial real estate).
8:30 AM: The initial weekly unemployment claims report will be released. The consensus is for 240 thousand initial claims, up from 238 thousand last week.
8:30 AM: Gross Domestic Product, 1st quarter 2024 (Third estimate). The consensus is that real GDP increased 1.3% annualized in Q1, unchanged from the second estimate of a 1.3% increase.
8:30 AM: Durable Goods Orders for May from the Census Bureau. The consensus is for a 0.3% increase in durable goods orders.
10:00 AM: Pending Home Sales Index for May. The consensus is for a 0.3% decrease in the index.
11:00 AM: the Kansas City Fed manufacturing survey for June.
8:30 AM ET: Personal Income and Outlays, May 2024. The consensus is for a 0.4% increase in personal income, and for a 0.3% increase in personal spending.
9:45 AM: Chicago Purchasing Managers Index for June.
10:00 AM: University of Michigan's Consumer sentiment index (Final for June).
Friday, June 21, 2024
June 21st COVID Update: Wastewater Measure Increasing
by Calculated Risk on 6/21/2024 07:02:00 PM
 Note: Mortgage rates are from MortgageNewsDaily.com and are for top tier scenarios.
For deaths, I'm currently using 4 weeks ago for "now", since the most recent three weeks will be revised significantly.
Note: "Effective May 1, 2024, hospitals are no longer required to report COVID-19 hospital admissions, hospital capacity, or hospital occupancy data." So I'm no longer tracking hospitalizations, however hospitalizations were at a pandemic low three weeks ago.
| COVID Metrics | ||||
|---|---|---|---|---|
| Now | Week Ago | Goal | ||
| Deaths per Week✅ | 316 | 316 | ≤3501 | |
| 1my goals to stop weekly posts, 🚩 Increasing number weekly for Deaths ✅ Goal met. | ||||
 Click on graph for larger image.
This graph shows the weekly (columns) number of deaths reported.
Weekly deaths have declined from the recent peak of 2,561 and are now below the previous pandemic low of 491 last July. This week was at the pandemic low.
 This appears to be a leading indicator for COVID hospitalizations and deaths.
COVID in wastewater is increasing - especially in the West - and this suggest weekly deaths likely start increasing again.
Q2 GDP Tracking: 1.8% to 3.0%
by Calculated Risk on 6/21/2024 02:36:00 PM
From BofA:
Our 2Q tracking estimate is two tenths higher at 1.8% q/q saar largely due to stronger than expected May payrolls and weaker than expected May CPI and PPI [June 20th estimate]From Goldman:
emphasis added
We lowered our Q2 GDP tracking estimate by 0.1pp to +1.9% (qoq ar) and our Q2 domestic final sales forecast by the same amount to +2.0%. [June 20th estimate]And from the Altanta Fed: GDPNow
The GDPNow model estimate for real GDP growth (seasonally adjusted annual rate) in the second quarter of 2024 is 3.0 percent on June 20, down from 3.1 percent on June 18. After this morning's housing starts report from the US Census Bureau, the nowcast of second-quarter real gross private domestic investment growth decreased from 8.8 percent to 8.3 percent. [June 18th estimate]
NAR: Existing-Home Sales Decreased to 4.11 million SAAR in May; Median House Prices Increased 5.8% Year-over-Year
by Calculated Risk on 6/21/2024 10:48:00 AM
Today, in the CalculatedRisk Real Estate Newsletter: NAR: Existing-Home Sales Decreased to 4.11 million SAAR in May
Excerpt:
Sales Year-over-Year and Not Seasonally Adjusted (NSA)There is much more in the article.
The fourth graph shows existing home sales by month for 2023 and 2024.
Sales declined 2.8% year-over-year compared to May 2023. This was the thirty-third consecutive month with sales down year-over-year.

NAR: Existing-Home Sales Decreased to 4.11 million SAAR in May
by Calculated Risk on 6/21/2024 10:00:00 AM
From the NAR: Existing-Home Sales Edged Lower by 0.7% in May as Median Sales Price Reached Record High of $419,300
Existing-home sales slightly declined in May as the median sales price climbed to a record high, according to the National Association of REALTORS®. In the four major U.S. regions, sales slid month-over-month in the South but were unchanged in the Northeast, Midwest and West. Year-over-year, sales rose in the Midwest but receded in the Northeast, South and West.
Total existing-home sales – completed transactions that include single-family homes, townhomes, condominiums and co-ops – retreated 0.7% from April to a seasonally adjusted annual rate of 4.11 million in May. Year-over-year, sales waned 2.8% (down from 4.23 million in May 2023).
...
Total housing inventory registered at the end of May was 1.28 million units, up 6.7% from April and 18.5% from one year ago (1.08 million). Unsold inventory sits at a 3.7-month supply at the current sales pace, up from 3.5 months in April and 3.1 months in May 2023.
emphasis added
 Click on graph for larger image.
This graph shows existing home sales, on a Seasonally Adjusted Annual Rate (SAAR) basis since 1994.
Sales in May (4.11 million SAAR) were down 0.7% from the previous month and were 2.8% below the May 2023 sales rate.
The second graph shows nationwide inventory for existing homes.
 According to the NAR, inventory increased to 1.28 million in May from 1.20 million the previous month.
 According to the NAR, inventory increased to 1.28 million in May from 1.20 million the previous month.
Headline inventory is not seasonally adjusted, and inventory usually decreases to the seasonal lows in December and January, and peaks in mid-to-late summer.
The last graph shows the year-over-year (YoY) change in reported existing home inventory and months-of-supply. Since inventory is not seasonally adjusted, it really helps to look at the YoY change. Note: Months-of-supply is based on the seasonally adjusted sales and not seasonally adjusted inventory.
 Inventory was up 18.5% year-over-year (blue) in May compared to May 2023.
Months of supply (red) increased to 3.7 months in May from 3.5 months the previous month.
This was close to the consensus forecast. I'll have more later.
The last graph shows the year-over-year (YoY) change in reported existing home inventory and months-of-supply. Since inventory is not seasonally adjusted, it really helps to look at the YoY change. Note: Months-of-supply is based on the seasonally adjusted sales and not seasonally adjusted inventory.
 Inventory was up 18.5% year-over-year (blue) in May compared to May 2023.
 Months of supply (red) increased to 3.7 months in May from 3.5 months the previous month.
This was close to the consensus forecast. I'll have more later.
Thursday, June 20, 2024
Friday: Existing Home Sales
by Calculated Risk on 6/20/2024 07:51:00 PM
 Note: Mortgage rates are from MortgageNewsDaily.com and are for top tier scenarios.
Friday:
• At 10:00 AM ET, Existing Home Sales for May from the National Association of Realtors (NAR). The consensus is for 4.10 million SAAR, down from 4.14 million.
Realtor.com Reports Active Inventory Up 36.0% YoY
by Calculated Risk on 6/20/2024 12:45:00 PM
What this means: On a weekly basis, Realtor.com reports the year-over-year change in active inventory and new listings. On a monthly basis, they report total inventory. For April, Realtor.com reported inventory was up 35.2% YoY, but still down almost 34% compared to April 2017 to 2019 levels.
Now - on a weekly basis - inventory is up 36.0% YoY.
Realtor.com has monthly and weekly data on the existing home market. Here is their weekly report: Weekly Housing Trends View—Data for Week Ending June 15, 2024 Here is a graph of the year-over-year change in inventory according to realtor.com.
Inventory was up year-over-year for the 32nd consecutive week.
Realtor.com has monthly and weekly data on the existing home market. Here is their weekly report: Weekly Housing Trends View—Data for Week Ending June 15, 2024
• Active inventory increased, with for-sale homes 36.0% above year-ago levels.
For the 32nd straight week, there were more homes listed for sale versus the prior year, giving homebuyers more options. This past week, the inventory of homes for sale grew by 36.0% compared with last year, maintaining the same rate of growth as the previous week.
• New listings–a measure of sellers putting homes up for sale–were up this week, by 8.0% from one year ago.
Seller activity continued to climb annually last week, matching last week’s annual growth rate of 8%. These past few months sellers have been particularly sensitive to mortgage rates, with newly listed homes being one of the first metrics to respond to the small fluctuations seen in mortgage rates in recent months. If the promising inflation readings seen in May continue, it could lead to softening rates and increase in seller interest toward the latter half of the year. Meanwhile, newly listed homes remained approximately 22% below pre-pandemic (2017 to 2019) levels.
 Here is a graph of the year-over-year change in inventory according to realtor.com.
 Inventory was up year-over-year for the 32nd consecutive week.
However, inventory is still historically low.
New listings remain below typical pre-pandemic levels although up year-over-year.
Single Family Starts Down Slightly Year-over-year in May; Multi-Family Starts Down 50%
by Calculated Risk on 6/20/2024 09:12:00 AM
Today, in the Calculated Risk Real Estate Newsletter: Single Family Starts Down Slightly Year-over-year in May; Multi-Family Starts Down 50%
A brief excerpt:
Total housing starts in May were below expectations, however, starts in March and April were revised up slightly, combined.There is much more in the article.
The third graph shows the month-to-month comparison for total starts between 2023 (blue) and 2024 (red).
Total starts were down 19.3% in May compared to May 2023. Note that starts in May 2023 were very strong, so the year-over-year comparison was difficult.
The YoY decline in total starts was mostly due to the sharp YoY decrease in multi-family starts, although single family starts were down slightly YoY following 10 months of year-over-year increases.

Housing Starts Decreased to 1.277 million Annual Rate in May
by Calculated Risk on 6/20/2024 08:32:00 AM
From the Census Bureau: Permits, Starts and Completions
Housing Starts:
Privately‐owned housing starts in May were at a seasonally adjusted annual rate of 1,277,000. This is 5.5 percent below the revised April estimate of 1,352,000 and is 19.3 percent below the May 2023 rate of 1,583,000. Single‐family housing starts in May were at a rate of 982,000; this is 5.2 percent below the revised April figure of 1,036,000. The May rate for units in buildings with five units or more was 278,000.
Building Permits:
Privately‐owned housing units authorized by building permits in May were at a seasonally adjusted annual rate of 1,386,000. This is 3.8 percent below the revised April rate of 1,440,000 and is 9.5 percent below the May 2023 rate of 1,532,000. Single‐family authorizations in May were at a rate of 949,000; this is 2.9 percent below the revised April figure of 977,000. Authorizations of units in buildings with five units or more were at a rate of 382,000 in May.
emphasis added
Click on graph for larger image.The first graph shows single and multi-family housing starts since 2000.
Multi-family starts (blue, 2+ units) decreased in May compared to April. Multi-family starts were down 49.5% year-over-year.
Single-family starts (red) decreased in May and were down 1.7% year-over-year.
 The second graph shows single and multi-family housing starts since 1968.
 This shows the huge collapse following the housing bubble, and then the eventual recovery - and the recent collapse and recovery in single-family starts.
Total housing starts in May were below expectations, however, starts in March and April were revised up, combined.
I'll have more later …
Weekly Initial Unemployment Claims Decrease to 238,000
by Calculated Risk on 6/20/2024 08:30:00 AM
The DOL reported:
In the week ending June 15, the advance figure for seasonally adjusted initial claims was 238,000, a decrease of 5,000 from the previous week's revised level. The previous week's level was revised up by 1,000 from 242,000 to 243,000. The 4-week moving average was 232,750, an increase of 5,500 from the previous week's revised average. The previous week's average was revised up by 250 from 227,000 to 227,250.The following graph shows the 4-week moving average of weekly claims since 1971.
emphasis added
 Click on graph for larger image.
The dashed line on the graph is the current 4-week average. The four-week average of weekly unemployment claims increased to 232,750.
The previous week was revised up.
Weekly claims were close to the consensus forecast.
Wednesday, June 19, 2024
Thursday: Housing Starts, Unemployment Claims, Philly Fed Mfg
by Calculated Risk on 6/19/2024 07:52:00 PM
Thursday:
• At 8:30 AM ET, Housing Starts for May. The consensus is for 1.380 million SAAR, up from 1.360 million SAAR in April.
• Also, at 8:30 AM, The initial weekly unemployment claims report will be released. The consensus is for 240 thousand initial claims, down from 242 thousand last week.
• Also, at 8:30 AM, the Philly Fed manufacturing survey for June. The consensus is for a reading of 4.5, unchanged from 4.5 last month.
The Art of the Soft Landing
by Calculated Risk on 6/19/2024 01:51:00 PM
Yesterday, Goldman Sachs Chief Economist Jan Hatzius wrote:
Last week's benign US inflation data reinforced our view that the Q1 spike was an aberration. Meanwhile, the labor market stands at a potential inflection point where a further softening in labor demand would hit actual jobs, not just open positions, and could therefore push up the unemployment rate more significantly. We thus continue to expect two Fed rate cuts this year (in September and December) ...
emphasis added
The "Art of the Soft Landing" requires that the Fed reduce rates quick enough to keep economic growth positive, and slow enough not to reignite inflation. My view is a soft landing is achieved if growth stays positive, inflation returns to target, and the yield curve flattens or reverts to normal (long yields higher than short yields).
The good news is growth has stayed positive and inflation has moved closer to the 2% target. However, the yield curve is still inverted, and we are not out of the woods yet.
 Here is a graph of 10-Year Treasury Constant Maturity Minus 2-Year Treasury Constant Maturity from FRED since 1976.
 If Hatzius is correct that the reported pickup in Q1 inflation was an "aberration", it seems like the FOMC will cut rates soon (probably September).
Most market participants expect 2 rate cuts this year, with the first cut in September.
NAHB: Builder Confidence Declined in June
by Calculated Risk on 6/19/2024 10:00:00 AM
The National Association of Home Builders (NAHB) reported the housing market index (HMI) was at 43, down from 45 last month. Any number below 50 indicates that more builders view sales conditions as poor than good.
From the NAHB: High Mortgage Rates Act as a Drag on Builder Confidence
Mortgage rates that continue to hover in the 7% range along with elevated construction financing costs continue to put a damper on builder sentiment.
Builder confidence in the market for newly built single-family homes was 43 in June, down two points from May, according to the National Association of Home Builders (NAHB)/Wells Fargo Housing Market Index (HMI) released today. This is the lowest reading since December 2023.
“Persistently high mortgage rates are keeping many prospective buyers on the sidelines,” said NAHB Chairman Carl Harris, a custom home builder from Wichita, Kan. “Home builders are also dealing with higher rates for construction and development loans, chronic labor shortages and a dearth of buildable lots.”
“We are in an unusual situation because a lack of progress on reducing shelter inflation, which is currently running at a 5.4% year-over-year rate, is making it difficult for the Federal Reserve to achieve its target inflation rate of 2%,” said NAHB Chief Economist Robert Dietz. “The best way to bring down shelter inflation and push the overall inflation rate down to the 2% range is to increase the nation’s housing supply. A more favorable interest rate environment for construction and development loans would help to achieve this aim.”
The June HMI survey also revealed that 29% of builders cut home prices to bolster sales in June, the highest share since January 2024 (31%) and well above the May rate of 25%. However, the average price reduction in June held steady at 6% for the 12th straight month. Meanwhile, the use of sales incentives ticked up to 61% in June from a reading of 59% in May. This metric is at its highest share since January 2024 (62%).
...
All three HMI component indices posted declines in June and all are below the key threshold of 50 for the first time since December 2023. The HMI index charting current sales conditions in June fell three points to 48, the component measuring sales expectations in the next six months fell four points to 47 and the gauge charting traffic of prospective buyers declined two points to 28.
Looking at the three-month moving averages for regional HMI scores, the Northeast held steady at 62, the Midwest dropped three points to 47, the South decreased three points to 46 and the West posted a two-point decline to 41.
emphasis added
 Click on graph for larger image.
This graph shows the NAHB index since Jan 1985.
This was below the consensus forecast.
MBA: Mortgage Applications Increased in Weekly Survey
by Calculated Risk on 6/19/2024 07:00:00 AM
From the MBA: Mortgage Applications Increase in Latest MBA Weekly Survey
Mortgage applications increased 0.9 percent from one week earlier, according to data from the Mortgage Bankers Association’s (MBA) Weekly Applications Survey for the week ending June 14, 2024.
The Market Composite Index, a measure of mortgage loan application volume, increased 0.9 percent on a seasonally adjusted basis from one week earlier. On an unadjusted basis, the Index decreased 0.1 percent compared with the previous week. The Refinance Index decreased 0.4 percent from the previous week and was 30 percent higher than the same week one year ago. The seasonally adjusted Purchase Index increased 2 percent from one week earlier. The unadjusted Purchase Index decreased 0.1 percent compared with the previous week and was 12 percent lower than the same week one year ago.
“Mortgage rates dropped last week following the latest inflation data and the FOMC meeting, with the 30- year conforming rate dropping to 6.94 percent and reaching its lowest level since the end of March,” said Mike Fratantoni, MBA’s SVP and Chief Economist. “Purchase applications increased a small amount for the week, led by applications for conventional loans. Refinance application volume was also down slightly for the week but remains about 30 percent higher than this time last year.”
Added Fratantoni, “Purchase volume is still more than 10 percent behind last year’s pace, but MBA is forecasting a pickup in home sales for the remainder of the year as more inventory is hitting the market.”
...
The average contract interest rate for 30-year fixed-rate mortgages with conforming loan balances ($766,550 or less) decreased to 6.94 percent from 7.02 percent, with points decreasing to 0.61 from 0.65 (including the origination fee) for 80 percent loan-to-value ratio (LTV) loans.
emphasis added
 Click on graph for larger image.
The first graph shows the MBA mortgage purchase index.
According to the MBA, purchase activity is down 12% year-over-year unadjusted.
Red is a four-week average (blue is weekly).
Purchase application activity is up slightly from the lows in late October 2023, and below the lowest levels during the housing bust.

The second graph shows the refinance index since 1990.
With higher mortgage rates, the refinance index declined sharply in 2022, and mostly flat lined since then with a slight increase recently.
Tuesday, June 18, 2024
Wednesday: Markets Closed, Homebuilder Survey
by Calculated Risk on 6/18/2024 07:27:00 PM
 Note: Mortgage rates are from MortgageNewsDaily.com and are for top tier scenarios.
Wednesday:
• All US markets will be closed in observance of Juneteenth National Independence Day
• At 7:00 AM ET, The Mortgage Bankers Association (MBA) will release the results for the mortgage purchase applications index.
• At 10:00 AM, The June NAHB homebuilder survey. The consensus is for a reading of 46, up from 45 last month. Any number above 50 indicates that more builders view sales conditions as poor than good.
Lawler: Early Read on Existing Home Sales in May
by Calculated Risk on 6/18/2024 04:26:00 PM
Today, in the Calculated Risk Real Estate Newsletter: Lawler: Early Read on Existing Home Sales in May
A brief excerpt:
From housing economist Tom Lawler:There is more in the article.
Based on publicly-available local realtor/MLS reports released across the country through today, I project that existing home sales as estimated by the National Association of Realtors ran at a seasonally adjusted annual rate of 4.13 million in May, down 0.2% from April’s preliminary pace and down 2.4% from last May’s seasonally adjusted pace.
4th Look at Local Housing Markets in May; California Home Sales Down 6% YoY in May
by Calculated Risk on 6/18/2024 01:28:00 PM
Today, in the Calculated Risk Real Estate Newsletter: 4th Look at Local Housing Markets in May; California Home Sales Down 6% YoY in May
A brief excerpt:
The National Association of Realtors (NAR) is scheduled to release May Existing Home Sales on Friday June 21st at 10 AM ET. The early consensus is for 4.10 million SAAR, down from 4.14 million in April, and down from 4.23 million in May 2023.There is much more in the article.
...
In May, sales in these markets were down 0.8% YoY. Last month, in April, these same markets were up 7.1% year-over-year Not Seasonally Adjusted (NSA). However, there were two more working days in April 2024 than in April 2023, so seasonally adjusted, sales were down YoY last month.
Sales in all of these markets are down compared to May 2019.
...
This is a small year-over-year decrease NSA for these markets. There were the same number of working days in May 2024 compared to May 2023, so the year-over-year change in the seasonally adjusted sales will be about the same as the NSA data suggests.
...
More local markets to come!


