 RSS Feed
 by Calculated Risk on 5/24/2024 08:12:00 AM
Friday, May 24, 2024
May Vehicle Sales Forecast: 15.8 million SAAR, Up 2% YoY
From WardsAuto: May U.S. Light-Vehicle Sales Tracking to Annualized Rate Flat with April (pay content). Brief excerpt:
There is a good possibility sales end May above expectations, depending on much holiday marketing pulls in additional buyers. Second-quarter sales are pegged at a 15.9 million-unit SAAR, with volume rising 1% from the year-ago period.
emphasis added
 Click on graph for larger image.
This graph shows actual sales from the BEA (Blue), and Wards forecast for May (Red).
On a seasonally adjusted annual rate basis, the Wards forecast of 15.8 million SAAR, would be up 0.4% from last month, and up 1.8% from a year ago.
Thursday, May 23, 2024
Friday: Durable Goods
by Calculated Risk on 5/23/2024 07:09:00 PM
 Note: Mortgage rates are from MortgageNewsDaily.com and are for top tier scenarios.
Friday:
• At 8:30 AM ET, Durable Goods Orders for April from the Census Bureau. The consensus is for a 0.6% decrease in durable goods orders.
• At 10:00 AM, University of Michigan's Consumer sentiment index (Final for May). The consensus is for a reading of 67.4.
Realtor.com Reports Active Inventory Up 35.5% YoY; Most Homes For Sale Since July 2020
by Calculated Risk on 5/23/2024 04:15:00 PM
What this means: On a weekly basis, Realtor.com reports the year-over-year change in active inventory and new listings. On a monthly basis, they report total inventory. For April, Realtor.com reported inventory was up 30.4% YoY, but still down almost 36% compared to April 2017 to 2019 levels.
Now - on a weekly basis - inventory is up 35.5% YoY.
Realtor.com has monthly and weekly data on the existing home market. Here is their weekly report: Weekly Housing Trends View—Data for Week Ending May 18, 2024 Here is a graph of the year-over-year change in inventory according to realtor.com.
Inventory was up year-over-year for the 28th consecutive week.
Realtor.com has monthly and weekly data on the existing home market. Here is their weekly report: Weekly Housing Trends View—Data for Week Ending May 18, 2024
• Active inventory increased, with for-sale homes 35.5% above year-ago levels
For the 28th straight week, there were more homes listed for sale versus the prior year, giving homebuyers more options.
This past week, the inventory of homes for sale grew by 35.5% compared with last year, and it was the highest since July 2020 in the early days of the COVID-19 Pandemic. This growth in inventory is primarily driven by housing markets in the South, which saw a 43.0% year-over-year increase in inventory in April.
• New listings–a measure of sellers putting homes up for sale–were up this week, by 8.1% from one year ago.
Seller activity continued to climb annually last week and accelerated relative to the previous week’s growth. Newly listed homes grew by 8.1% compared with a year ago, an acceleration from the 6.6% growth rate in the previous week.
 Here is a graph of the year-over-year change in inventory according to realtor.com.
 Inventory was up year-over-year for the 28th consecutive week.
However, inventory is still historically very low.
New listings remain below typical pre-pandemic levels although up year-over-year.
New Home Sales Decrease to 634,000 Annual Rate in April
by Calculated Risk on 5/23/2024 01:55:00 PM
Today, in the Calculated Risk Real Estate Newsletter: New Home Sales Decrease to 634,000 Annual Rate in April
Brief excerpt:
Note: there were some seasonal revisions back to 2019, and significant changes to house prices and price distribution in this release.There is much more in the article.
The Census Bureau reports New Home Sales in April were at a seasonally adjusted annual rate (SAAR) of 634 thousand. The previous three months were revised down.
...
The next graph shows new home sales for 2023 and 2024 by month (Seasonally Adjusted Annual Rate). Sales in April 2024 were down 6.6% from April 2023.

New Home Sales Decrease to 634,000 Annual Rate in April
by Calculated Risk on 5/23/2024 10:00:00 AM
The Census Bureau reports New Home Sales in April were at a seasonally adjusted annual rate (SAAR) of 634 thousand.
The previous three months were revised down.
Sales of new single‐family houses in April 2024 were at a seasonally adjusted annual rate of 634,000, according to estimates released jointly today by the U.S. Census Bureau and the Department of Housing and Urban Development. This is 4.7 percent below the revised March rate of 665,000 and is 7.7 percent below the April 2023 estimate of 687,000.
emphasis added
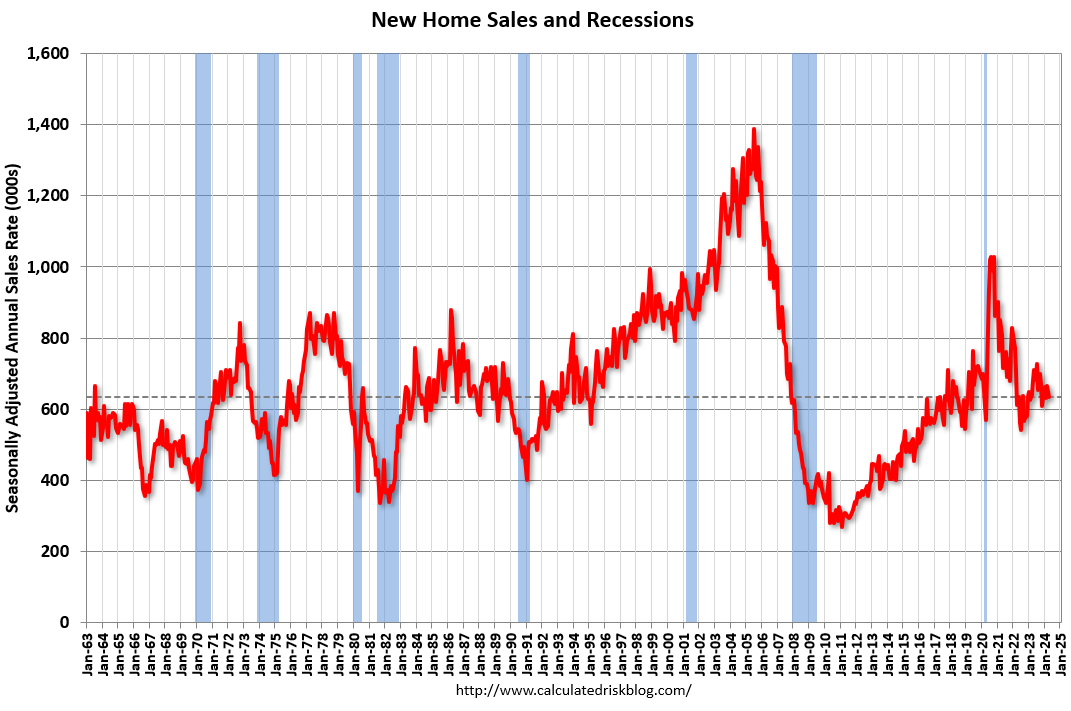 Click on graph for larger image.
The first graph shows New Home Sales vs. recessions since 1963. The dashed line is the current sales rate.
New home sales were close to pre-pandemic levels.
The second graph shows New Home Months of Supply.
 The months of supply increased in April to 9.1 months from 8.5 months in March.
 The all-time record high was 12.2 months of supply in January 2009. The all-time record low was 3.3 months in August 2020.
This is well above the top of the normal range (about 4 to 6 months of supply is normal).
"The seasonally‐adjusted estimate of new houses for sale at the end of April was 480,000. This represents a supply of 9.1 months at the current sales rate."Sales were well below expectations of 680 thousand SAAR, and sales for the three previous months were revised down. I'll have more later today.
Weekly Initial Unemployment Claims Decrease to 215,000
by Calculated Risk on 5/23/2024 08:30:00 AM
The DOL reported:
In the week ending May 18, the advance figure for seasonally adjusted initial claims was 215,000, a decrease of 8,000 from the previous week's revised level. The previous week's level was revised up by 1,000 from 222,000 to 223,000. The 4-week moving average was 219,750, an increase of 1,750 from the previous week's revised average. The previous week's average was revised up by 250 from 217,750 to 218,000.The following graph shows the 4-week moving average of weekly claims since 1971.
emphasis added
 Click on graph for larger image.
The dashed line on the graph is the current 4-week average. The four-week average of weekly unemployment claims increased to 219,750.
The previous week was revised up.
Weekly claims were lower than the consensus forecast.
Wednesday, May 22, 2024
Thursday: New Home Sales, Unemployment Claims
by Calculated Risk on 5/22/2024 07:51:00 PM
 Note: Mortgage rates are from MortgageNewsDaily.com and are for top tier scenarios.
Thursday:
• At 8:30 AM ET, The initial weekly unemployment claims report will be released. The consensus is for 220 thousand initial claims, down from 222 thousand last week.
• Also at 8:30 AM, Chicago Fed National Activity Index for April. This is a composite index of other data.
• At 10:00 AM, New Home Sales for April from the Census Bureau. The consensus is for 680 thousand SAAR, down from 693 thousand SAAR in March.
• At 11:00 AM, the Kansas City Fed manufacturing survey for May.
AIA: Architecture Billings Decline in April; Multi-family Billings Decline for 21st Consecutive Month
by Calculated Risk on 5/22/2024 03:48:00 PM
Note: This index is a leading indicator primarily for new Commercial Real Estate (CRE) investment.
From the AIA: ABI April 2024: Pace of billings decline at architecture firms slows slightly
While the AIA/Deltek Architecture Billings Index (ABI) score for the month rose from 43.6 in March to 48.3 in April, it indicates that billings continued to decline at the majority of firms (a score below 50 indicates declining billings). Inquiries into new projects continued to increase, as there remains interest in starting new projects. However, the value of newly signed design contracts dipped slightly in April, as clients remain hesitant to commit to new work. Firms had hoped that the Federal Reserve would start lowering interest rates this spring and that would open new work, but with that decrease now likely on hold until late summer or early fall, firms may have some more slow months ahead of them.• Northeast (56.9); Midwest (44.2); South (44.6); West (47.8)
Architecture firm billings continued to decline at firms in all regions of the country in April as well, with firms located in the Midwest and South reporting the largest declines. The current longest duration of decline is found at firms located in the West, where billings have now declined for the last 19 consecutive months. Business conditions also remain soft at firms of all specializations, with the weakest conditions continuing at firms with a multifamily residential specialization, followed by those with an institutional specialization, and then those with a commercial/industrial specialization.
...
The ABI score is a leading economic indicator of construction activity, providing an approximately nine-to-twelve-month glimpse into the future of nonresidential construction spending activity. The score is derived from a monthly survey of architecture firms that measures the change in the number of services provided to clients.
emphasis added
• Sector index breakdown: commercial/industrial (47.4); institutional (46.1); multifamily residential (45.6)
 Click on graph for larger image.
This graph shows the Architecture Billings Index since 1996. The index was at 48.3 in April, up from 43.6 in March. Anything below 50 indicates a decrease in demand for architects' services.
Note: This includes commercial and industrial facilities like hotels and office buildings, multi-family residential, as well as schools, hospitals and other institutions.
This index usually leads CRE investment by 9 to 12 months, so this index suggests a slowdown in CRE investment in 2024.
Note that multi-family billing turned down in August 2022 and has been negative for twenty one consecutive months (with revisions). This suggests we will see a further weakness in multi-family starts.
FOMC Minutes: "Recent increases in inflation had been relatively broad based"
by Calculated Risk on 5/22/2024 02:00:00 PM
From the Fed: Minutes of the Federal Open Market Committee, April 30–May 1, 2024. Excerpt:
Participants observed that while inflation had eased over the past year, in recent months there had been a lack of further progress toward the Committee's 2 percent objective. The recent monthly data had showed significant increases in components of both goods and services price inflation. In particular, inflation for core services excluding housing had moved up in the first quarter compared with the fourth quarter of last year, and prices of core goods posted their first three-month increase in several months. In addition, housing services inflation had slowed less than had been anticipated based on the smaller increases in measures of market rents over the past year. A few participants remarked that unusually large seasonal patterns could have contributed to January's large increase in PCE inflation, and several participants noted that some components that typically display volatile price changes had boosted recent readings. However, some participants emphasized that the recent increases in inflation had been relatively broad based and therefore should not be overly discounted.
Participants generally commented that they remained highly attentive to inflation risks. They also remained concerned that elevated inflation continued to harm the purchasing power of households, especially those least able to meet the higher costs of essentials like food, housing, and transportation.
Participants noted that they continued to expect that inflation would return to 2 percent over the medium term. However, recent data had not increased their confidence in progress toward 2 percent and, accordingly, had suggested that the disinflation process would likely take longer than previously thought.
emphasis added
NAR: Existing-Home Sales Decreased to 4.14 million SAAR in April; Median House Prices Increased 5.7% Year-over-Year
by Calculated Risk on 5/22/2024 01:13:00 PM
Today, in the CalculatedRisk Real Estate Newsletter: NAR: Existing-Home Sales Decreased to 4.14 million SAAR in April
Excerpt:
Sales Year-over-Year and Not Seasonally Adjusted (NSA)There is much more in the article.
The fourth graph shows existing home sales by month for 2023 and 2024.
Sales declined 1.9% year-over-year compared to March 2023. This was the thirty-second consecutive month with sales down year-over-year.

NAR: Existing-Home Sales Decreased to 4.14 million SAAR in April
by Calculated Risk on 5/22/2024 10:00:00 AM
From the NAR: Existing-Home Sales Retreated 1.9% in April
Existing-home sales receded in April, according to the National Association of REALTORS®. All four major U.S. regions posted month-over-month declines. Year-over-year, sales decreased in the Northeast, Midwest and South but increased in the West.
Total existing-home sales – completed transactions that include single-family homes, townhomes, condominiums and co-ops – slid 1.9% from March to a seasonally adjusted annual rate of 4.14 million in April. Year-over-year, sales fell 1.9% (down from 4.22 million in April 2023).
...
Total housing inventory registered at the end of April was 1.21 million units, up 9% from March and 16.3% from one year ago (1.04 million). Unsold inventory sits at a 3.5-month supply at the current sales pace, up from 3.2 months in March and 3.0 months in April 2023.
emphasis added
 Click on graph for larger image.
This graph shows existing home sales, on a Seasonally Adjusted Annual Rate (SAAR) basis since 1994.
Sales in April (4.14 million SAAR) were down 1.9% from the previous month and were 1.9% below the April 2023 sales rate.
The second graph shows nationwide inventory for existing homes.
 According to the NAR, inventory increased to 1.21 million in April from 1.11 million the previous month.
 According to the NAR, inventory increased to 1.21 million in April from 1.11 million the previous month.
Headline inventory is not seasonally adjusted, and inventory usually decreases to the seasonal lows in December and January, and peaks in mid-to-late summer.
The last graph shows the year-over-year (YoY) change in reported existing home inventory and months-of-supply. Since inventory is not seasonally adjusted, it really helps to look at the YoY change. Note: Months-of-supply is based on the seasonally adjusted sales and not seasonally adjusted inventory.
 Inventory was up 16.3% year-over-year (blue) in April compared to April 2023.
Months of supply (red) increased to 3.5 months in April from 3.2 months the previous month.
This was below the consensus forecast. I'll have more later.
The last graph shows the year-over-year (YoY) change in reported existing home inventory and months-of-supply. Since inventory is not seasonally adjusted, it really helps to look at the YoY change. Note: Months-of-supply is based on the seasonally adjusted sales and not seasonally adjusted inventory.
 Inventory was up 16.3% year-over-year (blue) in April compared to April 2023.
 Months of supply (red) increased to 3.5 months in April from 3.2 months the previous month.
This was below the consensus forecast. I'll have more later.
MBA: Mortgage Applications Increased in Weekly Survey
by Calculated Risk on 5/22/2024 07:00:00 AM
From the MBA: Mortgage Applications Increase in Latest MBA Weekly Survey
Mortgage applications increased 1.9 percent from one week earlier, according to data from the Mortgage Bankers Association’s (MBA) Weekly Mortgage Applications Survey for the week ending May 17, 2024.
The Market Composite Index, a measure of mortgage loan application volume, increased 1.9 percent on a seasonally adjusted basis from one week earlier. On an unadjusted basis, the Index increased 1.1 percent compared with the previous week. The Refinance Index increased 7 percent from the previous week and was 21 percent higher than the same week one year ago. The seasonally adjusted Purchase Index decreased 1 percent from one week earlier. The unadjusted Purchase Index decreased 2 percent compared with the previous week and was 11 percent lower than the same week one year ago.
“The 30-year fixed mortgage rate declined for the third straight week, dropping to 7.01 percent – the lowest level in seven weeks,” said Joel Kan, MBA’s Vice President and Deputy Chief Economist. “Rates coming down from recent highs spurred some borrowers to act, with increases across both conventional and government refinance applications. VA refinances had a double-digit increase for the third consecutive week, although the current level of refinancing is still well below its historical average. Purchase activity continues to lag despite this recent decline in rates, down 11 percent from a year ago, as potential buyers still face limited for-sale inventory and high list prices.”
...
The average contract interest rate for 30-year fixed-rate mortgages with conforming loan balances ($766,550 or less) decreased to 7.01 percent from 7.08 percent, with points decreasing to 0.60 from 0.63 (including the origination fee) for 80 percent loan-to-value ratio (LTV) loans.
emphasis added
 Click on graph for larger image.
The first graph shows the MBA mortgage purchase index.
According to the MBA, purchase activity is down 11% year-over-year unadjusted.
Red is a four-week average (blue is weekly).
Purchase application activity is up slightly from the lows in late October 2023, and below the lowest levels during the housing bust.

The second graph shows the refinance index since 1990.
With higher mortgage rates, the refinance index declined sharply in 2022, and mostly flat lined since then with a slight increase recently.
Tuesday, May 21, 2024
Wednesday: Existing Home Sales, FOMC Minutes, Architecture Billings Index
by Calculated Risk on 5/21/2024 07:22:00 PM
 Note: Mortgage rates are from MortgageNewsDaily.com and are for top tier scenarios.
Wednesday:
• At 7:00 AM ET, The Mortgage Bankers Association (MBA) will release the results for the mortgage purchase applications index.
• At 10:00 AM, Existing Home Sales for April from the National Association of Realtors (NAR). The consensus is for 4.18 million SAAR, down from 4.19 million. Housing economist Tom Lawler expects the NAR to report sales of 4.23 million SAAR.
• During the day, The AIA's Architecture Billings Index for April (a leading indicator for commercial real estate).
• At 2:00 PM, FOMC Minutes, Minutes Meeting of April 30-May 1, 2024
LA Port Traffic Increased Year-over-year in April
by Calculated Risk on 5/21/2024 01:00:00 PM
Container traffic gives us an idea about the volume of goods being exported and imported - and usually some hints about the trade report since LA area ports handle about 40% of the nation's container port traffic.
The following graphs are for inbound and outbound traffic at the ports of Los Angeles and Long Beach in TEUs (TEUs: 20-foot equivalent units or 20-foot-long cargo container).
To remove the strong seasonal component for inbound traffic, the first graph shows the rolling 12-month average.
 Click on graph for larger image.
On a rolling 12-month basis, inbound traffic increased 1.4% in April compared to the rolling 12 months ending in March. Outbound traffic increased 0.8% compared to the rolling 12 months ending the previous month.
The 2nd graph is the monthly data (with a strong seasonal pattern for imports).
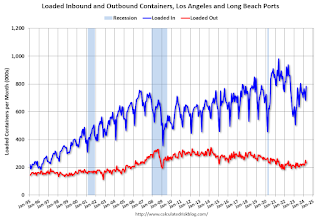 Usually imports peak in the July to October period as retailers import goods for the Christmas holiday, and then decline sharply and bottom in the Winter depending on the timing of the Chinese New Year.
 Usually imports peak in the July to October period as retailers import goods for the Christmas holiday, and then decline sharply and bottom in the Winter depending on the timing of the Chinese New Year.
 Imports were up 16% YoY in April, and exports were up 10% YoY.
In general, it appears port traffic is returning to the pre-pandemic patterns.
Single Family Built-for-Rent Up 20% Year-over-year in Q1
by Calculated Risk on 5/21/2024 09:45:00 AM
Today, in the Calculated Risk Real Estate Newsletter: Single Family Built-for-Rent Up 20% Year-over-year in Q1
A brief excerpt:
Along with the monthly housing starts report for April released last week, the Census Bureau also released Housing Units Started by Purpose and Design through Q1 2024.There is much more in the article.
The first graph shows the number of single family and multi-family units started with the intent to rent. This data is quarterly and Not Seasonally Adjusted (NSA). Although the majority of units built-for-rent’ are still multi-family (blue), there has been a significant pickup in single family units started built-for-rent (red).
In 2020, there were 44,000 single family units started with the intent to rent. In 2023, that number almost doubled to 85,000 units. There were 18,000 single family units started in Q1 2024 built-for-rent, up 20% from 15,000 in Q1 2023.
For multi-family, there were 56,000 units started to rent in Q1 2024, down almost 50% from 108,000 in Q1 2023.

What Happened to "Paying off the National Debt"?
by Calculated Risk on 5/21/2024 08:20:00 AM
We are seeing scary articles about the debt again. It is worth remembering that at the turn of the millennium, the concern was that the US was paying off the debt too quickly!
Here are a few excerpts from a speech by then Fed Chair Alan Greenspan in April 2001: The paydown of federal debt
"Today I want to address a subject in which your group and the Federal Reserve share a keen interest--the paydown of the federal debt and its implications for the economy and financial markets. While the magnitudes of future federal unified budget surpluses are uncertain, they are highly likely to remain sizable for some time. ...What went wrong over the last 20+ years?
[C]urrent forecasts suggest that under a reasonably wide variety of possible tax and spending policies, the resulting surpluses will allow the Treasury debt held by the public to be paid off. Moreover, well before the debt is eliminated--indeed, possibly within a relatively few years--it may become difficult to further reduce outstanding debt to the public because the remaining obligations will mostly consist of savings bonds, well-entrenched holdings of long-term marketable debt, and perhaps other types of debt that could prove difficult to reduce."
Here is a list of events and policy choices that significantly increased the debt after 2000:
1) The 2000 projections were overly optimistic.
2) The 2001 recession.
3) The 2001 and 2003 Bush Tax Cuts.
4) 9/11, Homeland Security Spending and the War in Afghanistan
5) The War in Iraq
6) The Finacial Crisis and Great Recession
7) The Trump Tax Cuts
8) The Pandemic.
Here is a brief discussion ... (books have been written on each of these topics):
1) Overly Optimistic Projections: Here are the CBO projections from July 2000: The Budget and Economic Outlook: An Update
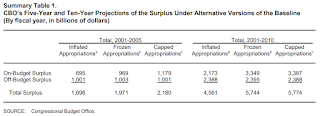 Click on graph for larger image.
The CBO projections showed an almost $6 Trillion in debt reduction in the 2001 through 2010 period.
I argued in 2000 that these projections ignored possible negative events such as an investment led recession due to the bursting of stock bubble. These projections were clearly overly optimistic.
2) The 2001 Recession: Although Greenspan mentioned "the current slowdown in economic activity" in his April 2001 speech, he didn't realize the economy was already in a recession. From the May 2000 FOMC minutes:
3) Bush Tax Cuts: These tax cuts were sold as slowing the growth of the surpluses (using Greenspan's speech for cover)! Instead, the tax cuts (mostly for the wealthy) turned the surpluses into deficits and reduced revenue by $1.5 trillion or more over the 2001 - 2010 period.
 There were various Inspector General reports that the Fed and FDIC field examiners were expressing significant concerns in 2003 and 2004, but Greenspan was blocking all efforts to tighten standards - and the Bush Administratio was loosening bank regulations!
This photo shows John Reich (then Vice Chairman of the FDIC and later at the OTS) and James Gilleran of the Office of Thrift Supervision (with the chainsaw) and representatives of three banker trade associations: James McLaughlin of the American Bankers Association, Harry Doherty of America's Community Bankers, and Ken Guenther of the Independent Community Bankers of America.
1) Overly Optimistic Projections: Here are the CBO projections from July 2000: The Budget and Economic Outlook: An Update
 Click on graph for larger image.
The CBO projections showed an almost $6 Trillion in debt reduction in the 2001 through 2010 period.
I argued in 2000 that these projections ignored possible negative events such as an investment led recession due to the bursting of stock bubble. These projections were clearly overly optimistic.
2) The 2001 Recession: Although Greenspan mentioned "the current slowdown in economic activity" in his April 2001 speech, he didn't realize the economy was already in a recession. From the May 2000 FOMC minutes:
"The information reviewed at this meeting suggested that economic growth had remained rapid through early spring."The economy was already in a recession!
3) Bush Tax Cuts: These tax cuts were sold as slowing the growth of the surpluses (using Greenspan's speech for cover)! Instead, the tax cuts (mostly for the wealthy) turned the surpluses into deficits and reduced revenue by $1.5 trillion or more over the 2001 - 2010 period.
4) 9/11, Homeland Security Spending and the War in Afghanistan: The 9/11/2001 attacks led to a sharp increase in homeland security spending and the War in Afghanistan.
5) The War in Iraq: The Bush administration argued the war would cost around $80 billion. VP Dick Cheney said on Meet the Press: "every analysis said this war itself would cost about $80 billion". Instead, the war cost well over $1 trillion (and countless lives were lost). Note: Years ago, I mentioned on this blog that "I opposed the Iraq war and was shouted down and called names like "Saddam lover" for questioning the veracity of the information."
6) The Financial Crisis and Great Recession. This was the worst US recession since the Great Depression. This led to the first $1 trillion annual budget deficit in US history and dramatically increased the national debt. The causes of the bubble were rapid changes in the mortgage lending industry, rating agencies that didn't account for those changes, combined with a lack of regulatory oversight. I was talking with field regulators in 2005 and 2006, and they were all terrified. I was told the appointees at the top of the agencies were blocking any effort to tighten standards.
 There were various Inspector General reports that the Fed and FDIC field examiners were expressing significant concerns in 2003 and 2004, but Greenspan was blocking all efforts to tighten standards - and the Bush Administratio was loosening bank regulations!
This photo shows John Reich (then Vice Chairman of the FDIC and later at the OTS) and James Gilleran of the Office of Thrift Supervision (with the chainsaw) and representatives of three banker trade associations: James McLaughlin of the American Bankers Association, Harry Doherty of America's Community Bankers, and Ken Guenther of the Independent Community Bankers of America.
7) The Trump Tax Cuts: These tax cuts - mostly for the wealthy - were sold with several promises - all failed. See: The Failed Promises of the 2017 Tax Cuts and Jobs Act (TCJA). A couple of quotes:
8) The Pandemic: Deficit spending increased sharply due to the pandemic.
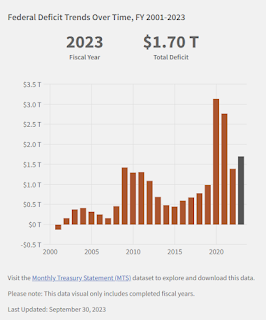 Here is a graph of the actual annual deficits since 2000.
Note: This is not adjusted for the growth of the economy.
So, what happened to "paying off the debt"? A series of adverse events (9/11, pandemic), and poor policy choices.
Note that all the "poor policy choices" were by Republicans including tax cuts, the Iraq War, and failure to properly regulate prior to the great recession.
“Not only will this tax plan pay for itself, but it will pay down debt,” Treasury Secretary Steve Mnuchin, Sept 2017Complete nonsense.
“I think this tax bill is going to reduce the size of our deficits going forward,” Sen. Pat Toomey (R-PA), November 2017
8) The Pandemic: Deficit spending increased sharply due to the pandemic.
 Here is a graph of the actual annual deficits since 2000.
Note: This is not adjusted for the growth of the economy.
So, what happened to "paying off the debt"? A series of adverse events (9/11, pandemic), and poor policy choices.
Note that all the "poor policy choices" were by Republicans including tax cuts, the Iraq War, and failure to properly regulate prior to the great recession.
We cannot always avoid adverse events like 9/11 and the pandemic, but I opposed each of these poor policy choices as they happened - so these are clearly avoidable.
Those scary stories? They seem to ignore history.
Monday, May 20, 2024
"Mortgage Rates Close Enough to Unchanged Over The Weekend"
by Calculated Risk on 5/20/2024 08:05:00 PM
 From Matthew Graham at Mortgage News Daily: Mortgage Rates Close Enough to Unchanged Over The Weekend
Technically, today's average mortgage rates are higher for a third straight business day, but most prospective borrowers won't even notice. For many lenders, the changes are so small that the average borrower won't see any change from scenarios quoted on Friday afternoon. In cases where there is a difference, that difference would be very small. [30 year fixed 7.10%]Tuesday:
emphasis added
• No major economic releases scheduled.
MBA Survey: Share of Mortgage Loans in Forbearance Remains at 0.22% in April
by Calculated Risk on 5/20/2024 04:17:00 PM
From the MBA: Share of Mortgage Loans in Forbearance Remains at 0.22% in April
he Mortgage Bankers Association’s (MBA) monthly Loan Monitoring Survey revealed that the total number of loans now in forbearance remained unchanged at 0.22% as of April 30, 2024. According to MBA’s estimate, 110,000 homeowners are in forbearance plans. Mortgage servicers have provided forbearance to approximately 8.1 million borrowers since March 2020.At the end of April, there were about 110,000 homeowners in forbearance plans.
In April 2024, the share of Fannie Mae and Freddie Mac loans in forbearance declined 1 basis point to 0.11%. Ginnie Mae loans in forbearance dropped 1 basis point to 0.39%, and the forbearance share for portfolio loans and private-label securities (PLS) stayed the same at 0.31%.
“The number of loans in forbearance has remained stagnant for the first four months of 2024,” said Marina Walsh, CMB, MBA’s Vice President of Industry Analysis. “While forbearance is still a viable option for homeowners needing temporary mortgage payment relief, its usage has diminished without a major natural disaster or labor market downturn. Moreover, the performance of servicing portfolios and post-forbearance workouts remains strong, despite some fluctuations from month-to-month.”
emphasis added
4th Look at Local Housing Markets in April; California Home Sales Up 4.4% YoY in April
by Calculated Risk on 5/20/2024 12:00:00 PM
Today, in the Calculated Risk Real Estate Newsletter: 4th Look at Local Housing Markets in April; California Home Sales Up 4.4% YoY in April
A brief excerpt:
The NAR is scheduled to release April existing home sales on Wednesday, May 22nd. The consensus is for 4.18 million SAAR, down from 4.19 million in March.There is much more in the article.
Housing economist Tom Lawler expects the NAR to report sales of 4.23 million SAAR for April.
The NAR reported sales of 4.22 million SAAR in April 2023. If sales increased YoY in April, this will be the first YoY increase since August 2021, following 31 consecutive months with a YoY decline in sales.
...
And a table of March sales.
In April, sales in these markets were up 7.1% YoY. In March, these same markets were down 9.7% year-over-year Not Seasonally Adjusted (NSA).
Sales in most of these markets are down compared to January 2019. Sales in Grand Rapids and Nashville are up compared to 2019.
This is a year-over-year increase NSA for these markets. However, there were two more working days in April 2024 compared to April 2023, so sales Seasonally Adjusted will be lower year-over-year than Not Seasonally Adjusted sales.
More local markets will release data after the NAR release on Wednesday!

Fed Vice Chair Philip Jefferson on Housing Dynamics
by Calculated Risk on 5/20/2024 10:40:00 AM
From Fed Vice Chair Philip Jefferson: U.S. Economic Outlook and Housing Price Dynamics. An excerpt on housing:
The Housing MarketAs Jefferson notes, rents for existing tenants are still increasing, even while new leases are mostly flat year-over-year. A key point is that Fed policy can not change what happened a year or two ago, and that is why we need to look at inflation ex-housing.
The Fed sets policy to promote its dual-mandate objectives of maximum employment and price stability, and employment and inflation depend on conditions in the entire economy. Still, given our gathering today, I thought it would be appropriate to dive a bit deeper into the housing and home finance markets.
As I said earlier, the housing sector is one of the most interest rate–sensitive parts of the economy. We have seen that sensitivity in mortgage rates and mortgage originations. As shown in figure 4, 30-year fixed-rate mortgage rates were close to 3 percent when the federal funds rate was near the zero lower bound in 2020 and 2021. Rates surged in 2022 as the federal funds rate increased. Consistent with the increase in mortgage rates, mortgage origination volume has fallen significantly.
The current restrictive stance of monetary policy has weighed on the housing market. That is helping to bring supply and demand into better balance and put downward pressure on inflation. One aspect of inflation that has gotten a fair amount of attention is housing and rental costs. This is because housing costs make up such a large share of household budgets. To calculate housing services inflation, government statistics don't use home prices because a home is partly an investment. Instead, housing services inflation is computed using monthly rents that capture what tenants pay to rent a house or apartment and what homeowners would, in theory, pay to rent their own home. The way this calculation is derived means changes in market rents—or what a new tenant pays to rent—take a long time to pass through to PCE housing services prices, as shown in figure 5. In this figure, notice that increases in market rents, the blue and red lines, peaked in 2022, and PCE housing services inflation, the black line, lagged market rents and peaked in 2023.
Lags in Housing Services Inflation
The primary reason for this lag is that market rents adjust more quickly to economic conditions than what landlords charge their existing tenants. This lag suggests that the large increase in market rents during the pandemic is still being passed through to existing rents and may keep housing services inflation elevated for a while longer. This observation is important because it is an example of one of the underlying sources of lags with which monetary policy affects inflation.
Another factor affecting pass-through of restrictive monetary policy is that fixed-rate mortgages are common in the U.S. It is often argued that this loan structure dampens the effect of monetary policy. Figure 6 shows that the 30-year fixed mortgage rate is about 7 percent, while the average outstanding mortgage rate is about 4 percent. This lower outstanding mortgage rate is due to households who locked in rates during lower-interest periods, including when the Fed cut the target range for the federal funds rate to near zero shortly after the pandemic took hold. Fixed-rate mortgages do dampen the effect of monetary policy, but, according to recent research, not as much as previously thought.
There is a delay between when mortgage rates go up and when household mortgage payments go up, as shown in figure 7. Board staff research documents that mortgage payments go up over time because many households continue to refinance their mortgage or move. Despite higher rates, households in the U.S. borrowed over $1.5 trillion in new mortgage loans in 2023. These borrowers include first-time homebuyers, existing homeowners moving between homes, and homeowners obtaining cash-out refinances. The payment they owe on that recently obtained mortgage is higher than it would have been had lower rates been maintained, and their consumption may be correspondingly lower. The cumulative effect of a higher interest rate on aggregate mortgage payments grows over time as more new loans are originated at the higher rate. The staff's research documents that, historically, borrowers like these who are not deterred by higher rates are responsible for a little over half of the pass-through of interest rates to mortgage payments.
Conclusion
In closing, let me reiterate why we care about housing. The housing sector is where many households have made, or will make, their largest investment. Therefore, the prices that families pay for that housing can affect their overall well-being. The work you do to make housing accessible is an important part of the economy. The housing sector is also a key part of the transmission mechanism of monetary policy. That is one reason why policymakers will continue to pay close attention to this vital sector.
emphasis added


