 RSS Feed
 by Calculated Risk on 6/08/2023 04:02:00 PM
Thursday, June 08, 2023
Realtor.com Reports Weekly Active Inventory Up 13% YoY; New Listings Down 25% YoY
Realtor.com has monthly and weekly data on the existing home market. Here is their weekly report from economist Jiayi Xu: Weekly Housing Trends View — Data Week Ending June 3rd, 2023
• ctive inventory growth slowed again, with for-sale homes up just 13% above one year ago. The number of homes for sale continues to grow, but compared to one year ago, the pace is slowing. While today’s shoppers still have many more homes to consider than last year’s shoppers did, worries about high inflation, rising interest rates, and escalating home prices have caused many prospective buyers, especially more first-time buyers, to postpone their plans to purchase a home. This, in turn, has contributed to an increase in the number of homes listed for sale. However, the ongoing decrease in new listings has restrained the growth of active inventory, and there is a possibility of further deceleration in the upcoming weeks.
...
• New listings–a measure of sellers putting homes up for sale–were down again this week, by 25% from one year ago. The number of newly listed homes has been lower than the same time the previous year for the past 48 weeks. The fluctuations in the decline of new listings indicate that sellers are exercising caution in their selling decisions, likely due to being locked into mortgage rates that are significantly lower than the current rates.
 Here is a graph of the year-over-year change in inventory according to realtor.com.
 Inventory is still up year-over-year - from record lows - however, the YoY increase has slowed sharply recently.
This was the smallest YoY increase since June 2022.
The recent trend suggests active inventory could be down YoY in late June!
The "Home ATM" was Closed in Q1; Mortgage Equity Withdrawal (MEW) turns negative in Q1 2023
by Calculated Risk on 6/08/2023 01:26:00 PM
Today, in the Real Estate Newsletter: The "Home ATM" was Closed in Q1
Excerpt:
For Q1 2023, the Net Equity Extraction was minus $30 billion, or -0.60% of Disposable Personal Income (DPI). This is down significantly year-over-year and the first negative reading since Q1 2020. There is a seasonal pattern to MEW, and Q1 is usually the weakest quarter, so it is possible we will see positive MEW this summer.There is much more in the article. You can subscribe at https://calculatedrisk.substack.com/.
During the housing bubble we saw several quarters with MEW above 8% of DPI - that didn’t happen this cycle.
This graph shows the net equity extraction, or mortgage equity withdrawal (MEW), results, using the Flow of Funds (and BEA data) compared to the Kennedy-Greenspan method. MEW was negative for a number of years but has picked up again following the onset of the pandemic.
The bottom line is, the “Home ATM” was closed in Q1 with both refinance activity and HELOC borrowing off sharply.

Fed's Flow of Funds: Household Net Worth Increased $3.0 Trillion in Q1
by Calculated Risk on 6/08/2023 12:16:00 PM
The Federal Reserve released the Q1 2023 Flow of Funds report today: Financial Accounts of the United States.
The net worth of households and nonprofits rose to $148.8 trillion during the first quarter of 2023. The value of directly and indirectly held corporate equities increased $2.4 trillion and the value of real estate decreased $0.6 trillion.
...
Household debt increased 2.2 percent at an annual rate in the first quarter of 2023. Consumer credit grew at an annual rate of 4.3 percent, while mortgage debt (excluding charge-offs) grew at an annual rate of 2.5 percent.
 Click on graph for larger image.
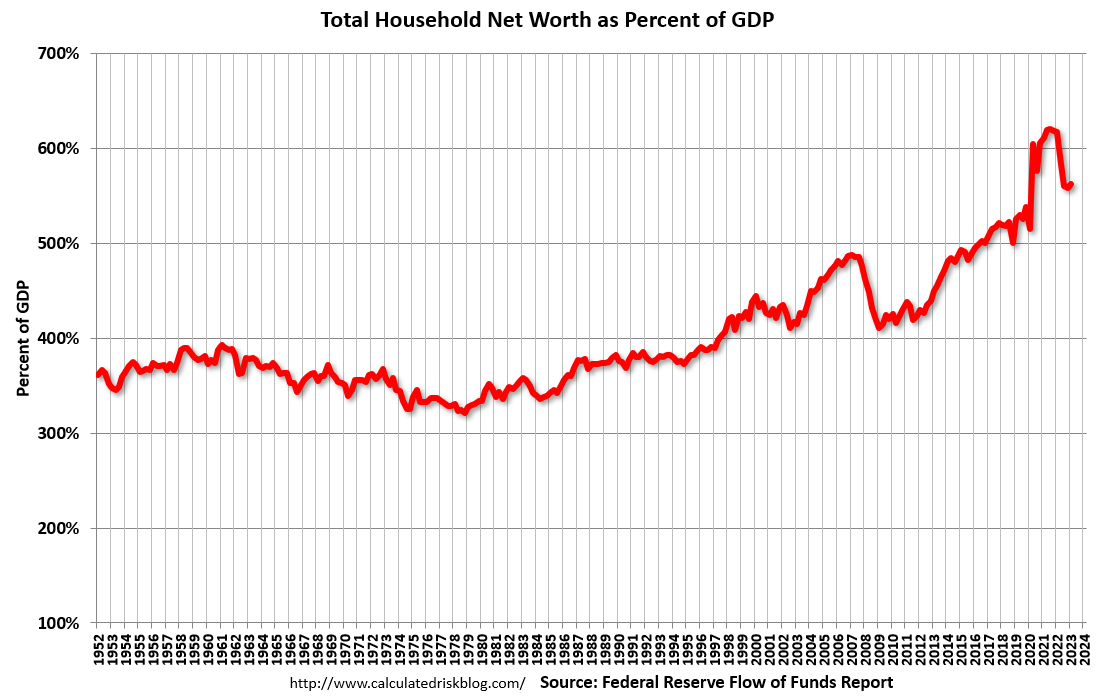
The first graph shows Households and Nonprofit net worth as a percent of GDP.
Net worth is down $3.8 trillion from the all-time high in Q1 2022.
This includes real estate and financial assets (stocks, bonds, pension reserves, deposits, etc) net of liabilities (mostly mortgages). Note that this does NOT include public debt obligations.
 The second graph shows homeowner percent equity since 1952.
Household percent equity (as measured by the Fed) collapsed when house prices fell sharply in 2007 and 2008.
In Q1 2023, household percent equity (of household real estate) was at 69.6% - down from 70.1% in Q4, 2022. This is close to the highest percent equity since the early 1980s.
Note: This includes households with no mortgage debt.
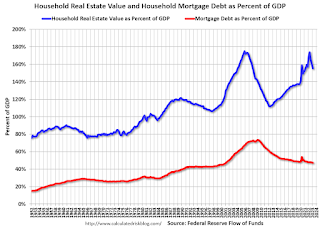 The third graph shows household real estate assets and mortgage debt as a percent of GDP. Note this graph was impacted by the sharp decline in Q2 2020 GDP.
Mortgage debt increased by $45 billion in Q1.
Mortgage debt is up $1.82 trillion from the peak during the housing bubble, but, as a percent of GDP is at 47.3% - down from Q4 - and down from a peak of 73.3% of GDP during the housing bust.
The value of real estate, as a percent of GDP, decreased in Q1 - after peaking in Q2 2022 - and is well above the average of the last 30 years.
 The second graph shows homeowner percent equity since 1952.
 Household percent equity (as measured by the Fed) collapsed when house prices fell sharply in 2007 and 2008.
In Q1 2023, household percent equity (of household real estate) was at 69.6% - down from 70.1% in Q4, 2022. This is close to the highest percent equity since the early 1980s.
Note: This includes households with no mortgage debt.
 The third graph shows household real estate assets and mortgage debt as a percent of GDP. Note this graph was impacted by the sharp decline in Q2 2020 GDP.
Mortgage debt increased by $45 billion in Q1.
Mortgage debt is up $1.82 trillion from the peak during the housing bubble, but, as a percent of GDP is at 47.3% - down from Q4 - and down from a peak of 73.3% of GDP during the housing bust.
The value of real estate, as a percent of GDP, decreased in Q1 - after peaking in Q2 2022 - and is well above the average of the last 30 years.
Weekly Initial Unemployment Claims increased to 261,000
by Calculated Risk on 6/08/2023 08:30:00 AM
The DOL reported:
In the week ending June 3, the advance figure for seasonally adjusted initial claims was 261,000, an increase of 28,000 from the previous week's revised level. This is the highest level for initial claims since October 30, 2021 when it was 264,000. The previous week's level was revised up by 1,000 from 232,000 to 233,000. The 4-week moving average was 237,250, an increase of 7,500 from the previous week's revised average. The previous week's average was revised up by 250 from 229,500 to 229,750.The following graph shows the 4-week moving average of weekly claims since 1971.
emphasis added
 Click on graph for larger image.
The dashed line on the graph is the current 4-week average. The four-week average of weekly unemployment claims was increased to 237,250.
The previous week was revised up.
Weekly claims were well above the consensus forecast.
CoreLogic: 1.2 million Homeowners with Negative Equity in Q1 2023
by Calculated Risk on 6/08/2023 08:00:00 AM
From CoreLogic: CoreLogic: US Home Borrowers See First Annual Home Equity Losses Since 2012 in Q1 2023, but Overall Mortgage Performance Remains Strong
CoreLogic® ... today released the Homeowner Equity Report (HER) for the first quarter of 2023. The report shows that U.S. homeowners with mortgages (which account for roughly 63% of all properties) saw home equity decrease by 0.7% year over year, representing a collective loss of $108.4 billion, and an average loss of $5,400 per borrower since the first quarter of 2022.The above graph is from CoreLogic and compares Q1 2023 to Q4 2022 equity distribution by LTV. There are still a few properties with LTV over 125%. But most homeowners have a significant amount of equity.
In the first quarter of 2023, U.S. homeowners with a mortgage lost a small amount of equity year over year for the first time since early 2012, while national combined equity followed suit. As in the fourth quarter of 2022, Western states posted the largest annual home equity losses: Washington (-$74,300), California (-$59,600) and Utah (-$37,700). The equity losses in those states reflect decelerating home prices, with all three posting annual declines in February and March, according to CoreLogic’s Home Price Index.
Despite these declines, home equity remains solid, with the number of underwater properties unchanged since the fourth quarter of 2022. And although some major metro areas saw equity decline on an annual basis, years of rapid appreciation in places like Los Angeles and San Francisco, which have negative equity shares of 0.9%, is keeping homeowners in these metros in good standing.
“Home equity trends closely follow home price changes,” said CoreLogic Chief Economist Selma Hepp. “As a result, while the average amount of equity declined from a year ago, it increased from the fourth quarter of 2022, as monthly home prices growth accelerated in early 2023.”
“The average U.S. homeowner now has more than $274,000 in equity — up significantly from $182,000 before the pandemic,” Hepp continued. “Also, while homeowners in some areas of the country who bought a property last spring have no equity as a result of price losses, forecasted home price appreciation over the next year should help many borrowers regain some of that lost equity.”
Negative equity, also referred to as underwater or upside-down mortgages, applies to borrowers who owe more on their mortgages than their homes are currently worth. As of the first quarter of 2023, the quarterly and annual changes in negative equity were:
Click on graph for larger image.
• Quarterly change: From the fourth quarter of 2022 to the first quarter of 2023, the total number of mortgaged homes in negative equity was unchanged, remaining at 1.2 million homes or 2.1% of all mortgaged properties.
• Annual change: From the first quarter of 2022 to the first quarter of 2023, the total number of homes in negative equity increased by 4% from 1.1 million homes or 2% of all mortgaged properties.
emphasis added

 This is a very different picture than at the start of the housing bust when many homeowners had little equity.
The second graph is from a 2011 CoreLogic report and shows a large number of homeowners with negative equity - even as house prices were nearing a bottom!
On a year-over-year basis, the number of homeowners with negative equity has increased from 1.1 million to 1.2 million.
On a year-over-year basis, the number of homeowners with negative equity has increased from 1.1 million to 1.2 million.
Wednesday, June 07, 2023
Thursday: Unemployment Claims, Flow of Funds
by Calculated Risk on 6/07/2023 09:01:00 PM
 Note: Mortgage rates are from MortgageNewsDaily.com and are for top tier scenarios.
Thursday:
• At 8:30 AM ET, The initial weekly unemployment claims report will be released. The consensus is for 238 thousand initial claims, up from 232 thousand last week.
• At 12:00 PM, Q1 Flow of Funds Accounts of the United States from the Federal Reserve.
Leading Index for Commercial Real Estate Decreased in May
by Calculated Risk on 6/07/2023 03:13:00 PM
From Dodge Data Analytics: Dodge Momentum Index Slides 2% in May Due to Weaker Commercial Planning
The Dodge Momentum Index (DMI), issued by Dodge Construction Network, fell 2.0% in May to 180.5 (2000=100) from the revised April reading of 184.1. Over the month, the commercial component of the DMI fell 6.1%, while the institutional component improved 5.6%.
“The DMI dipped in May amid sustained weakness in commercial planning activity,” stated Sarah Martin, associate director of forecasting for Dodge Construction Network. “Conversely, institutional planning steadily improved over the month as research and development laboratories and hospital projects steadily entered planning. Sustained elevation in the federal funds rate and tighter lending standards will likely constrain growth in the DMI over the second half of 2023; however the index remains above the historical average. This paints an optimistic landscape for non-residential construction in mid-2024, as the economy recovers and the Fed begins to pull back rates.”
Commercial planning in May was negatively impacted by continued weakness in office and hotel planning activity. Institutional planning accelerated alongside steady growth in education, health and amusement projects. Year over year, the DMI remains 11% higher than in May 2022. The commercial and institutional components were up 7% and 18%, respectively.
...
The DMI is a monthly measure of the initial report for nonresidential building projects in planning, shown to lead construction spending for nonresidential buildings by a full year.
emphasis added
 Click on graph for larger image.
This graph shows the Dodge Momentum Index since 2002. The index was at 180.5 in May, down from 184.1 the previous month.
According to Dodge, this index leads "construction spending for nonresidential buildings by a full year". This index suggests a slowdown towards the end of 2023 or in 2024.
Commercial construction is a lagging economic indicator.
Could 6% to 7% 30-Year Mortgage Rates be the "New Normal"?
by Calculated Risk on 6/07/2023 11:52:00 AM
Today, in the Calculated Risk Real Estate Newsletter: Could 6% to 7% 30-Year Mortgage Rates be the "New Normal"?
A brief excerpt:
A key pitch, by real estate agents for home buyers right now, is that they will likely be able to refinance at a lower mortgage rate in a few years. The argument is that once the Federal Reserve has inflation back down to the 2% target, 30-mortgage rates will decline, perhaps to around 5% or lower. Of course, no one expects to see 3% mortgage rates without another crisis.There is much more in the article. You can subscribe at https://calculatedrisk.substack.com/
This graph is from Mortgage News Daily and shows the 30-year mortgage rate since 2010. Rates were mostly in the 3.5% to 5% range for over a decade prior to the pandemic, but it is possible - without a recession or a crisis - that 6% to 7% mortgage rates could be the new normal.

Wholesale Used Car Prices Decreased in May; Down 7.6% Year-over-year
by Calculated Risk on 6/07/2023 10:05:00 AM
From Manheim Consulting today: Wholesale Used-Vehicle Prices See Continued Declines in May
Wholesale used-vehicle prices (on a mix, mileage, and seasonally adjusted basis) decreased 2.7% in May from April. The Manheim Used Vehicle Value Index (MUVVI) declined to 224.5, down 7.6% from a year ago.
“Price erosion continued in May, with another month-over-month drop in the index bringing it 0.3 points below our January result,” said Chris Frey, senior manager of Economic and Industry insights for Cox Automotive. “Taking a longer view, May’s year-over-year decline accelerated from April and March; however, the rate of decline might slow over the next several months as we encounter the lower prices seen at auction from May through November last year. Two consecutive reads in either measure do not a trend make, as used retail inventory is still below last year, and that tends to keep buyers at the auction, supporting prices.”
emphasis added
 Click on graph for larger image.
This index from Manheim Consulting is based on all completed sales transactions at Manheim’s U.S. auctions.
The Manheim index suggests used car prices decreased in May (seasonally adjusted) and were down 7.6% year-over-year (YoY).
Trade Deficit Increased to $74.6 Billion in April
by Calculated Risk on 6/07/2023 08:50:00 AM
The Census Bureau and the Bureau of Economic Analysis reported:
The U.S. Census Bureau and the U.S. Bureau of Economic Analysis announced today that the goods and services deficit was $74.6 billion in April, up $14.0 billion from $60.6 billion in March, revised.
April exports were $249.0 billion, $9.2 billion less than March exports. April imports were $323.6 billion, $4.8 billion more than March imports.
emphasis added
 Click on graph for larger image.
Exports decreased and imports increased in April.
Exports are down 1% year-over-year; imports are down 4% year-over-year.
Both imports and exports decreased sharply due to COVID-19 and then bounced back - and both have been decreasing recently.
The second graph shows the U.S. trade deficit, with and without petroleum.
 The blue line is the total deficit, and the black line is the petroleum deficit, and the red line is the trade deficit ex-petroleum products.
Note that net, exports of petroleum products are positive and have picked up.
The trade deficit with China decreased to $20.3 billion in March, from $30.4 billion a year ago.
The trade deficit was slightly less than the consensus forecast.
MBA: Mortgage Applications Decreased in Weekly Survey
by Calculated Risk on 6/07/2023 07:00:00 AM
From the MBA: Mortgage Applications Decrease in Latest MBA Weekly Survey
Mortgage applications decreased 1.4 percent from one week earlier, according to data from the Mortgage Bankers Association’s (MBA) Weekly Mortgage Applications Survey for the week ending June 2, 2023. This week’s results include an adjustment for the Memorial Day holiday.
The Market Composite Index, a measure of mortgage loan application volume, decreased 1.4 percent on a seasonally adjusted basis from one week earlier. On an unadjusted basis, the Index decreased 12 percent compared with the previous week. The Refinance Index decreased 1 percent from the previous week and was 42 percent lower than the same week one year ago. The seasonally adjusted Purchase Index decreased 2 percent from one week earlier. The unadjusted Purchase Index decreased 13 percent compared with the previous week and was 27 percent lower than the same week one year ago.
“Mortgage rates declined last week from a recent high, but total application activity slipped for the fourth straight week. The 30-year fixed rate dipped to 6.81 percent, 10 basis points lower than last week but still the second highest rate of 2023 to date,” said Joel Kan, MBA’s Vice President and Deputy Chief Economist. “Overall applications were more than 30 percent lower than a year ago, as borrowers continue to grapple with the higher rate environment. Purchase activity is constrained by reduced purchasing power from higher rates and the ongoing lack of for-sale inventory in the market, while there continues to be very little rate incentive for refinance borrowers. There was less of a decline in government purchase applications last week, which was consistent with a growing share of first-time home buyers in the market.”
...
The average contract interest rate for 30-year fixed-rate mortgages with conforming loan balances ($726,200 or less) decreased to 6.81 percent from 6.91 percent, with points decreasing to 0.66 from 0.83 (including the origination fee) for 80 percent loan-to-value ratio (LTV) loans
emphasis added
 Click on graph for larger image.
The first graph shows the MBA mortgage purchase index.
According to the MBA, purchase activity is down 27% year-over-year unadjusted.
Red is a four-week average (blue is weekly). This is close to the lowest level since the mid 1990s.

The second graph shows the refinance index since 1990.
With higher mortgage rates, the refinance index declined sharply in 2022 - and has mostly flat lined at a low level since then.
Tuesday, June 06, 2023
Wednesday: Trade Deficit
by Calculated Risk on 6/06/2023 08:22:00 PM
 Note: Mortgage rates are from MortgageNewsDaily.com and are for top tier scenarios.
Wednesday:
• At 7:00 AM ET, The Mortgage Bankers Association (MBA) will release the results for the mortgage purchase applications index.
• At 8:30 AM, Trade Balance report for April from the Census Bureau. The consensus is the trade deficit to be $75.4 billion. The U.S. trade deficit was at $64.2 Billion in March.
Second Home Market: South Lake Tahoe in May
by Calculated Risk on 6/06/2023 01:12:00 PM
With the pandemic, there was a surge in 2nd home buying.
I'm looking at data for some second home markets - and I'm tracking those markets to see if there is an impact from lending changes, rising mortgage rates or the easing of the pandemic.
This graph is for South Lake Tahoe since 2004 through May 2023, and shows inventory (blue), and the year-over-year (YoY) change in the median price (12-month average).
Note: The median price is a 12-month average, and is distorted by the mix, but this is the available data.
 Click on graph for larger image.
Following the housing bubble, prices declined for several years in South Lake Tahoe, with the median price falling about 50% from the bubble peak.
Currently active inventory is still very low and is down 32% year-over-year.
Prices are down 0.7% YoY, even with inventory at historically low levels.
Early Look at Local Housing Markets in May
by Calculated Risk on 6/06/2023 10:15:00 AM
Today, in the Calculated Risk Real Estate Newsletter: Early Look at Local Housing Markets in May
A brief excerpt:
This is a look at a few early reporting local markets in May. I’m tracking about 40 local housing markets in the US. Some of the 40 markets are states, and some are metropolitan areas. I’ll update these tables throughout the month as additional data is released.There is much more in the article. You can subscribe at https://calculatedrisk.substack.com/
Closed sales in May were mostly for contracts signed in March and April. Since 30-year fixed mortgage rates were in the 6% to 6.5% range in March and April - compared to the 4% to 5% range the previous year - closed sales were down significantly year-over-year in May.
...
In May, sales in these markets were down 26.6%. In April, these same markets were down 34.4% YoY Not Seasonally Adjusted (NSA).
This is a smaller YoY decline NSA than in April for these early reporting markets, however seasonally adjusted, it is closer. Note that there was one less selling day in April this year than in April 2022, but the same number of selling days each year in May.
Another factor in the smaller YoY decline was that sales were steadily declining last year due to higher mortgage rates. ...
This was a just a few early reporting markets. Many more local markets to come!

CoreLogic: House Prices up 2.0% YoY in April
by Calculated Risk on 6/06/2023 08:11:00 AM
Notes: This CoreLogic House Price Index report is for April. The recent Case-Shiller index release was for March. The CoreLogic HPI is a three-month weighted average and is not seasonally adjusted (NSA).
From CoreLogic: CoreLogic: Home Price Growth Continues Annual Single-Digit Slowdown in April
CoreLogic® ... today released the CoreLogic Home Price Index (HPI™) and HPI Forecast™ for April 2023.This index was up 3.1% YoY in March.
Nationwide, single-family home price growth rose by 2% year over year in April. This marked the 135th consecutive month of annual growth but the sixth straight month of single-digit gains, which have slowed from an all-time high of nearly 20% annual appreciation in the spring of 2022.
Numerous economic concerns are contributing to buyer reluctance, including mortgage rate volatility and the related uncertainty surrounding the recent debt-ceiling debate. That said, a continued shortage of homes for sale could keep pressure on housing prices over the next 12 months. CoreLogic projects that home price growth will slow a bit more in 2023 before regaining steam to about 5% annual appreciation by April 2024.
“While mortgage rate volatility continues to cause buyer hesitation, the lack of for-sale homes is putting firm pressure on prices this spring, leading to above-average seasonal monthly gains and a rebound in home prices in most markets,” said CoreLogic Chief Economist Selma Hepp. ”Nevertheless, the recent surge in mortgage rates and continued inflation issues suggest that rates may remain elevated, leading home price appreciation to possibly relax this summer and return to average seasonal gains later in 2023.”
“Still, while slim inventory is pushing prices up once again and constraining affordability,” Hepp continued, “recent trends suggest that home price growth in 2023 will fall in line with the historical 4% annual average.“
...
U.S. home prices (including distressed sales) increased by 2% year over year in April 2023 compared with April 2022. On a month-over-month basis, home prices increased by 1.2% compared with March 2023.
emphasis added
Monday, June 05, 2023
Tuesday: CoreLogic House Prices
by Calculated Risk on 6/05/2023 08:11:00 PM
 From Matthew Graham at Mortgage News Daily: Mortgage Rates Roughly Unchanged Over The Weekend
Mortgage rates held fairly steady over the weekend. That wasn't necessarily destined to be the case as the underlying bond market suggested another mover higher earlier this morning. But bonds rallied after an important economic report on the services sector suggested slower growth (bonds tend to improve in response to weaker cues on the economy and inflation). ... With the next major inflation report (CPI) and the next Fed rate announcement on Tuesday and Wednesday next week, rates might not be inclined to make a big run in either direction between now and then. [30 year fixed 6.89%]Tuesday:
emphasis added
• At 8:00 AM ET, CoreLogic House Price index for April.
ISM® Services Index Decreases to 50.3% in May
by Calculated Risk on 6/05/2023 12:52:00 PM
(Posted with permission). The ISM® Services index was at 50.3%, down from 51.9% last month. The employment index decreased to 49.2%, from 50.8%. Note: Above 50 indicates expansion, below 50 in contraction.
From the Institute for Supply Management: Services PMI® at 50.3% May 2023 Services ISM® Report On Business®
Economic activity in the services sector expanded in May for the fifth consecutive month as the Services PMI® registered 50.3 percent, say the nation's purchasing and supply executives in the latest Services ISM® Report On Business®. The sector has grown in 35 of the last 36 months, with the lone contraction in December of last year.The PMI was below expectations.
The report was issued today by Anthony Nieves, CPSM, C.P.M., A.P.P., CFPM, Chair of the Institute for Supply Management® (ISM®) Services Business Survey Committee: “In May, the Services PMI® registered 50.3 percent, 1.6 percentage points lower than April’s reading of 51.9 percent. The composite index indicated growth in May for the fifth consecutive month after a reading of 49.2 percent in December, which was the first contraction since May 2020 (45.4 percent). The Business Activity Index registered 51.5 percent, a 0.5-percentage point decrease compared to the reading of 52 percent in April. The New Orders Index expanded in May for the fifth consecutive month after contracting in December for the first time since May 2020; the figure of 52.9 percent is 3.2 percentage points lower than the April reading of 56.1 percent.
“The Supplier Deliveries registered 47.7 percent, 0.9 percentage point lower than the 48.6 percent recorded in April. In the last six months, the average reading of 48.0 percent (with a low of 45.8 percent in March) reflects the fastest supplier delivery performance since June 2009, when the index registered 46 percent. (Supplier Deliveries is the only ISM® Report On Business® index that is inversed; a reading of above 50 percent indicates slower deliveries, which is typical as the economy improves and customer demand increases.)
“The Prices Index was down 3.4 percentage points in May, to 56.2 percent. The Inventories Index expanded in May after a month of contraction and two previous months of growth, preceded by eight straight months of contraction; the reading of 58.3 percent is up 11.1 percentage points from April’s figure of 47.2 percent. The Inventory Sentiment Index (61 percent, up 12.1 percentage points from April’s reading of 48.9 percent) expanded after a month of contraction preceded by four months of growth, with a four-month period of contraction before that. The Backlog of Orders Index registered 40.9 percent, an 8.8-percentage point decrease compared to the April figure of 49.7 percent and the index’s lowest reading since May 2009 (40 percent).
emphasis added
Black Knight Mortgage Monitor: Home Prices Increased Month-to-month in April; Prices Unchanged YoY
by Calculated Risk on 6/05/2023 11:00:00 AM
Today, in the Calculated Risk Real Estate Newsletter: Black Knight Mortgage Monitor: Home Prices Increased Month-to-month in April; Prices Unchanged YoY
A brief excerpt:
Note: The Black Knight House Price Index (HPI) is a repeat sales index. Black Knight reports the median price change of the repeat sales.There is much more in the article. You can subscribe at https://calculatedrisk.substack.com/
Here is a graph of the Black Knight HPI. The index is still up 1.0% year-over-year and will likely turn negative YoY soon.
• April’s 0.46% seasonally adjusted rise was down from March’s revised +0.62% and roughly on par with the 0.49% rise in February
• April’s seasonally adjusted increase was near the 30-year average of 0.48% for the month – 5.5% annualized
• Despite prices firming up this spring, the annual home price growth rate slipped to 0% in April, the first-time prices have been flat year over year since the rebound from the Great Financial Crisis began in 2012
• At its current trajectory, the annual home price growth rate would only fall modestly below 0% for a very short time before pulling back above water by late Q2/early Q3
emphasis added

Housing June 5th Weekly Update: Inventory Increased 0.7% Week-over-week
by Calculated Risk on 6/05/2023 08:21:00 AM
Altos reports that active single-family inventory was up 0.7% week-over-week.
 Click on graph for larger image.
This inventory graph is courtesy of Altos Research.
As of June 2nd, inventory was at 436 thousand (7-day average), compared to 433 thousand the prior week.
Year-to-date, inventory is down 11.1%. And inventory is up 7.6% from the seasonal bottom seven weeks ago.

The red line is for 2023. The black line is for 2019. Note that inventory is up from the previous two years (the record low was in 2022), but still well below normal levels.
Inventory was up 18.4% compared to the same week in 2022 (last week it was up 21.1%), and down 53.7% compared to the same week in 2019 (last week down 53.5%).
It appears likely inventory will be down year-over-year in late June or early July.
Mike Simonsen discusses this data regularly on Youtube.
Sunday, June 04, 2023
Sunday Night Futures
by Calculated Risk on 6/04/2023 07:15:00 PM
Weekend:
• Schedule for Week of June 4, 2023
Monday:
• At 10:00 AM ET, the ISM Services Index for May. The consensus is for a reading of 52.5, up from 51.9.
From CNBC: Pre-Market Data and Bloomberg futures S&P 500 are up 3 and DOW futures are up 70 (fair value).
Oil prices were down over the last week with WTI futures at $71.74 per barrel and Brent at $76.13 per barrel. A year ago, WTI was at $119, and Brent was at $126 - so WTI oil prices are down about 40% year-over-year.
Here is a graph from Gasbuddy.com for nationwide gasoline prices. Nationally prices are at $3.52 per gallon. A year ago, prices were at $4.82 per gallon, so gasoline prices are down $1.30 per gallon year-over-year.


