 RSS Feed
 by Calculated Risk on 10/03/2010 12:40:00 PM
Sunday, October 03, 2010
Weekly Schedule for October 3rd
The previous post is the Summary for Week ending Oct 2nd
The key economic release this week is the September employment report on Friday. Fed Chairman Ben Bernanke will speak Monday evening, and his speech will be closely watched for additional hints on QE2.
Expected on Monday: September Personal Bankruptcy Filings
During the week: Reis is expected to release their Q3 Office, Mall and Apartment vacancy rate reports.
10:00 AM ET: Manufacturers' Shipments, Inventories and Orders for August. The consensus is for a 0.3% decline in August.
10:00 AM: Pending Home Sales Index for August. The consensus is for a slight increase (about 2.8%) in contracts signed. Economist Tom Lawler noted "My “best guess” right now on the pending home sales index is that it will show a seasonally adjusted increase from July to August of around 4%." It usually takes 45 to 60 days to close, so this will provide an early indication of closings in October.
11:30 AM: NY Fed's Brian Sack to speak at CFA conference in California: "Managing the Federal Reserve’s Balance Sheet".
7:30 PM: Fed Chairman Ben Bernanke will speak at the Rhode Island Public Expenditure Council meeting in Rhode Island. Although this is a "fiscal sustainability" meeting, Bernanke has promised not to speak on fiscal issues.
“With Rhode Island remaining among the top five states for unemployment, and with increasing signs that the national recovery is slowing, Ben S. Bernanke, Chairman of the Federal Reserve will visit Rhode Island to deliver the keynote address at the RIPEC Annual Dinner.”
10:00 AM: ISM Non-manufacturing Index for September. The consensus is for an increase in the service index to 52.0 from 51.5 in August.
7:00 AM: The Mortgage Bankers Association (MBA) will release the mortgage purchase applications index. This index declined sharply following the expiration of the tax credit, and the index has only recovered slightly over the last couple months - suggesting reported home sales through at least October will be very weak.
8:15 AM: ADP Employment Report for September. This report is for private payrolls only (no government). The consensus is for +23,000 payroll jobs in September - still weak, but an improvement over the 10,000 jobs reported lost in August.
8:30 AM: The initial weekly unemployment claims report will be released. Consensus is for a decline to 450,000 from 453,000 last week.
10:00 AM: Job Openings and Labor Turnover Survey for August from the BLS. This report has been showing very little turnover in the labor market and few job openings.
Fed Speeches: Dallas Fed President Richard Fisher will speak at the Economic Club of Minnesota, and Kansas City Fed President Thomas Hoenig will speak at an economic forum in Omaha (Fisher and Hoenig oppose additional easing).
3:00 PM: Consumer Credit for August. The consensus is for another $4 billion decline in consumer credit.
8:30 AM: Employment Report for September. The consensus is for no change in payroll jobs, with 78,000 fewer Census jobs, or about +78,000 ex-Census increase in payrolls. The consensus is for the unemployment rate to increase slightly to 9.7% from 9.6% in August. For a short preview, see: September Employment Report Preview. This is the last employment report before the two day Fed meeting on Nov 2nd and 3rd.
10:00 AM: Monthly Wholesale Trade: Sales and Inventories for August. The consensus is 0.5% increase in inventories.
After 4:00 PM: The FDIC might have another busy Friday afternoon ...
Summary for Week ending Oct 2nd
by Calculated Risk on 10/03/2010 09:34:00 AM
Here is a summary of last week - mostly in graphs.
During the previous week, a number of Fed Presidents spoke about further easing (what is known as QE2: quantitative easing, round two). The majority seemed to favor taking additional action - probably purchasing longer term Treasury securities. Barring an upside surprise in the economic data, most analysts expect QE2 to arrive at 2:15 PM ET on November 3rd (when the next FOMC statement is released).
Another story was the "robo-signer" foreclosure mess that has led to GMAC, JPMorgan and BofA halting or reviewing foreclosure filings - and for some insurance companies to stop offering title insurance on related foreclosures.
There are links to other stories at the bottom of this post.
Based on an estimate from Autodata Corp, light vehicle sales were at a 11.76 million SAAR in Setpember. That is up 25.8% from September 2009 (the dip following cash-for-clunkers), and up 2.8% from the August 2010 sales rate.
 Click on graph for larger image in new window.
This graph shows the historical light vehicle sales (seasonally adjusted annual rate) from the BEA (blue) and an estimate for August (red, light vehicle sales of 11.76 million SAAR from Autodata Corp).
This is the high for the year - slightly higher than in March.
 The second graph shows light vehicle sales since the BEA started keeping data in 1967.
Note: dashed line is current month sales rate. The current sales rate is about at the bottom of the '90/'91 recession - when there were fewer registered drivers and a smaller population.
This was above most forecasts of around 11.6 million SAAR.
From S&P: Home Prices Remain Stable Around Recent Lows According to the S&P/Case-Shiller Home Price Indices
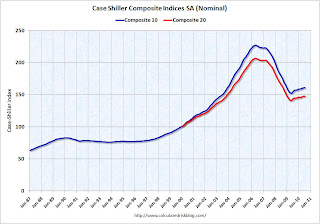 This graph shows the nominal seasonally adjusted Composite 10 and Composite 20 indices (the Composite 20 was started in January 2000).
The Composite 10 index is off 29.0% from the peak, and flat in July (SA).
The Composite 20 index is off 28.6% from the peak, and down 0.1% in July (SA).
The next graph shows the price declines from the peak for each city included in S&P/Case-Shiller indices.
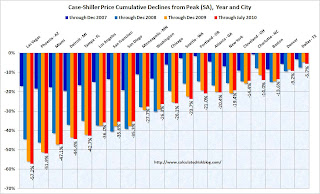 Prices increased (SA) in only 4 of the 20 Case-Shiller cities in July seasonally adjusted.
Prices in Las Vegas are off 57.2% from the peak, and prices in Dallas only off 5.7% from the peak.
Prices probably declined just about everywhere in July, but this will not be evident in the Case-Shiller index until next month since the Case-Shiller index is an average of three months.
From the BEA: Personal Income and Outlays, August 2010
Personal income increased $59.3 billion, or 0.5 percent ... Personal consumption expenditures (PCE) increased $41.3 billion, or 0.4 percent.
...
Real PCE increased 0.2 percent, the same increase as in July.
...
Personal saving as a percentage of disposable personal income was
5.8 percent in August, compared with 5.7 percent in July.
 This graph shows monthly real PCE since Q4 2009. the dashed red lines are the quarterly PCE (note: left scale doesn't start at zero to show the change).
The key in this report is that real PCE growth in Q3 will probably be around 2.0% annualized - barring a significant change in September. This suggests sluggish, but positive GDP growth in Q3.
PMI at 54.4% in September down from 56.3% in August.
From the Institute for Supply Management: September 2010 Manufacturing ISM Report On Business®
 Here is a long term graph of the ISM manufacturing index.
In addition to the decrease in the PMI, the ISM's new orders index fell to 51.1 from 53.1 in August, and the production index declined to 56.5 from 59.9.
The employment index declined to 56.5 from 60.4 in August.
And the inventory index was up for the 3rd month in a row to 55.6 from 51.4.
With new order growth slowing, and inventory increasing - further declines in the ISM PMI are very likely. As ISM's Norbert Ore noted, these indexes are "sending strong negative signals of weakening performance in the [manufacturing] sector".
The Census Bureau reported overall construction spending increased slightly in August.
 This graph shows private residential and nonresidential construction spending since 1993. Note: nominal dollars, not inflation adjusted.
Both residential and non-residential private construction spending declined in August. Residential spending is 64.7% below the peak early 2006, and 4.7% above the recent low in 2009.
Non-residential spending is 37.3% from the peak in January 2008.
Residential spending has turned slightly negative after the tax credit expired - and this indicates residential investment (RI) will be a drag on Q3 GDP.
Best wishes to all.
Saturday, October 02, 2010
Commercial Real Estate: End of Extend and Pretend?
by Calculated Risk on 10/02/2010 09:21:00 PM
Buck Wargo at the Las Vegas Sun reports that "extend and pretend" for commercial real estate (CRE) might be ending: Lenders gaining speed in going after commercial foreclosures
[The] tsunami of commercial foreclosures ... never materialized as ... lenders were working with owners to lower interest rates and extend loans ... Now that philosophy is starting to change.Las Vegas is in worse shape than most other areas, but it sounds like the lenders are now moving ahead and foreclosing on CRE properties - and that might mean the pace of CRE foreclosures will pick up nationwide.
"[A] number of banks have been hesitant to pull the trigger on foreclosures, but we have seen recently banks are beginning to go ahead with the foreclosure process.” [said John Delikanakis, an attorney with Snell & Wilmer]
...
“Banks are beginning to realize where they are at in that loan,” [Rob Moore of Faris Lee Investments] said. “They were postponing it waiting for things to get back where they can get out of the hold, but that’s not going to happen.”
...
"The time for ‘extending and pretending’ by the banks for a variety of commercial real estate loans has ended,” [John Restrepo, principal at Restrepo Consulting Group] said. “There finally is a realization by the banks, regulators and borrowers that the market will not recover sufficiently to save many commercial projects from foreclosure.”
Report: Title Insurance company stops insuring Chase Foreclosures
by Calculated Risk on 10/02/2010 05:04:00 PM
From David Streitfeld at the NY Times: Company Stops Insuring Titles in Chase Foreclosures
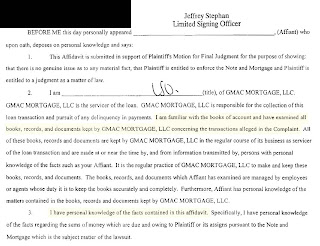
The company, Old Republic National Title Insurance, told its agents Friday that it would not write policies on foreclosed Chase properties until “the objectionable issues have been resolved,” according to a memorandum sent out by the firm’s underwriting department.For those who haven't seen it, here is an excerpt from an affidavit signed by Jeffrey Stephen of GMAC:
 Click on image for larger image in new window.
I've highlighted a couple of sentences in yellow. Source: Stopa Law Blog
According to the affidavit the affiant claims to have "examined" the details of the transactions in the complaint, and that he has "personal knowledge of the facts contained in the affidavit". In a disposition - according to media reports - the affiant admitted to just signing the documents without verifying the details. If so, the affidavit is not correct.
The affidavits are being withdrawn.
Obviously the title insurance companies are concerned about what will happen to homes that have already been through foreclosure - with false affidavits filed during the process - and that have already been sold to another party. I'll have more on this later ...
Unofficial Problem Bank List increases to 877 institutions
by Calculated Risk on 10/02/2010 01:27:00 PM
Note: this is an unofficial list of Problem Banks compiled only from public sources.
Here is the unofficial problem bank list for Oct 1, 2010.
Changes and comments from surferdude808:
The number of institutions on the Unofficial Problem Bank List rose this week but assets fell with the removal of a large publicly traded bank.
Removals include the failed Shoreline Bank ($104 million), an affiliate of the failed Chicago-based ShoreBank; and Sterling Savings Bank ($9.1 billion Ticker: STSA), which said in an 8-K that its enforcement action had been terminated.
There were six additions this week including First Savings Bank Northwest, Renton, WA ($1.3 billion Ticker: FFNW); Brooklyn Federal Savings Bank, Brooklyn, NY ($523 million Ticker: BFSB); Diamond Bank, FSB, Schaumburg, IL ($278 million); The Bank of Asheville, Asheville, NC ($214 million Ticker: WFSC); Alaska Pacific Bank, Juneau, AK ($177 million Ticker: AKPB), which is the first Alaska-based institution to make an appearance on the Unofficial Problem Bank List; and Wawel Savings Bank, Wallington, NJ ($96 million Ticker: WAWL).
After these changes, the Unofficial Problem Bank List includes 877 institutions with assets of $416.1 billion compared to 872 institutions with assets of $422.4 billion last week.
Transition Matrix
With the passage of another quarter, it is time to update the transition matrix. The Unofficial Problem Bank List debuted on August 7, 2009 with 389 institutions with assets of $276.3 billion (see table).
Over the past 13 months, 144 institutions have been removed from the original list with 103 due to failure, 29 due to action termination, and 12 due to unassisted merger. Thus, about 72 percent of the removals are from failure.
Nearly 27 percent of the 389 institutions on the original list have failed, which is substantially higher than the 12 percent figure usually cited by the media as the failure rate for institutions on the FDIC Problem Bank List. Failed bank assets have totaled $159 billion or nearly 58 percent of the $276.3 billion on the original list.
Since the publication of the original list, another 740 institutions have been added. However, only 632 of those 740 additions remain on the current list as 108 institutions have been removed in the interim. Of the 108 interim removals, 88 were due to failure, 15 were due to unassisted merger, 4 from action termination, and one from voluntary liquidation.
Again, failure represents a disproportionate 81.5 percent of the reason for removal. In total, 1,129 institutions have made an appearance on the Unofficial Problem Bank List and 191 or 16.9 percent have failed.
The average asset size of removals because of failure is $1.2 billion. Currently, the average asset size of institutions on the current list is $474 million versus $710 million on the original list. This would suggest the asset size of future failures will likely be lower.
| Unofficial Problem Bank List | |||
|---|---|---|---|
| Change Summary | |||
| Number of Institutions | Assets ($Thousands) | ||
| Start (8/7/2009) | 389 | 276,313,429 | |
| Subtractions | |||
| Action Terminated | 29 | (4,038,439) | |
| Unassisted Merger | 12 | (1,762,072) | |
| Failures | 103 | (159,037,514) | |
| Asset Change | (11,891,765) | ||
| Still on List at 7/02/2010 | 245 | 99,583,639 | |
| Additions | 632 | 316,517,379 | |
| End (10/01/2010) | 877 | 416,101,018 | |
| Interperiod Deletions1 | |||
| Action Terminated | 4 | 12,881,783 | |
| Unassisted Merger | 15 | 2,545,683 | |
| Voluntary Liquidation | 1 | 119,082 | |
| Failures | 88 | 70,091,963 | |
| Total | 108 | 85,638,511 | |
| 1Institution not on 8/7/2009 or 10/01/2010 list but appeared on a list between these dates. | |||
September Employment Report Preview
by Calculated Risk on 10/02/2010 08:50:00 AM
1) The consensus is for a headline payroll number of zero (no net payroll jobs added or lost) and for the unemployment rate to increase to 9.7% in September from 9.6% in August.
Goldman Sachs is forecasting a minus 50,000 headline payroll number and an increase in the unemployment rate to 9.7%.
2) My estimate is the decennial Census workforce was reduced by 78,000 in August. This suggests a consensus headline payroll number of +78,000 ex-Census.
 Click on graph for larger image in new window.
This graph shows the number of Census workers paid each week. The red labels are the weeks of the BLS payroll survey.
The Census payroll decreased from 83,955 for the week ending August 14th to 6,038 for the week ending September 18th.
So my estimate for the impact of the Census on September payroll employment is minus 78 thousand (this will probably be close).
With temporary payroll employment down to 6,038, September will be the last month with a significant decennial Census adjustment.
3) The unemployment rate is dependent on both job creation and the participation rate (both numbers from the household survey - payroll employment is from the establishment survey).
Usually the participation rate - the percent of the civilian population in the labor force - falls when the job market is weak. And a decline in the participation rate puts downward pressure on the unemployment rate (and the opposite is true when the participation rate increases).
Right now the participation rate is very low at 64.7%, and a further decline would be considered bad employment news (even if the unemployment rate declined slightly). An increase in the participation rate, combined with a weak labor market, could lead to a jump in the unemployment rate. This is something to watch closely.
4) In August the unemployment rate was 9.643% unrounded (reported as 9.6%), so it won't take much of an increase to reach the consensus 9.7% for September.
5) This will be the last employment report before the two day FOMC meeting on Nov 2nd and 3rd. Anything close to the consensus will probably all but guarantee QE2 (barring a significant upside surprise for Q3 GDP to be reported on October 29th).
Friday, October 01, 2010
Foreclosure Mess: More on BofA Foreclosure Freeze, Wells Fargo satisfied with Procedures
by Calculated Risk on 10/01/2010 11:59:00 PM
From David Streitfeld at the NY Times: Bank of America to Freeze Foreclosure Cases
Bank of America, the country’s largest mortgage lender by assets, said on Friday that it was reviewing documents in all foreclosure cases now in court to evaluate if there were errors.And from Jacob Gaffney at Housing Wire: Wells Fargo standing by accuracy of foreclosure affidavits
It is the third major lender in the last two weeks to freeze foreclosures in the 23 states where the process is controlled by courts.
...
Bank of America, in an e-mailed statement, said it would “amend all affidavits in foreclosure cases that have not yet gone to judgment.”
The second largest servicer in the United States, Wells Fargo is not planning to review foreclosure affidavits in light of the robo-signer allegations at many of its competitors.I've corresponded with two servicers and they both believe their procedures are adequate (no "robo-signers"). However for GMAC - and apparently for JPMorgan and BofA - there is no excuse.
In an email to HousingWire, Wells Fargo spokesman Jason Menke said, "Wells Fargo policies, procedures and practices satisfy us that the affidavits we sign are accurate. We audit, monitor and review our affidavits under controlled standards on a daily basis. We will stand by our affidavits and, if we find an error, we will take the appropriate corrective action."
Bank Failure #129: Shoreline Bank, Shoreline, Washington
by Calculated Risk on 10/01/2010 09:14:00 PM
Shoreline swiftly eroded
Solvency soon sunk
by Soylent Green is People
From the FDIC: GBC International Bank, Los Angeles, California, Assumes All of the Deposits of Shoreline Bank, Shoreline, Washington
As of June 30, 2010, Shoreline Bank had approximately $104.2 million in total assets and $100.2 million in total deposits. ... The FDIC estimates that the cost to the Deposit Insurance Fund (DIF) will be $41.4 million. ... Shoreline Bank is the 129th FDIC-insured institution to fail in the nation this year, and the tenth in Washington.Two down today ...
Bank Failure #128: Wakulla Bank, Crawfordville, Florida
by Calculated Risk on 10/01/2010 06:08:00 PM
Some day these failures will end
Today's not that day
by Soylent Green is People
From the FDIC: Centennial Bank, Conway, Arkansas, Assumes All of the Deposits of Wakulla Bank, Crawfordville, Florida
As of June 30, 2010, Wakulla Bank had approximately $424.1 million in total assets and $386.3 million in total deposits. ... The FDIC estimates that the cost to the Deposit Insurance Fund (DIF) will be $113.4 million. ... Wakulla Bank is the 128th FDIC-insured institution to fail in the nation this year, and the twenty-fifth in Florida.Twenty five in Florida alone this year ...
Foreclosure Update: BofA Halts Certain Foreclosures, Connecticut orders 60 day moratorium
by Calculated Risk on 10/01/2010 06:04:00 PM
From the WaPo: Connecticut halts all foreclosures for all banks
From Business Insider: Bank Of America Joins JPMorgan In Suspending Foreclosures
From MarketWatch: Title insurers dented by ‘robo-signer’ concern
U.S. Light Vehicle Sales 11.76 million SAAR in September
by Calculated Risk on 10/01/2010 04:00:00 PM
Based on an estimate from Autodata Corp, light vehicle sales were at a 11.76 million SAAR in Setpember. That is up 25.8% from September 2009 (the dip following cash-for-clunkers), and up 2.8% from the August 2010 sales rate.
Click on graph for larger image in new window.
This graph shows the historical light vehicle sales (seasonally adjusted annual rate) from the BEA (blue) and an estimate for August (red, light vehicle sales of 11.76 million SAAR from Autodata Corp).
This is the high for the year - slightly higher than in March.
The second graph shows light vehicle sales since the BEA started keeping data in 1967.
Note: dashed line is current month sales rate. The current sales rate is about at the bottom of the '90/'91 recession - when there were fewer registered drivers and a smaller population.
This was above most forecasts of around 11.6 million SAAR.
Fed's Dudley and Evans support QE2
by Calculated Risk on 10/01/2010 01:50:00 PM
From New York Fed President William Dudley: The Outlook, Policy Choices and Our Mandate
Currently, my assessment is that both the current levels of unemployment and inflation and the timeframe over which they are likely to return to levels consistent with our mandate are unacceptable. In addition, the longer this situation prevails and the U.S. economy is stuck with the current level of slack and disinflationary pressure, the greater the likelihood that a further shock could push us still further from our dual mandate objectives and closer to outright deflation.And from Chicago Fed President Charles Evans: A Perspective on the Future of U.S. Monetary Policy
We have tools that can provide additional stimulus at costs that do not appear to be prohibitive. Thus, I conclude that further action is likely to be warranted unless the economic outlook evolves in a way that makes me more confident that we will see better outcomes for both employment and inflation before too long.
The modern economic theory of liquidity traps indicates that the optimal policy response at zero-bound is to lower the real interest rate, almost surely by employing unconventional policy tools. Theory also indicates that, in the absence of such policy stimulus, the factors that generate high risk aversion could very well stifle a meaningful recovery, keep unemployment high and reinforce disinflationary pressures – clearly an undesirable equilibrium.Dudley is on the FOMC (NY is a permanent member) and Evans is an alternate member. The Fed presidents are signaling that barring an upside surprise - and the personal income report this morning suggests Q3 GDP will show sluggish growth - QE2 will arrive on November 3rd.
So, in the coming weeks and months, as I assess the incoming data, update my forecast and deliberate on the best monetary policy approach, I will be pondering two key issues: How much more should monetary policy do to reduce the shortfalls in meeting our dual mandate responsibilities for employment and price stability; and what tools should we use?
Private Construction Spending declines in August
by Calculated Risk on 10/01/2010 12:30:00 PM
Catching up with all the data this morning ...
The Census Bureau reported overall construction spending increased slightly in August.
[C]onstruction spending during August 2010 was estimated at a seasonally adjusted annual rate of $811.8 billion, 0.4 percent (±1.8%)* above the revised July estimate of $808.6 billion.However private construction spending declined again:
Spending on private construction was at a seasonally adjusted annual rate of $498.2 billion, 0.9 percent (±1.1%)* below the revised July estimate of $502.6 billion. Residential construction was at a seasonally adjusted annual rate of $238.5 billion in August, 0.3 percent (±1.3%)* below the revised July estimate of $239.1 billion. Nonresidential construction was at a seasonally adjusted annual rate of $259.7 billion in August, 1.4 percent (±1.1%) below the revised July estimate of $263.5 billion.
Click on graph for larger image in new window.This graph shows private residential and nonresidential construction spending since 1993. Note: nominal dollars, not inflation adjusted.
Both residential and non-residential private construction spending declined in August. Residential spending is 64.7% below the peak early 2006, and 4.7% above the recent low in 2009.
Non-residential spending is 37.3% from the peak in January 2008.
 On a year-over-year basis, residential spending has turned slightly negative after the tax credit expired - and this indicates residential investment (RI) will be a drag on Q3 GDP.
 Non-residential spending is still off sharply from last year (down 24%), but the rate of decline might be slowing. As major projects are completed, I expect private non-residential spending to fall below residential spending later this year or in early 2011.
General Motors: September U.S. sales increase 10.5% to 173,155 units
by Calculated Risk on 10/01/2010 10:58:00 AM
Note: in September 2009 U.S. light vehicle sales were 9.3 million (SAAR). There was a sharp decline in sales following the "Cash-for-clunkers" program that ended in August 2009, so the year-over-year comparisons look good. The real key is the seasonally adjusted sales rate compared to the last few months (total U.S. light vehicle sales have been mostly flat since March 2010).
From MarketWatch: GM September U.S. sales up 10.5% to 173,155 units
General Motors Co. said Friday that U.S. sales in September rose 10.5% to 173,155 vehicles from 156,673 in September 2009.I'll add reports from the other major auto companies as updates to this post.
Update1: from MarketWatch: Chrysler U.S. September sales surge 61% to 100,077
Update2: from MarketWatch: Ford U.S. Sept. sales jump 46.3% to 160,873 units
Update3: from MarketWatch: Toyota U.S. Sept. sales rise 16.8% to 147,162
NOTE: Once all the reports are released, I'll post a graph of the estimated total September light vehicle sales (SAAR: seasonally adjusted annual rate) - usually around 4 PM ET. Most estimates are for an increase to 11.6 million SAAR in September from the 11.44 million SAAR in August.
ISM Manufacturing Index declines in September
by Calculated Risk on 10/01/2010 10:00:00 AM
PMI at 54.4% in September down from 56.3% in August. The consensus was for a decline to 54.5 percent.
From the Institute for Supply Management: September 2010 Manufacturing ISM Report On Business®
The report was issued today by Norbert J. Ore, CPSM, C.P.M., chair of the Institute for Supply Management™ Manufacturing Business Survey Committee. "While the headline number shows relative strength this month as the PMI reading of 54.4 percent is still quite positive, the overall picture is less encouraging. The growth of new orders continued to slow, as the index is down significantly from its cyclical high of 65.9 percent (January 2010). Production is currently growing at a faster rate than new orders, but it typically lags and would be expected to weaken further in the fourth quarter. Manufacturing has enjoyed a stronger recovery than other sectors of the economy, but it appears that weaker growth is the expectation for the fourth quarter. Both the Inventories and Backlog of Orders Indexes are sending strong negative signals of weakening performance in the sector."
Click on graph for larger image in new window.Here is a long term graph of the ISM manufacturing index.
In addition to the decrease in the PMI, the ISM's new orders index fell to 51.1 from 53.1 in August, and the production index declined to 56.5 from 59.9.
The employment index declined to 56.5 from 60.4 in August.
And the inventory index was up for the 3rd month in a row to 55.6 from 51.4.
With new order growth slowing, and inventory increasing - further declines in the ISM PMI are very likely. Or as Ore noted, these indexes are "sending strong negative signals of weakening performance in the [manufacturing] sector".
August: Real Personal consumption expenditures (PCE) increases 0.2%
by Calculated Risk on 10/01/2010 08:30:00 AM
From the BEA: Personal Income and Outlays, August 2010
Personal income increased $59.3 billion, or 0.5 percent ... Personal consumption expenditures (PCE) increased $41.3 billion, or 0.4 percent.
...
Real PCE increased 0.2 percent, the same increase as in July.
...
Personal saving as a percentage of disposable personal income was
5.8 percent in August, compared with 5.7 percent in July.
Click on graph for large image.This graph shows monthly real PCE since Q4 2009. the dashed red lines are the quarterly PCE (note: left scale doesn't start at zero to show the change).
Using the two-month method to estimate PCE, it looks like real PCE growth will be about 2.0% annualized Q3 2010 - or about the same as in the previous two quarters.
This month the saving rate increased slightly ...
 This graph shows the saving rate starting in 1959 (using a three month trailing average for smoothing) through the July Personal Income report. The saving rate increased to 5.8% in August from 5.7% in July.
I expect the saving rate to rise further - perhaps to 8% or more.
The key in this report is that PCE growth in Q3 will probably be around 2.0% - barring a significant change in September. This suggests sluggish GDP growth in Q3.
Thursday, September 30, 2010
Video: Economist / Comedian Bauman at the American Economic Association humor session
by Calculated Risk on 9/30/2010 11:49:00 PM
A little economics humor ...
Hotel Occupancy Rate: Slightly below 2008 Levels
by Calculated Risk on 9/30/2010 09:04:00 PM
Hotel occupancy is one of several industry specific indicators I follow ...
From HotelNewsNow.com: STR: Chain scales report strong RevPAR gains
Overall, the U.S. hotel industry rose 7.5% in occupancy to 64.2%, average daily rate was up 2.6% to US$103.09, and RevPAR ended the week up 10.3% to US$66.15.The following graph shows the four week moving average for the occupancy rate by week for 2008, 2009 and 2010 (and a median for 2000 through 2007).
 Click on graph for larger image in new window.
Notes: the scale doesn't start at zero to better show the change. The graph shows the 4-week average, not the weekly occupancy rate.
On a 4-week basis, occupancy is up 6.0% compared to last year (the worst year since the Great Depression) and 5.2% below the median for 2000 through 2007.
The occupancy rate is slightly below the levels of 2008 - and 2008 was a tough year for the hotel industry!
Important: Even though the occupancy rate is close to 2008 levels, 2010 is a much more difficult year. The average daily rate (ADR) is off close to 8% from 2008 levels - so even with the similar occupancy rates, hotel room revenue is off sharply compared to two years ago.
Data Source: Smith Travel Research, Courtesy of HotelNewsNow.com
Existing Home Inventory declines slightly in September, Up year-over-year
by Calculated Risk on 9/30/2010 06:00:00 PM
Tom Lawler reports that at the end of September, listings on Realtor.com totaled 3,960,417, down 1.2% from 4,007,860 at the end of August. This is 1.7% higher than in September 2009.
The NAR reported inventory at 3.98 million at the end of August, and at 3.71 million in September 2009. So they will probably report inventory at around 3.85 million for September 2010. (NAR does not seasonally adjust inventory and this appears to be a normal seasonal decline. The months-of-supply metric uses seasonally adjusted sales, but NSA inventory.).
Since sales probably only increased slightly in September, the months-of-supply metric will probably still be well into double digits again.
Note: there is a seasonal pattern for existing home inventory. Usually inventory peaks in July and declines slightly through October - and then declines sharply at the end of the year as sellers take their homes off the market for the holidays.
Restaurant Index shows contraction in August
by Calculated Risk on 9/30/2010 03:31:00 PM
This is one of several industry specific indexes I track each month.
 Click on graph for larger image in new window.
Same store sales and customer traffic both declined again in August (on a year-over-year basis). Unfortunately the data for this index only goes back to 2002.
Note: Any reading above 100 shows expansion for this index.
From the National Restaurant Association (NRA): Restaurant Industry Outlook Remained Cautious as Restaurant Performance Index Was Essentially Flat in August
As a result of continued soft sales and traffic levels, the National Restaurant Association’s comprehensive index of restaurant activity remained below 100 for the fourth consecutive month in August. The Association’s Restaurant Performance Index (RPI) – a monthly composite index that tracks the health of and outlook for the U.S. restaurant industry – stood at 99.5 in August, essentially unchanged from the previous three months. In addition, the RPI stood below 100 for the fourth consecutive month, which signifies contraction in the index of key industry indicators.Restaurants are a discretionary expense, and this contraction could be because of the sluggish recovery or might suggest further weakness in consumer spending in the months ahead.
...
Restaurant operators reported a net decline in same-store sales for the fifth consecutive month in August ... Restaurant operators also continued to report a net decline in customer traffic levels in August..
emphasis added


