 RSS Feed
 by Calculated Risk on 9/22/2010 11:14:00 AM
Wednesday, September 22, 2010
Housing Starts and the Unemployment Rate
An update by request ... Click on graph for larger image in new window.
This graph shows single family housing starts and the unemployment rate through August (inverted).
You can see both the correlation and the lag. The lag is usually about 12 to 18 months, with peak correlation at a lag of 16 months for single unit starts. The 2001 recession was a business investment led recession, and the pattern didn't hold.
Housing starts (blue) rebounded a little last year,and then moved sideways for some time, before declining again in May.
This is what I expected when I first posted the above graph over a year ago. I wrote:
[T]here is still far too much existing home inventory, a sharp bounce back in housing starts is unlikely, so I think ... a rapid decline in unemployment is also unlikely.Usually near the end of a recession, residential investment1 (RI) picks up as the Fed lowers interest rates. This leads to job creation and also household formation - and that leads to even more demand for housing units - and more jobs, and more households - a virtuous cycle that usually helps the economy recover.
However this time, with the huge overhang of existing housing units, this key sector isn't participating. So in this recovery there is less job creation, less household formation, and less demand for housing units than in a normal recovery. This is sort of a circular trap for both GDP growth and employment that will persist until the excess housing units are absorbed.
Although there are other factors impacting the unemployment rate, the weakness in RI is one of the reasons I expect the unemployment rate to tick up over the next several months.
1 RI is mostly new home sales and home improvement.
AIA: Architecture Billings Index shows contraction in August
by Calculated Risk on 9/22/2010 08:30:00 AM
Note: This index is a leading indicator for new Commercial Real Estate (CRE) investment.
Reuters reports that the American Institute of Architects’ Architecture Billings Index increased to 48.2 in August from 47.9 in July. Any reading below 50 indicates contraction.
Project cancellations continue to be the main roadblock to recovery for the construction sector, the group said.The ABI press release is not online yet.
 Click on graph for larger image in new window.
This graph shows the Architecture Billings Index since 1996. The index has remained below 50, indicating falling demand, since January 2008.
Note: Nonresidential construction includes commercial and industrial facilities like hotels and office buildings, as well as schools, hospitals and other institutions.
According to the AIA, there is an "approximate nine to twelve month lag time between architecture billings and construction spending" on non-residential construction. So there will probably be further declines in CRE investment into 2011.
MBA: Mortgage Purchase Activity declines slightly
by Calculated Risk on 9/22/2010 07:12:00 AM
The MBA reports: Mortgage Applications Decrease in Latest MBA Weekly Survey
The Refinance Index decreased 0.9 percent from the previous week, which is the third straight weekly decrease. The seasonally adjusted Purchase Index decreased 3.3 percent from one week earlier.
...
The average contract interest rate for 30-year fixed-rate mortgages decreased to 4.44 percent from 4.47 percent, with points decreasing to 0.81 from 1.08 (including the origination fee) for 80 percent loan-to-value (LTV) ratio loans.
 Click on graph for larger image in new window.
This graph shows the MBA Purchase Index and four week moving average since 1990.
Purchase applications have declined for two consecutive weeks after rising slightly from the lows in July. Purchase applications are at about the levels of 1996 or 1997, suggesting existing home sales (closed transactions) in August, September and even October, will be weak. (Lawler's estimate is existing home sales will be around 4.1 million SAAR in August - to be reported Thursday)
Tuesday, September 21, 2010
On the GMAC Foreclosure Stories
by Calculated Risk on 9/21/2010 08:31:00 PM
I was going to ignore this, but I realized Tanta had written some informative and entertaining pieces that will help everyone understand the issues.
First an update from Bloomberg earlier today: Ally Says GMAC Mortgage Mishandled Affidavits on Foreclosures
Ally Financial Inc., whose GMAC Mortgage unit halted evictions in 23 states amid allegations of mishandled affidavits, said its filings contained no false claims about home loans.The basic facts are:
The “defect” in affidavits used to support evictions was “technical” and was discovered by the company, Gina Proia, an Ally spokeswoman, said in an e-mailed statement.
This is great for the lawyers (fighting foreclosure), and costly for the lender, but this is nothing new - except that GMAC must not have been paying attention!
The best reporting on the GMAC story comes from 2007 (just change the name of the lender) - and you can learn all about affidavits from Tanta's posts:
And what Tanta wrote in 2007 applies to the GMAC stories:
To summarize: there were dollars on the table encouraging secondary market participants to get real sloppy. ... The big news here is that the true cost of doing business is belatedly showing up. I happen to think that's a more important story than was originally reported.Another amazing story is that three years later all these lenders haven't realized how sloppy the original work was!
Note that all of these stories were for non-GSE lenders and/or loans that were in private label MBS. These guys tried to cut corners everywhere, and they are now paying the price for being sloppy. They deserve to be ridiculed ...
Links on Lawrence Summers' Departure
by Calculated Risk on 9/21/2010 06:50:00 PM
From the White House: Dr. Lawrence H. Summers, Director of the National Economic Council, to Return to Harvard University at the End of the Year
From Bloomberg: Summers to Leave White House After Election
From the NY Times: Top White House Economic Adviser to Depart
This is quite a turnover: Christina Romer, Peter Orszag, and now Lawrence Summers. I expect Treasury Secretary Timothy Geithner will stay on (just a guess) - and I have no idea who will replace Summers.
Paving the Way for QE2
by Calculated Risk on 9/21/2010 03:44:00 PM
Fed Chairman Ben Bernanke suggested in his August 27th speech at Jackson Hole that additional easing would probably require “significant weakening of the outlook” or a meaningful decline in inflation expectations (or further disinflation).
The change to the FOMC statement today on inflation suggests the second criteria might have been met:
"Measures of underlying inflation are currently at levels somewhat below those the Committee judges most consistent, over the longer run, with its mandate to promote maximum employment and price stability."This was a significant downgrade from the statement last month:
"Measures of underlying inflation have trended lower in recent quarters ..."The FOMC and staff forecasts will be presented next month (Note: earlier I thought it might be today), and these forecasts will probably be revised down again. That will probably meet the "significant weakening of the outlook" criteria.
Also - the two key economic releases between now and the two day meeting on November 2nd and 3rd are the September employment report (to be released on October 8th) and the Q3 GDP advance estimate (to be released on October 29th). Barring a significant upside surprise in one or both of those reports, it appears QE2 might arrive as early as November.
This statement today was pretty clear: The FOMC "is prepared to provide additional accommodation if needed to support the economic recovery and to return inflation, over time, to levels consistent with its mandate."
FOMC Statement: "Prepared to provide additional accommodation "
by Calculated Risk on 9/21/2010 02:15:00 PM
Paving the way for QE2 ...
From the Fed:
Information received since the Federal Open Market Committee met in August indicates that the pace of recovery in output and employment has slowed in recent months. Household spending is increasing gradually, but remains constrained by high unemployment, modest income growth, lower housing wealth, and tight credit. Business spending on equipment and software is rising, though less rapidly than earlier in the year, while investment in nonresidential structures continues to be weak. Employers remain reluctant to add to payrolls. Housing starts are at a depressed level. Bank lending has continued to contract, but at a reduced rate in recent months. The Committee anticipates a gradual return to higher levels of resource utilization in a context of price stability, although the pace of economic recovery is likely to be modest in the near term.
Measures of underlying inflation are currently at levels somewhat below those the Committee judges most consistent, over the longer run, with its mandate to promote maximum employment and price stability. With substantial resource slack continuing to restrain cost pressures and longer-term inflation expectations stable, inflation is likely to remain subdued for some time before rising to levels the Committee considers consistent with its mandate.
The Committee will maintain the target range for the federal funds rate at 0 to 1/4 percent and continues to anticipate that economic conditions, including low rates of resource utilization, subdued inflation trends, and stable inflation expectations, are likely to warrant exceptionally low levels for the federal funds rate for an extended period. The Committee also will maintain its existing policy of reinvesting principal payments from its securities holdings.
The Committee will continue to monitor the economic outlook and financial developments and is prepared to provide additional accommodation if needed to support the economic recovery and to return inflation, over time, to levels consistent with its mandate.
Voting for the FOMC monetary policy action were: Ben S. Bernanke, Chairman; William C. Dudley, Vice Chairman; James Bullard; Elizabeth A. Duke; Sandra Pianalto; Eric S. Rosengren; Daniel K. Tarullo; and Kevin M. Warsh.
Voting against the policy was Thomas M. Hoenig, who judged that the economy continues to recover at a moderate pace. Accordingly, he believed that continuing to express the expectation of exceptionally low levels of the federal funds rate for an extended period was no longer warranted and will lead to future imbalances that undermine stable long-run growth. In addition, given economic and financial conditions, Mr. Hoenig did not believe that continuing to reinvest principal payments from its securities holdings was required to support the Committee’s policy objectives.
FOMC Preview
by Calculated Risk on 9/21/2010 12:25:00 PM
In general I think little will change in the FOMC statement this month.
Update: The FOMC (and staff) will present their updated forecasts in November, but the forecasts will not be available until the minutes are released. Since the previous forecasts were too optimistic (see table below1), it is very likely their new forecasts will be are lower - but it is unclear if this will be mentioned in the statement today.
In a research note yesterday, Goldman Sachs suggested the following four possibilities (from "dovish" to "hawkish"):
1. No substantive change in the policy statement.Goldman's view is the focus would be on #2 and #3. I think #4 is off the table for now, and #1 is still a possibility.
2. Recognition of a weaker economic outlook, but without an explicit signal that renewed unconventional easing is under consideration.
3. An explicit signal that renewed easing is under consideration.
4. An announcement of renewed easing.
1Here are the forecasts from the June 22-23, 2010 (and May 9th) FOMC meeting. The Fed revised down their forecasts in June, but they were still too optimistic:
| Economic projections of Federal Reserve Governors and Reserve Bank presidents | |||
|---|---|---|---|
| 2010 | 2011 | 2012 | |
| Change in Real GDP | 3.0% to 3.5% | 3.5% to 4.2% | 3.5% to 4.5% |
| April projection | 3.2% to 3.7% | 3.4% to 4.5% | 3.5% to 4.5% |
| Unemployment Rate | 9.2% to 9.5% | 8.3% to 8.7% | 7.1% to 7.5% |
| April projection | 9.1% to 9.5% | 8.1% to 8.5% | 6.6% to 7.5% |
| PCE Inflation | 1.0% to 1.1% | 1.1% to 1.6% | 1.0% to 1.7% |
| April projection | 1.2% to 1.5% | 1.1% to 1.9% | 1.2% to 2.0% |
State Unemployment Rates in August: "Little changed" from July
by Calculated Risk on 9/21/2010 10:00:00 AM
 Click on graph for larger image in new window.
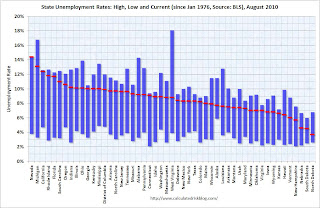
This graph shows the high and low unemployment rates for each state (and D.C.) since 1976. The red bar is the current unemployment rate (sorted by the current unemployment rate).
Thirteen states now have double digit unemployment rates (up from eleven last month). A number of other states are close.
Nevada set a new series high at 14.4% and now has the highest state unemployment rate. Michigan held the top spot for over 4 years until May.
From the BLS: Regional and State Employment and Unemployment Summary
Regional and state unemployment rates were little changed in August. Twenty-seven states recorded unemployment rate increases, 13 states registered rate decreases, and 10 states and the District of Columbia had no rate change, the U.S. Bureau of Labor Statistics reported today.
...
Nevada again reported the highest unemployment rate among the states, 14.4 percent in August, which was a new series high for the state. (All region, division, and state series begin in 1976.) The states with the next highest rates were Michigan, 13.1 percent, and California, 12.4 percent. North Dakota continued to register the lowest jobless rate, 3.7 percent, followed by South Dakota and Nebraska, at 4.5 and 4.6 percent, respectively.
emphasis added
Single Family Housing Starts increase slightly in August
by Calculated Risk on 9/21/2010 08:30:00 AM
 Click on graph for larger image in new window.
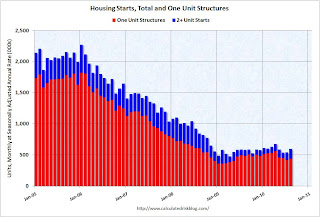
Total housing starts were at 598 thousand (SAAR) in August, up 10.5% from the revised July rate of 541 thousand (revised down from 546 thousand), and up 25% from the all time record low in April 2009 of 477 thousand (the lowest level since the Census Bureau began tracking housing starts in 1959).
Single-family starts increased 4.3% to 438 thousand in August. This is 22% above the record low in January 2009 (360 thousand). 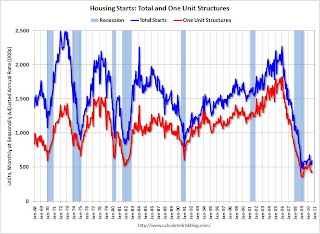 The second graph shows total and single unit starts since 1968. This shows the huge collapse following the housing bubble, and that housing starts have mostly been moving sideways for over a year - with a slight up and down over the last several months due to the home buyer tax credit.
Here is the Census Bureau report on housing Permits, Starts and Completions.
Housing Starts:This was above expectations of 550 thousand, mostly because of the volatile multi-family starts. As I've mentioned many times - this low level of starts is good news for the housing market longer term (there are too many housing units already), but bad news for the economy and employment short term.
Privately-owned housing starts in August were at a seasonally adjusted annual rate of 598,000. This is 10.5 percent (±11.9%)* above the revised July estimate of 541,000 and is 2.2 percent (±9.7%)* above the August 2009 rate of 585,000.
Single-family housing starts in August were at a rate of 438,000; this is 4.3 percent (±12.4%)* above the revised July figure of 420,000.
Building Permits:
Privately-owned housing units authorized by building permits in August were at a seasonally adjusted annual rate of 569,000. This is 1.8 percent (±2.0%)* above the revised July rate of 559,000, but is 6.7 percent (±1.4%) below the August 2009 estimate of 610,000.
Single-family authorizations in August were at a rate of 401,000; this is 1.2 percent (±1.0%) below the revised July figure of 406,000.
Monday, September 20, 2010
Flash Crash Report due in the next two weeks
by Calculated Risk on 9/20/2010 09:40:00 PM
From Graham Bowley at the NY Times: Ex-Physicist Leads Inquiry into Flash Crash
[The] long-awaited report on the so-called flash crash, in partnership with the Commodity Futures Trading Commission, is due to be published in the next two weeks.Hopefully the explanation will be clear and understandable.
...
[The SEC's Gregg Berman says] the report will zero in on a specific sequence of events that preceded the crash. He says it will tell a clear story about what happened in the markets on that stomach-churning day, beyond simply pointing a finger at the perils of the kind of high-speed computer trading that dominates today’s markets.
“The report will clearly demonstrate how market conditions and events prior to the flash crash led to the extreme price moves,” he said.
...
“Many market participants told us, ‘We’re not quite sure what happened over all, but this is what my firm saw and the actions we took,’ ” Mr. Berman said. “It was like ‘C.S.I.’ We wanted to interview everyone around.”
Europe Update: European Financial Stability Facility rated AAA
by Calculated Risk on 9/20/2010 04:17:00 PM
The European bailout fund, called the European Financial Stability Facility (EFSF), received the expected AAA rating today.
From the NY Times: European Bailout Fund Gets Top Rating From Credit Agencies
The European Financial Stability Facility, as the fund is known, was rated AAA by Moody’s Investors Service, Standard & Poor’s and Fitch Ratings. Standard & Poor’s said its understanding was that “guarantees from member governments supporting the repayment of E.F.S.F. obligations will be unconditional, irrevocable and timely, and thereby consistent with our criteria for sovereign guarantees.”The facility will not be "pre-funded", but will only raise funds when a member state asks for help.
The ratings are preliminary because no member state has yet called on the facility for help, and it has thus issued no debt.
Key European analysts had expected that countries would wait until the rating was secured before asking for help. Now there is a focus on Ireland and Portugal - the two countries most likely to ask for help in the near term.
The yields for Ireland and Portugal 10 year bonds are now above the crisis levels back in May.
And from Bloomberg: Honohan Says Irish Government Must Cut Deficit at Faster Pace
The extra yield that investors demand to hold 10-year Irish bonds over German bunds today exceeded 400 basis points for the first time as the government struggles to convince investors it can cap the cost of bailing out its banking system. Portugal is also being punished by investors, with the spread on its bonds also touching a record today. That’s fueling concerns that both countries may have to follow Greece and ask the European Union and the International Monetary Fund for a rescue.And something else to watch from the WSJ: ECB Steps Up Its Bond Buys Amid Worries
“We think there is a measurable risk that Ireland and Portugal will access the EFSF and IMF, but probably only early next year,” Goldman Sachs Group Inc. Chief European Economist Erik Nielsen said in a note yesterday.
The European Central Bank has increased its purchases of government bonds amid rising concerns in financial markets about the ability of Greece, Ireland and Portugal to repay their debts.
...
Bond buys by the ECB, though higher in recent weeks than during much of the summer, are still a fraction of what they were when the program started.
Moody's: Commercial Real Estate Price Index declined 3.1% in July
by Calculated Risk on 9/20/2010 01:08:00 PM
Moody's reported today that the Moody’s/REAL All Property Type Aggregate Index declined 3.1% in July. This is a repeat sales measure of commercial real estate prices.
Below is a comparison of the Moodys/REAL Commercial Property Price Index (CPPI) and the Case-Shiller composite 20 index.
Notes: Beware of the "Real" in the title - this index is not inflation adjusted. Moody's CRE price index is a repeat sales index like Case-Shiller - but there are far fewer commercial sales - and that can impact prices. Click on graph for larger image in new window.
CRE prices only go back to December 2000.
The Case-Shiller Composite 20 residential index is in blue (with Dec 2000 set to 1.0 to line up the indexes).
It is important to remember that the number of transactions is very low and there are a large percentage of distressed sales.
NBER: Recession ended in June 2009
by Calculated Risk on 9/20/2010 11:31:00 AM
From NBER: NBER Business Cycle Dating Committee Announces Trough Date
The Business Cycle Dating Committee of the National Bureau of Economic Research ... determined that a trough in business activity occurred in the U.S. economy in June 2009. The trough marks the end of the recession that began in December 2007 and the beginning of an expansion. The recession lasted 18 months, which makes it the longest of any recession since World War II.This is somewhat subjective - and I thought they'd wait longer because the committee usually waits until some of the key indicators have returned to pre-recession levels. This time no indicator has reached the pre-recession level, and some are still very low (like personal income less transfer payments).
In determining that a trough occurred in June 2009, the committee did not conclude that economic conditions since that month have been favorable or that the economy has returned to operating at normal capacity. Rather, the committee determined only that the recession ended and a recovery began in that month. A recession is a period of falling economic activity spread across the economy, lasting more than a few months, normally visible in real GDP, real income, employment, industrial production, and wholesale-retail sales. The trough marks the end of the declining phase and the start of the rising phase of the business cycle. Economic activity is typically below normal in the early stages of an expansion, and it sometimes remains so well into the expansion.
The committee decided that any future downturn of the economy would be a new recession and not a continuation of the recession that began in December 2007. The basis for this decision was the length and strength of the recovery to date.
NAHB Builder Confidence stuck at low level in September
by Calculated Risk on 9/20/2010 10:00:00 AM
The National Association of Home Builders (NAHB) reports the housing market index (HMI) was at 13 in September. This is the same low level as in August and below expectations. The record low was 8 set in January 2009, and 13 is very low ...
Note: any number under 50 indicates that more builders view sales conditions as poor than good. Click on graph for larger image in new window.
This graph compares the NAHB HMI (left scale) with single family housing starts (right scale). This includes the September release for the HMI and the July data for starts (August starts will be released tomorrow).
This shows that the HMI and single family starts mostly move in the same direction - although there is plenty of noise month-to-month.
Press release from the NAHB: Builder Confidence Unchanged in September
Builder confidence in the market for newly built, single-family homes held unchanged in September from the previous month's low level of 13, according to the latest National Association of Home Builders/Wells Fargo Housing Market Index (HMI), released today.
"In general, builders haven't seen any reason for improved optimism in market conditions over the past month," noted NAHB Chairman Bob Jones, a home builder from Bloomfield Hills, Mich. "If anything, consumer uncertainty has increased, and builders feel their hands are tied until potential home buyers feel more secure about the job market and economy."
"The stall in the nation's housing market continues," agreed NAHB Chief Economist David Crowe. "Builders report that the two leading obstacles to new-home sales right now are consumer reluctance in the face of the poor job market and the large number of foreclosed properties for sale."
Over 50 and Unemployed: Will they ever work again?
by Calculated Risk on 9/20/2010 08:33:00 AM
From Mokoto Rich at the NY Times: For the Unemployed Over 50, Fears of Never Working Again (ht Ann)
Of the 14.9 million unemployed, more than 2.2 million are 55 or older. Nearly half of them have been unemployed six months or longer, according to the Labor Department. The unemployment rate in the group — 7.3 percent — is at a record, more than double what it was at the beginning of the latest recession.It is hard for people in their 50s to change careers, or rebuild their savings after a long period of unemployment. And, as in the story, they may end up taking Social Security early - just to get by - and that means they will receive a significantly lower monthly payout than if they waited until 66. A very tough situation.
After other recent downturns, older people who lost jobs fretted about how long it would take to return to the work force and worried that they might never recover their former incomes. But today, because it will take years to absorb the giant pool of unemployed at the economy’s recent pace, many of these older people may simply age out of the labor force before their luck changes.
Sunday, September 19, 2010
FT: Junk bond prices hit pre-crisis levels
by Calculated Risk on 9/19/2010 08:47:00 PM
From the Financial Times: Junk bond prices hit pre-crisis levels
Strong investor demand for junk bonds has pushed the average price on such corporate debt to its highest level since June 2007, when companies could borrow with ease at the height of the credit boom.And from the WSJ: Bond Markets Get Riskier
except with permission
Bond markets are growing riskier as investors seeking steady returns bid up prices and ignore some early warning signs similar to those that flashed during the credit bubble.This seems like investors chasing yield - and that is making it easy to sell junk bonds. Oh well ...
Last week, prices on high-yield, or junk, bonds, hit their highest level since 2007, nearly double their lows of the credit crisis. Nine months into the year, companies have sold $172 billion in junk bonds, already an annual record, according to data provider Dealogic.
Weekly Schedule for September 19th
by Calculated Risk on 9/19/2010 02:45:00 PM
Note: The previous post is a summary of last week with graphs.
Four key housing reports will be released this week: the September homebuilder confidence survey (Monday), August housing starts (Tuesday), August existing home sales (Thursday), and August new home sales (Friday). Also the FOMC meets on Tuesday.
Making Home Affordable Program (HAMP) for August and the “Housing Scorecard”
Moody's/REAL Commercial Property Price Index (CPPI) for July.
10 AM: The September NAHB homebuilder survey. This index collapsed following the expiration of the home buyer tax credit. The consensus is for a slight increase to 14 from 13 in August (still very depressed).
8:30 AM: Housing Starts for August. Housing starts also collapsed following the expiration of the home buyer tax credit. The consensus is for a slight increase to 550K (SAAR) in August from 546K in July.
10:00 AM: the BLS will release the Regional and State Employment and Unemployment report for August.
2:15 PM: The FOMC statement will be released. I don't expect any significant changes to the statement compared to the statement following the August meeting.
Early: The AIA's Architecture Billings Index for August will be released (a leading indicator for commercial real estate). This has been showing ongoing contraction, and usually this leads investment in non-residential structures (hotels, malls, office) by 9 to 12 months.
7:00 AM: The Mortgage Bankers Association (MBA) will release the mortgage purchase applications index. This index declined sharply following the expiration of the tax credit, and the index has only recovered slightly over the last couple months - suggesting reported home sales through at least October will be very weak.
10:00 AM: 10:00 FHFA House Price Index for July. This is based on GSE repeat sales and is no longer as closely followed as Case-Shiller (or CoreLogic).
8:30 AM: The initial weekly unemployment claims report will be released. Consensus is for about the same as last week (450 thousand).
10:00 AM: Existing Home Sales for August from the National Association of Realtors (NAR). The consensus is for an increase to 4.1 million (SAAR) in August from 3.83 million in July. Housing economist Tom Lawler is projecting 4.1 million SAAR. In addition to sales, the level of inventory and months-of-supply will be very important (since months-of-supply impacts prices).
10:00 AM: Conference Board's index of leading indicators for August. The consensus is for a 0.1% increase in this index.
1:00 PM ET: Former Fed Chairman Paul A. Volcker gives the Keynote address at the Chicago Fed and IMF Thirteenth Annual International Banking Conference
8:30 AM: Durable Goods Orders for August from the Census Bureau. The consensus is for a 1.0% decline in durable good orders.
10:00 AM: New Home Sales for August from the Census Bureau. The consensus is for a slight increase in sales to 290K (SAAR) in August from 276K in July.
1:00 PM: Richmond Fed President Jeffrey Lacker speaks on the economic outlook at the 2010 Kentucky Economic Association Annual Conference
4:30 PM: Fed Chairman Ben Bernanke speaks at the Conference Co-sponsored by the Center for Economic Policy Studies and the Bendheim Center for Finance, Princeton University, Princeton, N.J: "Implications of the Financial Crisis for Economics"
After 4:00 PM: The FDIC will probably have another busy Friday afternoon ...
Summary for week ending Sept 18th
by Calculated Risk on 9/19/2010 10:30:00 AM
A summary of last week - mostly in graphs:
From the Fed: Industrial production and Capacity Utilization
Industrial production rose 0.2 percent in August after a downwardly revised increase of 0.6 percent in July [revised down from 1.0 percent]. ... The capacity utilization rate for total industry rose to 74.7 percent, a rate 4.7 percentage points above the rate from a year earlier and 5.9 percentage points below its average from 1972 to 2009.
 Click on graph for larger image in new window.
This graph shows Capacity Utilization. This series is up 9.6% from the record low set in June 2009 (the series starts in 1967).
Capacity utilization at 74.7% is still far below normal - and well below the the pre-recession levels of 81.2% in November 2007. (Note: this is actual a decrease before the revision to July)
Note: y-axis doesn't start at zero to better show the change.
 The second graph shows industrial production since 1967.
This is the highest level for industrial production since Oct 2008, but production is still 7.2% below the pre-recession levels at the end of 2007.
The increase in August was about consensus, however the sharp downward revision to July puts this below consensus.
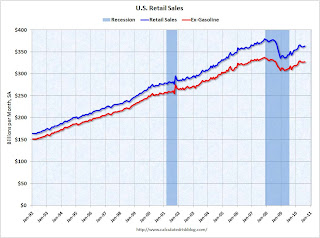 On a monthly basis, retail sales increased 0.4% from July to August (seasonally adjusted, after revisions), and sales were up 3.6% from August 2009. Retail sales increased 0.6% ex-autos.
 This graph shows retail sales since 1992. This is monthly retail sales, seasonally adjusted (total and ex-gasoline).
Retail sales are up 8.4% from the bottom, but still off 4.3% from the pre-recession peak.
Retail sales are still below the April level - and have mostly moved sideways for six months.
From CoreLogic: CoreLogic Home Price Index Remained Flat in July
 This graph shows the national CoreLogic HPI data since 1976. January 2000 = 100.
The index is flat over the last year, and off 28% from the peak.
The index is 6.1% above the low set in March 2009, and I expect to see a new post-bubble low for this index later this year or early in 2011.
 Press Release: August PCI Decline Signals Struggling Economy, but no Double-Dip
This graph shows the index since January 1999.
This is a new index, and doesn't have much of a track record in real time, although the data appears to suggest that the recovery has slowed - even stalled - over the last 4 months.
The Cleveland Fed has released the median CPI:
According to the Federal Reserve Bank of Cleveland, the median Consumer Price Index rose 0.1% (0.6% annualized rate) in August. The 16% trimmed-mean Consumer Price Index increased 0.1% (1.2% annualized rate) during the month.
...
Over the last 12 months, the median CPI rose 0.5%, the trimmed-mean CPI rose 0.9%, the CPI rose 1.1%, and the CPI less food and energy rose 0.9%.
 Click on graph for larger image in new window.
This graph shows three measure of inflation, Core CPI, Median CPI (from the Cleveland Fed), and 16% trimmed CPI (also from Cleveland Fed).
They all show that inflation has been falling, and that measured inflation is up less than 1% year-over-year. Core CPI was flat, and median CPI and the 16% trimmed mean CPI were up 0.1% in August.
Best wishes to all.
Hubbard and Mayer recycle Morgan Stanley's housing proposal
by Calculated Risk on 9/19/2010 07:25:00 AM
Let me start with an excerpt from Chirs Mayer and Todd Sinai's piece in Sept 2005: Bubble Trouble? Not Likely
Chicken Littles have squawked that the sky -- or the ceiling -- is about to fall on the housing market. ... Yet basic economic logic suggests that this apparent evidence of a bubble is anything but. Even in the highest-price cities, housing is, at most, slightly more expensive than average.And from Glenn Hubbard on Face the Nation in August, 2005
I don't think we're likely to see a large nominal price collapse, that is largely falling house prices, but I think we'll see much slower rates of growth in house prices after 2005.Since I was one of those "Chicken Littles", I'm curious how those views on housing worked out?
And now Glenn Hubbard and Chris Mayer recycle the poorly conceived Morgan Stanley proposal: How Underwater Mortgages Can Float the Economy
[W]e propose a new program through which the federal government would direct the public and quasi-public entities that guarantee mortgages — Fannie Mae, Freddie Mac, Ginnie Mae, the Department of Veterans Affairs loan-guarantee program and the Federal Housing Administration — to make it far easier and quicker for homeowners to refinance.At least they mention the existing refinance programs already in place (that was an improvement on MS)!
This program would be simple: the agencies would direct loan servicers — the middlemen who monitor and report loan payments — to send a short application to all eligible borrowers promising to allow them to refinance with minimal paperwork. Servicers would receive a fixed fee for each mortgage they refinanced, which would be rolled into the mortgage to eliminate costs to taxpayers.
But the rest of Tom Lawler's criticism still holds: “Slam-Dunk” Stimulus? MS = Missing Something!!!!


