 RSS Feed
 by Calculated Risk on 8/13/2010 08:10:00 PM
Friday, August 13, 2010
Bank Failure #110: Palos Bank and Trust Company, Palos Heights, Illinois
Friday the thirteenth has come
Unlucky indeed!
by Soylent Green is People
From the FDIC: First Midwest Bank, Itasca, Illinois, Assumes All of the Deposits of Palos Bank and Trust Company, Palos Heights, Illinois
As of June 30, 2010, Palos Bank and Trust Company had approximately $493.4 million in total assets and $467.8 million in total deposits. ... The FDIC estimates that the cost to the Deposit Insurance Fund (DIF) will be $72.0 million. Compared to other alternatives, First Midwest Bank's acquisition was the least costly resolution for the FDIC's DIF. Palos Bank and Trust Company is the 110th FDIC-insured institution to fail in the nation this year, and the fourteenth in Illinois. The last FDIC-insured institution closed in the state was Ravenswood Bank, Chicago, on August 6, 2010.It is Friday!
LA Port Traffic: Imports increase, Exports Flat
by Calculated Risk on 8/13/2010 05:21:00 PM
This data last month gave the first hint of the sharp increase in the U.S. trade deficit in June.
Notes: this data is not seasonally adjusted. There is a very distinct seasonal pattern for imports, but not for exports. LA area ports handle about 40% of the nation's container port traffic.
The following graph shows the loaded inbound and outbound traffic at the ports of Los Angeles and Long Beach in TEUs (TEUs: 20-foot equivalent units or 20-foot-long cargo container). Although containers tell us nothing about value, container traffic does give us an idea of the volume of goods being exported and imported. Click on graph for larger image in new window.
Loaded inbound traffic was up 26% compared to July 2009. Inbound traffic is now up 4% vs. two years ago (July '08).
Loaded outbound traffic was up 10% from July 2009. Exports were off almost 4% from May 2010. Unlike imports, exports are still off from 2 years ago (off 17%).
For imports there is usually a significant dip in either February or March, depending on the timing of the Chinese New Year, and then usually imports increase until late summer or early fall as retailers build inventory for the holiday season. So part of this increase in July imports is just the normal seasonal pattern.
Based on this data, it appears the trade deficit with Asia increased again in July. Not only have the pre-crisis global imbalances returned, but the flat line in exports, after declining in June, is concerning (there is no clear seasonal pattern for exports).
Double Dip Debate
by Calculated Risk on 8/13/2010 03:40:00 PM
From CNBC: US 'Virtually Certain' to Fall Into A New Recession: Rosenberg
The risks of a double-dip recession—if we ever got out of the first one—are actually a lot higher than people are talking about right now," [David Rosenberg, chief economist at Gluskin Sheff] said. "I think that it's almost a foregone conclusion, a virtual certainty."And here is an interview today of Rosenberg at the WSJ: The Big Interview with David Rosenberg
In an interview with WSJ's Kelly Evans, Gluskin Sheff's Chief Economist David Rosenberg warned that the chances of a double-dip recession are greater than 50-50 and that the recession may not have ended last year at all.And Neil Irwin at the WaPo has a summary of a Goldman Sachs research note by Ed McKelvey: Goldman Sachs economists: No double dip (probably)
"We think a double dip [recession] has a meaningful probability--25 to 30% in our estimation--but it is not in our base case. A big reason for this judgment is that several key components of private-sector activity have already fallen to levels that are quite low relative to historical averages or underlying fundamentals."I've made a number of the same arguments as McKelvey ... I noted that "usually a recession (or double-dip) is preceded by a sharp decline in Residential Investment (housing is the best leading indicator for the business cycle), and it [is] hard for RI to fall much further" and on the personal saving rate, I noted "most of the drag from a rising saving rate appears to be behind us".
"We note the following five sources of protection against a renewed downturn in economic activity--areas where we think the scope for further downside to US real GDP is limited."
I think we will avoid a technical double dip recession (or a continuation of the "great recession", see Recession Dating for the difference), but the odds are uncomfortably high - and it will probably feel like a recession to millions of Americans. It will be especially discouraging when the unemployment rate starts increasing again (I think that is likely) and when reported house prices start falling (very likely).
Social Security Benefits and Maximum Contribution Base: Probably No Increase for 2011
by Calculated Risk on 8/13/2010 12:17:00 PM
The BLS reported this morning that the Consumer Price Index for Urban Wage Earners and Clerical Workers (CPI-W) was at 213.898 in July. This means it is very likely there will no change to Social Security Benefits and the Maximum Contribution Base again this year.
Here is an explanation ...
The calculation dates have changed over time (see Cost-of-Living Adjustments), but the current calculation uses the average CPI-W1 for the three months in Q3 (July, August, September) and compares to the average for the highest previous average of Q3 months. Note: this is not the headline CPI-U.
 Click on graph for larger image in new window.
This graph shows CPI-W over the last ten years. The red lines are the Q3 average of CPI-W for each year.
The COLA adjustment is based on the increase from Q3 of one year from the highest previous Q3 average. So a 2.3% increase was announced in 2007 for 2008, and a 5.8% increase was announced in 2008 for 2009.
In Q3 2009, CPI-W was lower than in Q3 2008, so there was no change in benefits for 2010.
Even though there was no increase last year, and there will probably be no increase this year, those receiving benefits are still ahead because of the huge increase in Q3 2008.
For 2011, the calculation is not based on Q3 2010 over Q3 2009, but Q3 2010 over the highest preceding Q3 average ... the 215.495 in Q3 2008. This means CPI-W in Q3 2010 has to average above 215.495 or there will be no increase in Social Security benefits in 2011.
In July 2010, CPI-W was at 213.898, so CPI-W will have to average above 216.294 in August and September for the Q3 average to be at or above Q3 2008. That suggests an increase in COLA is very unlikely right now.
Contribution and Benefit Base
The law - as currently written - prohibits an increase in the contribution and benefit base if COLA is not greater than zero. However if the there is even a small increase in CPI-W, the contribution base will be adjusted using the National Average Wage Index.
From Social Security: Cost-of-Living Adjustment Must Be Greater Than Zero
... ... any amount that is directly dependent for its value on the COLA would not increase. For example, the maximum Supplemental Security Income (SSI) payment amounts would not increase if there were no COLA.This is based on a lag. If there had been an increase in COLA last year, the contribution and benefit base would have increased by about 2.3% based on the increase in wages from 2007 to 2008. The National Average Wage Index is not available for 2009 yet, but wages probably declined - but it probably won't matter for the maximum contribution base since COLA will probably be zero.
... if there were no COLA, section 230(a) of the Social Security Act prohibits an increase in the contribution and benefit base (Social Security's maximum taxable earnings), which normally increases with increases in the national average wage index. Similarly, the retirement test exempt amounts would not increase ...
To summarize (assuming no new legislation):
(1) CPI-W usually tracks CPI-U (headline number) pretty well. From the BLS:
The Bureau of Labor Statistics publishes CPIs for two population groups: (1)the CPI for Urban Wage Earners and Clerical Workers (CPI-W), which covers households of wage earners and clerical workers that comprise approximately 32 percent of the total population and (2) the CPI for All Urban Consumers (CPI-U) ... which cover approximately 87 percent of the total population and include in addition to wage earners and clerical worker households, groups such as professional, managerial, and technical workers, the self- employed, short-term workers, the unemployed, and retirees and others not in the labor force.
Reuters University of Michigan's Consumer Sentiment increases slightly in August
by Calculated Risk on 8/13/2010 09:59:00 AM
From Reuters: Consumer Sentiment Edges Up in August, More Than Expected
The slight pickup in sentiment follows a drop in July to the lowest level since November, the data from Thomson Reuters/University of Michigan's Surveys of Consumers showed.
The survey's preliminary August reading on the overall index on consumer sentiments rose to 69.6 from 67.8 in July ...
 Click on graph for larger image in new window.
Consumer sentiment is a coincident indicator - and this is further evidence of a sluggish economy.
Interesting - the survey's one-year inflation expectations increased to 2.8% even with very low measured inflation.
This was a big story last month when consumer sentiment collapsed to the lowest level since late 2009. Even with the slight increase, this is still at the levels of late last year.
Retail Sales increase 0.4% in July
by Calculated Risk on 8/13/2010 08:30:00 AM
On a monthly basis, retail sales increased 0.4% from June to July (seasonally adjusted, after revisions), and sales were up 5.5% from July 2009. Retail sales increased 0.2% ex-autos.  Click on graph for larger image in new window.
This graph shows retail sales since 1992.
This is monthly retail sales, seasonally adjusted (total and ex-gasoline).
Retail sales are up 8.1% from the bottom, but still off 4.5% from the pre-recession peak. The second graph shows the year-over-year change in retail sales (ex-gasoline) since 1993.
Retail sales ex-gasoline increased by 4.8% on a YoY basis (5.5% for all retail sales). The year-over-year comparisons are easy now since retail sales collapsed in late 2008.
Here is the Census Bureau report:
The U.S. Census Bureau announced today that advance estimates of U.S. retail and food services sales for July, adjusted for seasonal variation and holiday and trading-day differences, but not for price changes, were $362.7 billion, an increase of 0.4 percent (±0.5%)* from the previous month, and 5.5 percent (±0.5%) above July 2009. Total sales for the May through July 2010 period were up 5.9 percent (±0.3%) from the same period a year ago. The May to June 2010 percent change was revised from -0.5 percent (±0.5%)* to -0.3 percent (±0.2%).This was close to expectations.
Thursday, August 12, 2010
Krugman: Paralysis at the Fed
by Calculated Risk on 8/12/2010 11:01:00 PM
From Paul Krugman: Paralysis at the Fed
Ten years ago, one of America’s leading economists delivered a stinging critique of the Bank of Japan, Japan’s equivalent of the Federal Reserve, titled "Japanese Monetary Policy: A Case of Self-Induced Paralysis?" With only a few changes in wording, the critique applies to the Fed today.Here is a link to the 1999 paper by Bernanke - it is interesting reading.
At the time, the Bank of Japan faced a situation broadly similar to that facing the Fed now. The economy was deeply depressed and showed few signs of improvement, and one might have expected the bank to take forceful action. But short-term interest rates — the usual tool of monetary policy — were near zero and could go no lower. And the Bank of Japan used that fact as an excuse to do no more.
That was malfeasance, declared the eminent U.S. economist: “Far from being powerless, the Bank of Japan could achieve a great deal if it were willing to abandon its excessive caution and its defensive response to criticism.” He rebuked officials hiding “behind minor institutional or technical difficulties in order to avoid taking action.”
Who was that tough-talking economist? Ben Bernanke ...
More Europe: Greek Recession, Irish and Spanish Worries
by Calculated Risk on 8/12/2010 06:52:00 PM
The Greek economy contracted sharply in the second quarter ... The national statics service Ellsta said Thursday that second-quarter gross domestic product fell 1.5% on a quarterly basis, weaker than forecasts of a 1% drop and the 0.8% fall in the first quarter.GDP is reported on a quarterly basis (not annualized). In the U.S. that would be reported as a 6% decline.
Jobs data for May, meanwhile, revealed persistently high unemployment, which ticked higher to 12% from 11.9% in April.
Catalonia, which accounts for a fifth of Spanish gross domestic product, has been shut out of public bond markets since March and the extra yield it pays over national government debt has almost tripled this year. Galicia, in the northwest, has asked to freeze payments of debt it owes the central government and the Madrid region postponed a bond sale last month.
Spain’s regions, which borrowed at similar rates to the central government before the global credit crisis started in 2007, are key players in Zapatero’s drive to get his budget in order and push down the country’s borrowing costs. They control around twice as much spending as the state, employ more than half of all public workers and piled on debt during the recession.
Earlier this week, Ireland received European Commission approval for an additional €10 billion ($13 billion) in capital for state-owned Anglo Irish Bank, on top of the €14.3 billion the government has already injected into the bank. On Wednesday, Bank of Ireland, 36%-owned by the government, reported a pretax first-half loss nearly twice as big as its loss a year earlier.
The combination of events has made it more expensive for Ireland to borrow and driven the country's credit-default insurance costs 36% higher since the start of the month, to levels last seen just ahead of the European banking stress tests.
European Bond Spreads: Starting to rise again?
by Calculated Risk on 8/12/2010 03:26:00 PM
Here is a look at European bond spreads from the Atlanta Fed weekly Financial Highlights released today (graph as of Aug 11th): Click on graph for larger image in new window.
From the Atlanta Fed:
Peripheral European bond spreads (over German bonds) narrowed between the June and August FOMC meetings, though they were rising over the past week.As of today, the Greece-to-German spread has widened to 7.98% (peaked at over 8%) and the Ireland-to-German spread has increased to 2.88%.
Between the June and August FOMC meetings, the 10-year Greece-to-German bond spread has narrowed by 50 basis points (bps) (from 8.01% to 7.51%) through August 10, though it has risen by 12 bps in the past week. Similarly, with other European peripherals’ spreads, Portugal’s is lower by 54 bps during the period, and Spain’s is lower by 37 bps, though both are up from the week prior.
Note: The Atlanta Fed data is a couple days old. Nemo has links to the current data on the sidebar of his site.
Hotel Occupancy Rate at 70% last week
by Calculated Risk on 8/12/2010 01:02:00 PM
Hotel occupancy is one of several industry specific indicators I follow ...
From HotelNewsNow.com: STR: Economy segment leads weekly occupancy gains
Overall, the industry’s occupancy increased 6.7% to 70.2%, average daily rate rose 1.6% to US$99.13, and revenue per available room increased 8.4% to US$69.57.The following graph shows the four week moving average for the occupancy rate by week for 2008, 2009 and 2010 (and a median for 2000 through 2007).
 Click on graph for larger image in new window.
Notes: the scale doesn't start at zero to better show the change. The graph shows the 4-week average, not the weekly occupancy rate.
On a 4-week basis, occupancy is up 6.9% compared to last year (the worst year since the Great Depression) and 4.0% below the median for 2000 through 2007.
Just over half way back to normal, and almost back to the levels of 2008 (the occupancy rate started to fall off in the 2nd half of 2008).
NOTE: The supply of rooms in the survey is up just over 2% from last year. The increase in the occupancy rate is from an increase in demand - although this is still fairly weak (the 2nd half of 2008 was weak for hotels).
Data Source: Smith Travel Research, Courtesy of HotelNewsNow.com
Agenda for August 17th conference on the Future of Housing Finance
by Calculated Risk on 8/12/2010 11:46:00 AM
The Obama Administration announced the panelists and agenda for the August 17th conference: Conference on the Future of Housing Finance
This event will provide a forum for public input as the Administration continues its work developing a comprehensive housing finance reform proposal for delivery to Congress by January 2011.
Freddie Mac: 30 Year Mortgages Rates fall to series record low
by Calculated Risk on 8/12/2010 10:50:00 AM
From MarketWatch: Freddie Mac: Fixed-rate mortgages at record lows
Freddie Mac said Thursday the 30-year fixed-rate mortgage average fell to record low of 4.44% with an average 0.7 point for the week ending Aug. 12. In the previous period, the average was 4.49% ...This calls for a long term graph ...
 Click on graph for larger image in new window.
This graph shows the 30 year fixed rate mortgage interest rate based on the Freddie Mac survey since 1971.
The decline in mortgage rates is related to the weak economy and falling Treasury yields. Rates will probably fall again this week with the Ten Year Treasury yield down to 2.7%.
Note: this series only goes back to 1971. Mortgage rates were at or below 5% back in the 1950s.
Weekly Initial Unemployment Claims increase, Highest since February
by Calculated Risk on 8/12/2010 08:30:00 AM
The DOL reports on weekly unemployment insurance claims:
In the week ending Aug. 7, the advance figure for seasonally adjusted initial claims was 484,000, an increase of 2,000 from the previous week's revised figure of 482,000. The 4-week moving average was 473,500, an increase of 14,250 from the previous week's revised average of 459,250.
...
The advance number for seasonally adjusted insured unemployment during the week ending July 31 was 4,452,000, a decrease of 118,000 from the preceding week's revised level of 4,570,000.
 Click on graph for larger image in new window.
This graph shows the 4-week moving average of weekly claims since January 2000.
The four-week average of weekly unemployment claims increased this week by 14,250 to 473,500.
The dashed line on the graph is the current 4-week average. The 4-week average of initial weekly claims is at the highest level since February, and suggests further weakness in the labor market.
Wednesday, August 11, 2010
NY Times: Borrowers refuse to pay home equity loans
by Calculated Risk on 8/11/2010 10:50:00 PM
Some interesting anecdotes from David Streitfeld at the NY Times: Bad Debts Rise as Bust Erodes Home Equity
Lenders say they are trying to recover some of that money but their success has been limited, in part because so many borrowers threaten bankruptcy and the collateral in the homes backing the loans has often disappeared.
The result is one of the paradoxes of the recession: the more money you borrowed, the less likely you will have to pay up.
Cisco Comments: Mixed Signals, Recovery has slowed
by Calculated Risk on 8/11/2010 06:45:00 PM
A few excerpts from the Cisco Conference call (ht Brian):
“... there are some challenges that are contributing to an unusual amount of conservatism and even caution. In short, we see the same opportunities and challenges that you are reading about in regards to the market, those challenges ranging from GDP growth and future GDP projections continuing to flow in the US, job creation challenges, and concerns coming out of Europe just to mention a few. We are seeing a large number of mixed signals in both the market and from our customers' expectations, and we think the words unusual uncertainty are an accurate description of what is occurring. The Federal Reserve's comments yesterday that the pace and output of the recovery has slowed in recent months and that the recovery is likely to be more modest in the near term then has been anticipated just a few months ago, are comments that most of our large customers that I have talked with recently would agree with. Also, the same customers would agree with few exceptions that they still expect a very gradual return to more normal economic conditions.”Cisco's quarter ends July 31st, and they saw weakness in late June and into July that most of the other tech companies missed (most end Q2 on June 30th). Investment in equipment and software has been one of the strongest components of GDP, and Cisco's comments suggest this investment is slowing.
...
As has been our standing practice for some time, we are continuing to provide detailed quarterly guidance one quarter at a time. In light of the unusual uncertainty in the macro environment, including the comments we heard from the Federal Reserve yesterday, we encourage you to continue to model conservatively, especially in the short term. It is important that expectations do not get ahead of where the market is today. We do intend to budget in two halves for our fiscal year and will obviously be conservative, and we would suggest you do the same.
...
What are the areas that [we] have the most concern about? The answer for me this quarter is, I am concerned about what my customers are concerned about. And most of these customer concerns are centered on what they view as mixed signals in their business environment, therefore, their strategy in the short-term in terms of investments and projections for their businesses. As an example, the economy continues to be on the wild card in many customers' minds. We are all aware of GDP growth in the US slowing from 5% to 3.7% to 2.4% over the last three quarters. Many of the customers we talk with are anticipating growth of only 2% or so in the second half of the calendar year. Yet, at the same time, many of these same customers are seeing steadily improving results in their own companies. But when you press them on their comfort level to predict either of these trends over the next year, candidly many of them are not comfortable at all. This is this one of the many examples of today's uncertainty and environment that we are -- that is sending such mixed signals to us and others about the customer's capital spending and job creation intention over the next year. Another example of mixed signals would be our own product order pattern for Q4. On first review, the 23% year-over-year growth in product orders was obviously very strong, and the monthly results, which we tend to follow in terms of linearity, were well within our normal expectations in each of the three months in Q4. In fact, actually almost exactly on as a percentage of what we would have expected in each month. However, several of our customers shared with me that they saw a softening in their business in the second half of June and early July. Upon review, we saw a similar pattern of approximately four to five weeks from mid-June to mid-July where the normal order growth rates were off over 10 points versus our quarter's 23% average. Normally I would not have paid much attention to this, except this is the exact time period where we saw the challenges in Europe and the corresponding challenges in global stock markets. Then, just as the quarter had started in May, the end of July was very strong, well above average for the quarter in terms of year-over-year growth rates from an order perspective.
Ceridian-UCLA: Diesel Fuel index increases in July
by Calculated Risk on 8/11/2010 04:30:00 PM
This is the new UCLA Anderson Forecast and Ceridian Corporation index using real-time diesel fuel consumption data: Pulse of Commerce IndexTM
Press Release: PCI Climbs in July, Confirming Economy’s Slow but Steady Recovery
All signs continue to point to an economy in recovery with the latest release of the Ceridian-UCLA Pulse of Commerce Index™ (PCI) by UCLA Anderson School of Management. The July PCI climbed 1.7 percent after dropping 1.9 percent in June.
...
“The key takeaway from the July report is that the economy continues to recover – which is encouraging – but the pace needs to substantially pick up to put people back to work,” said Ed Leamer, chief PCI economist. “With the unemployment rate still at 9.5 percent and consumers understandably nervous about opening their wallets, it is hard to be very optimistic about economic growth. On the other hand, there is nothing about the PCI that is supportive of the pessimistic double-dip view.”
...
The PCI is based on an analysis of real-time diesel fuel consumption data from over the road trucking tracked by Ceridian ...
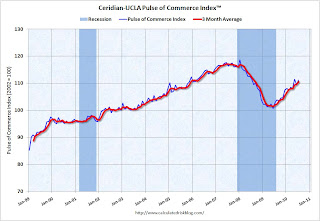 Click on graph for larger image in new window.
This graph shows the index since January 1999.
This is a new index and doesn't have much of a track record in real time - although it appears to suggest that the sluggish recovery was continuing in July.
NY Fed Plans to Buy $18 billion in Treasuries over the next month
by Calculated Risk on 8/11/2010 03:03:00 PM
This is a followup to the FOMC announcement yesterday ...
From the NY Fed: New York Fed releases tentative outright Treasury operation schedule
[T]he Desk plans to purchase approximately $18 billion. This is the amount of principal payments from agency debt and agency MBS expected to be received between mid-August and mid-September, adjusted for prior SOMA agency MBS purchases that have been allocated since August 4.The $18 billion will be spread over 9 purchases (one of TIPS), with duration of 2 to 30
Two Stories: More Homeowner Assistance for Unemployed, Q2 GDP likely to be Revised Down
by Calculated Risk on 8/11/2010 01:00:00 PM
A couple of stories ...
From HUD: Obama Administration Announces Additional Support for Targeted Foreclosure-Prevention Programs to Help Homeowners Struggling with Unemployment
Treasury’s Hardest Hit Fund Will Provide $2 Billion of Additional Assistance in 17 states and the District of Columbia; HUD to Launch a New $1 Billion Program to Help Unemployed Borrowers in Other AreasThis is an extension of a program announced in February to help the unemployed.
...
The program will work through a variety of state and non-profit entities and will offer a declining balance, deferred payment “bridge loan” (zero percent interest, non-recourse, subordinate loan) for up to $50,000 to assist eligible borrowers with payments on their mortgage principal, interest, mortgage insurance, taxes and hazard insurance for up to 24 months.
And from Catherine Rampell at the NY Times Economix: 2nd Quarter G.D.P. May Be Revised Even Lower
The government’s preliminary estimate for economic growth in the second quarter is likely to be revised substantially lower.
...
"Combining the bigger-than-expected trade deficit with other weak data suggests that Q2 growth was only 1.2 percent rather than the 2.4 percent originally estimated, placing the economy on even shakier ground than it seemed,” wrote Nigel Gault, chief United States economist at IHS Global Insight
BLS: Low Labor Turnover in June
by Calculated Risk on 8/11/2010 10:26:00 AM
From the BLS: Job Openings and Labor Turnover Summary
The number of job openings in June was 2.9 million, which was little changed from May. Although the month-to-month change is small, the number of job openings has risen by 599,000 (26 percent) since the most recent series trough of 2.3 million in July 2009. Even with the gains since July 2009, the number of job openings remained well below the 4.4 million open jobs when the recession began in December 2007...Note: The difference between JOLTS hires and separations is similar to the CES (payroll survey) net jobs headline numbers. The CES (Current Employment Statistics, payroll survey) is for positions, the CPS (Current Population Survey, commonly called the household survey) is for people.
The following graph shows job openings (purple), hires (blue), Total separations (include layoffs, discharges and quits) (red) and Layoff, Discharges and other (yellow) from the JOLTS.
Unfortunately this is a new series and only started in December 2000.
 Click on graph for larger image in new window.
Notice that hires (blue) and separations (red) are pretty close each month. In June, about 4.35 million people lost (or left) their jobs, and 4.25 million were hired (this is the labor turnover in the economy) for a loss of 97,000 jobs in June (this includes Census jobs lost).
When the hires (blue line) is above total separations, the economy is adding net jobs, when the blue line is below total separations (as in June), the economy is losing net jobs.
Note: The temporary Census hiring has distorted this series over the last few months.
The separations in June included the 225 thousand temporary Census 2010 jobs lost. Layoffs and discharges increased in June, but that is probably because of the temporary Census jobs. The number of job openings also decreased slightly in June, after increasing earlier this year.
The overall turnover, especially after removing the impact of the Census hiring, is still low.
Trade Deficit increases sharply in June
by Calculated Risk on 8/11/2010 08:30:00 AM
The Census Bureau reports:
[T]otal June exports of $150.5 billion and imports of $200.3 billion resulted in a goods and services deficit of $49.9 billion, up from $42.0 billion in May, revised.
 Click on graph for larger image.
The first graph shows the monthly U.S. exports and imports in dollars through June 2010.
Clearly imports are increasing much faster than exports. On a year-over-year basis, exports are up 17% and imports are up 29%. This is an easy comparison because of the collapse in trade at the end of 2008 and into early 2009.
The second graph shows the U.S. trade deficit, with and without petroleum, through June.
 The blue line is the total deficit, and the black line is the petroleum deficit, and the red line is the trade deficit ex-petroleum products.
The increase in the deficit in June was unrelated to oil as the trade gap with China increased to $26.15 billion in June - the highest level since October 2008 and up sharply from last year. Once again the imbalances have returned ...


