 RSS Feed
 by Calculated Risk on 6/17/2010 01:04:00 PM
Thursday, June 17, 2010
Have Residential Rents bottomed?
There is some evidence that apartment rents have bottomed ... at least temporarily.
The BLS reported this morning:
The shelter index increased for the first time since August 2009, rising 0.1 percent. The rise was mostly due to the index for lodging away from home, which increased 2.5 percent. The indexes for both rent and owners' equivalent rent were unchanged in May.The OER measure was up slightly and tends to lag other measures of rents.
Back in May, the NMHC reported that the market tightness index had increased sharply:
The Market Tightness Index, which measures changes in occupancy rates and/or rents, rose sharply from 38 to 81. This was the highest figure in nearly four years.There are some monthly private apartment data providers why say that rents have risen over the first 4 months of the year (on month-to-month basis, rents are still down year-over-year). They are reporting that the occupancy rate has risen slightly too.
...
“We saw a sharp increase in the Market Tightness Index, which fits with the surprisingly strong (for a seasonally weak period) effective rent growth.” [said NMHC Chief Economist Mark Obrinsky]
I spoke with a large apartment owner in Texas who told me they are seeing effective rents rising over the last few months.
I've also heard that the mood really changed at the NMHC meeting in May compared to the January meeting. There is a growing consensus among large apartment owners that rents have bottomed and the industry will rebound in 2011.
And from Dawn Wotapka the WSJ: Apartment Leases, Rents Pick Up
For the first time since the downturn, some of the nation's largest apartment-building landlords are reporting that rent declines have stopped and some are even boasting modest increases. Green Street Advisors, a real-estate research firm, says demand might have struck bottom in the first quarter ... From January through May, rents climbed 2.8% nationwide, according to Axiometrics, which tracks the national apartment market.This seems surprising given that REIS reported a record vacancy rate in Q1: "Nationally, the apartment vacancy rate stayed flat at 8%, the highest level since Reis Inc., a New York research firm, began its tally in 1980" and the Census Bureau reported the rental vacancy rate was at 10.6% in Q1, just below the all time high. Note: Reis is for large cities, the Census Bureau is nationwide.
Just something to be aware of ... rents could start falling again, but it does appear the slide has stopped for now - at least for the large apartment complexes.
Philly Fed Index "decreased notably" in June, Employment turned slightly negative
by Calculated Risk on 6/17/2010 10:00:00 AM
Here is the Philadelphia Fed Index released today: Business Outlook Survey.
The survey’s broadest measure of manufacturing conditions, the diffusion index of current activity, decreased notably from a reading of 21.4 in May to 8.0 in June. The index, which had edged higher for four consecutive months, fell back to its lowest reading in 10 months (see Chart). Although still positive and suggesting growth, indexes for new orders and shipments showed a mixed pattern this month — the new orders index increased 3 points, while the shipments index decreased 2 points. The current inventory index increased 13 points and moved back from a negative reading into positive territory, suggesting an increase in inventories this month.
Until this month, firms’ responses had been suggesting that labor market conditions were improving, but indexes for current employment and work hours were both slightly negative. For the first time in seven months, more firms reported a decrease in employment (18 percent) than reported an increase (17 percent).
emphasis added
 Click on graph for larger image in new window.
This graph shows the Philly index for the last 40 years.
The index has been positive for ten months now, but turned down "notably" in June.
This might suggest that growth in the manufacturing sector is slowing. Especially concerning is the slightly negative employment index.
Weekly Initial Unemployment Claims increase to 472,000
by Calculated Risk on 6/17/2010 08:34:00 AM
The DOL reports on weekly unemployment insurance claims:
In the week ending June 12, the advance figure for seasonally adjusted initial claims was 472,000, an increase of 12,000 from the previous week's revised figure of 460,000. The 4-week moving average was 463,500, a decrease of 500 from the previous week's revised average of 464,000.
...
The advance number for seasonally adjusted insured unemployment during the week ending June 5 was 4,571,000, an increase of 88,000 from the preceding week's revised level of 4,483,000.
 Click on graph for larger image in new window.
This graph shows the 4-week moving average of weekly claims since January 2000.
The four-week average of weekly unemployment claims decreased this week by 500 to 463,500 (the "decrease" was because last week was revised up).
The dashed line on the graph is the current 4-week average. Initial weekly claims first fell to this level in December 2009, and have been at the same level for about 6 months. The current level of 472,000 (and 4-week average of 463,500) is still high, and suggests ongoing weakness in the labor market.
Wednesday, June 16, 2010
Summary and Misc
by Calculated Risk on 6/16/2010 09:29:00 PM
A quick roundup ...
Remember MERS? From American Banker: Challenges to Foreclosure Docs Reach a Fever Pitch (ht Terry)
From HuffPost: Fannie Mae, Freddie Mac Shares To Be Pulled From NYSE (ht Paulo)
Homebuilder Toll Brothers warns: Demand Choppy, Sales Down
From CNBC: Europe Will Soon Publish Bank Stress Tests: ECB Official
Iceland: Court rules Foreign currency indexed loans illegal
From the NY Times: France and Spain Act to Rein in Budgets
From Bloomberg: Former Taylor Bean Chief Farkas Charged With Fraud
Lee Farkas, the former chairman of Taylor, Bean & Whitaker Mortgage Corp., was accused by the U.S. of helping run a more than $1.9 billion fraud scheme that unsuccessfully attempted to steal money from the government’s Troubled Asset Relief Program.From CNBC: More Than 90 Banks Miss TARP Payments (ht Scott, Ron)
 Click on graph for larger image in new window.
Total housing starts were at 593 thousand (SAAR) in May, down 10% from the revised April rate of 659,000 (revised down from 672 thousand), and up 24% from the all time record low in April 2009 of 477 thousand (the lowest level since the Census Bureau began tracking housing starts in 1959).
Single-family starts collapsed 17.2% to 468,000 in May.
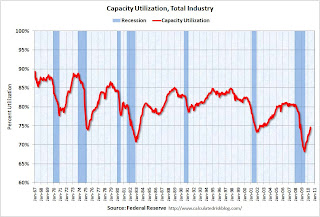 This graph shows Capacity Utilization. This series is up 9.4% from the record low set in June 2009 (the series starts in 1967).
 Capacity utilization at 73.7% is still far below normal - and 7.2% below the the pre-recession levels of 80.5% in November 2007.
Best to all.
Toll Brothers: Demand Choppy, Sales Down
by Calculated Risk on 6/16/2010 06:19:00 PM
Just a few weeks ago, new Toll CEO-designate Doug Yearley, Jr. noted:
"With demand increasing in many areas, we are very focused on growth."Uh, nevermind ...
From Toll today (ht Brian):
Joel H. Rassman, chief financial officer, stated: ... "While much of the attention surrounding the recent decline in housing indicators has focused on the expiration of the housing tax credit, we believe our customers' buying decisions have been driven more by consumer confidence than by the tax credit. As we noted in our second-quarter earnings press release of May 26, 2010, we believe the volatility in the financial markets and the high U.S. unemployment rate continue to weigh on the nation's psyche. Additionally, in the past several weeks, concerns about the financial crisis in Europe and escalating regional political tensions, coupled with worries about the oil spill in the Gulf of Mexico and its effects on the economy and the environment have negatively impacted the outlook of American consumers.Slightly ahead on a community bases - with 21% fewer communities. Do the math - they are running close to 20% below last year. And 40% below last year over the last three weeks (20% fewer deposits and 21% fewer communities).
"In the three weeks following our earnings conference call on May 26, 2010, our per-community deposits have been running about 20% behind the comparable period in last year's third quarter and our per-community traffic has been running about 3% behind. Thus, for the first six weeks of our FY 2010 third quarter beginning May 1, 2010, we are slightly ahead of last year's third-quarter pace of contracts signed on a per community basis. However, we have 21% fewer communities than one year ago.
"Although demand in recent weeks has been quite choppy, in general, we continue to believe that the housing market has emerged from its darkest period of late 2008 through early 2009. ... At the moment, consumers view the economic glass as half empty: volatile financial markets, global deficit concerns and the oil spill in the Gulf are all contributing to this gloom. We believe that once the employment picture begins to brighten and the economy stabilizes, consumer confidence will improve and the housing market should begin a steadier recovery."And there you have what might be the popular Q2 meme: blame the oil spill for poor results.
Iceland: Court rules Foreign currency indexed loans illegal
by Calculated Risk on 6/16/2010 04:44:00 PM
Here is a little different story ...
From The Iceland Weather Report: Foreign currency loans deemed illegal (ht Steinn)
The Icelandic supreme court ruled this afternoon that Icelandic loans indexed to a foreign currency are illegal.From The Reykjavík Grapevine: Supreme Court Rules Loans Pinned to Foreign Currency Illegal (ht Warlock)
This is hugely significant for thousands of people in this country.
Two cases were connected to the ruling involving car loans taken from the companies Lýsingu hf. and SP-fjármögnun that were pinned to foreign currency. With the collapse of the Icelandic crown in 2008, many people who took out such loans - at a time when the crown was strong - saw their debts double almost overnight.It was apparently pretty common in Iceland for car and some home loans to be indexed to a basket of foreign currencies. However when the Iceland Krona collapsed, the borrower was stuck with a much higher payment (and debt) than expected. Apparently many borrowers in eastern European countries also borrowed using these "basket of foreign currency" indexes.
Reader Warlock mentions that these loans appeared cheaper than other loans, and were frequently used to buy expensive foreign autos - and the financing was also from abroad. Just another risk for some banks, especially if this ruling spreads to other countries.
WaPo on Foreclosures and Deficiencies
by Calculated Risk on 6/16/2010 01:44:00 PM
From Dina ElBoghdady at the WaPo: Lenders go after money lost in foreclosures
Here is an excerpt:
Carlos Cortez and his wife['s] ... second lender came after them for $70,000 when their short sale was completed on his Manassas Park townhouse in 2008.Tanta (my former co-blogger an a mortgage banker) sent me an email about this in 2007:
Cortez knew that was a possibility, but he went through with the sale because his real estate agent said the lender was engaging in scare tactics.
James Scruggs, an attorney at Legal Services of Northern Virginia, said the lender appears to have backed off after Cortez argued that that the loan officer falsely qualified him and his wife for a home-equity line by fabricating key details about their finances.
Back in my day working for a servicer ... the absolute all time last possible thing you could get me to do is send an attorney barging into court demanding a deficiency judgment if I had any reason whatsoever to fear that my own effing loan officer was implicated in fraud on the original loan application. Any borrower with half a brain will raise that as a defense, and any judge even slightly awake will not only deny the deficiency but probably make the lender pay all costs, or worse. And I'd call that justice.It is unclear how often lenders are pursuing borrowers for deficiencies - but it is clearly happening more often now. This is one reason why people involved in short sales or considering "walking away" should consult an attorney. I suspect this is part of the reason for the recent surge in personal bankruptcy filings.
Spain, Germany agree to release bank "stress test" results
by Calculated Risk on 6/16/2010 12:41:00 PM
From the Financial Times: Spain to reveal bank ‘stress tests’ results
“The Bank intends to make public the results of these stress tests, showing estimated loan losses, the consequent capital requirements and the contribution of promised balance sheet reinforcements, so that the markets have a perfect understanding of the circumstances of the Spanish banking system,” [Miguel Angel Fernández Ordóñez, governor of the Bank of Spain, said on Wednesday].And from the Financial Times: Berlin agrees to release stress test results
excerpt with permission
The German government has dropped its resistance to publishing the results of bank stress tests ... A spokeswoman for the finance ministry said on Wednesday that Berlin was currently “co-ordinating” with its EU partners about how the results of existing annual stress tests could best be presented ...Transparency is helpful - although this might show a number of banks require additional capital. In the U.S., the government provided capital from TARP until the banks could raise private capital.
Note that the EU and the UK conduct annual stress tests - this is just an issue of making the results public. I think the U.S. should conduct annual stress tests of all the largest financial institutions, and make the economic scenarios and results public every year.
Industrial Production, Capacity Utilization increase in May
by Calculated Risk on 6/16/2010 09:25:00 AM
From the Fed: Industrial production and Capacity Utilization
Industrial production advanced 1.2 percent in May after having risen 0.7 percent in April. Manufacturing output climbed 0.9 percent last month, its third consecutive monthly gain of about 1 percent, and was 7.9 percent above its year-earlier level. Outside of manufacturing, the output of mines edged down 0.2 percent, and the output of utilities increased 4.8 percent. The jump in utilities reflected unseasonably warm temperatures that boosted air conditioning usage in May after uncharacteristically temperate weather in April reduced heating demand. ... The capacity utilization rate for total industry rose 1.0 percentage point to 74.7 percent, a rate 6.2 percentage points above the rate from a year earlier but 5.9 percentage points below its average from 1972 to 2009.
Click on graph for larger image in new window.This graph shows Capacity Utilization. This series is up 9.4% from the record low set in June 2009 (the series starts in 1967).
Capacity utilization at 73.7% is still far below normal - and 7.2% below the the pre-recession levels of 80.5% in November 2007.
Note: y-axis doesn't start at zero to better show the change.
 The second graph shows industrial production since 1967.
This is the highest level for industrial production since Nov 2008, but production is still 7.9% below the pre-recession levels at the end of 2007.
Still a long way to go.
Housing Starts plummet in May
by Calculated Risk on 6/16/2010 08:30:00 AM
 Click on graph for larger image in new window.
Total housing starts were at 593 thousand (SAAR) in May, down 10% from the revised April rate of 659,000 (revised down from 672 thousand), and up 24% from the all time record low in April 2009 of 477 thousand (the lowest level since the Census Bureau began tracking housing starts in 1959).
Single-family starts collapsed 17.2% to 468,000 in May. This is 30% above the record low in January 2009 (360 thousand). The second graph shows total and single unit starts since 1968. This shows the huge collapse following the housing bubble, and that housing starts have mostly been moving sideways for over a year.
Here is the Census Bureau report on housing Permits, Starts and Completions.
Housing Starts:Note that permits fell sharply, suggesting another significant decline in housing starts next month. This is way below expectations (I took the under!), and is good news for the housing market longer term (there are too many housing units already), but bad news for the economy and employment short term.
Privately-owned housing starts in May were at a seasonally adjusted annual rate of 593,000. This is 10.0 percent (±10.3%)* below the revised April estimate of 659,000, but is 7.8 percent (±9.7%)* above the May 2009 rate of 550,000.
Single-family housing starts in May were at a rate of 468,000; this is 17.2 percent (±7.9%) below the revised April figure of 565,000.
Building Permits:
Privately-owned housing units authorized by building permits in May were at a seasonally adjusted annual rate of 574,000. This is 5.9 percent (±2.2%) below the revised April rate of 610,000, but is 4.4 percent (±2.6%) above the May 2009 estimate of 550,000.
Single-family authorizations in May were at a rate of 438,000; this is 9.9 percent (±2.1%) below the revised April figure of 486,000. Authorizations of units in buildings with five units or more were at a rate of 117,000 in May.
MBA: Mortgage Purchase Applications increase slightly, near 13 Year Low
by Calculated Risk on 6/16/2010 07:11:00 AM
The MBA reports: Mortgage Applications Increase in Latest MBA Weekly Survey
The Refinance Index increased 21.1 percent from the previous week. This is the highest Refinance Index recorded in the survey since May 2009. The seasonally adjusted Purchase Index increased 7.3 percent from one week earlier, which is the first increase in six weeks.
...
“Mortgage applications for home purchases increased last week, the first increase in over a month. Refinance applications also picked up significantly over the week,” said Michael Fratantoni, MBA’s Vice President of Research and Economics. “While it is clear that purchase applications in May dropped sharply as a result of the tax credit induced increase in applications in April, it is unclear whether we are seeing the beginnings of a rebound now.”
...
The average contract interest rate for 30-year fixed-rate mortgages increased to 4.82 percent from 4.81 percent, with points decreasing to 0.89 from 1.02 (including the origination fee) for 80 percent loan-to-value (LTV) ratio loans.
 Click on graph for larger image in new window.
This graph shows the MBA Purchase Index and four week moving average since 1990.
The purchase index has collapsed following the expiration of the tax credit suggesting home sales will fall sharply too. This is the lowest level for 4-week average of the purchase index since February 1997.
Tuesday, June 15, 2010
Falling Euro impacts New York Real Estate market
by Calculated Risk on 6/15/2010 11:59:00 PM
From the WSJ: Currency Fall Curbs Europe's Taste for New York Property
Although there are no hard figures, the article mentions ab estimate of 15% to 20% of Manhattan condo buyers are Europeans. Apparently demand from European buyers has declined sharply.  Click on graph for larger image in new window.
This graph shows the price declines from the peak for each city included in S&P/Case-Shiller indices. Foreign buying - especially from Europeans because of the strong euro - was one of the reasons NY house prices had only fallen 21.1% from the peak.
With the weaker euro, and a substantial number of condos coming on the market later this year, prices will probably fall further in New York.
Short Sale: Agent "takes advantage" of Bank of America?
by Calculated Risk on 6/15/2010 09:28:00 PM
Jim the Realtor thinks Bank of America was taken on this deal. This 4,374 sq ft house, on two acres, is in a great location in Rancho Santa Fe (upscale San Diego). The loan was $3.2 million, and the short sale was for $1.575 million.
This was another "5 second" listing. Some agents list short sales for less than a minute to show the bank the listing ... and then keep the entire process secret. I've heard stories of sales to relatives, friends, or the listing agent just wanting both sides of the deal. If this was listed on the open market, Jim thinks it would have sold for substantially more.
SoCal Home sales at 4 Year High
by Calculated Risk on 6/15/2010 05:55:00 PM
From DataQuick: Southland sales at 4-year high
Note: as always I ignore the median price and use the repeat sales indexes from Case-Shiller and CoreLogic.
Southern California home sales rose last month in all but the lowest price categories as buyers took advantage of tax credits and low mortgage rates. ... A total of 22,270 new and resale houses and condos closed escrow in Los Angeles, Riverside, San Diego, Ventura, San Bernardino and Orange counties last month. That was up 9.7 percent from 20,299 in April, and up 7.2 percent from 20,775 in May 2009, according to MDA DataQuick of San Diego.And here is the dumb headline of the day: Southern California median home price surges 22.5% (ht JBR). So what? That just says the mix changed ... and that is because the distressed sales are moving on up to higher priced neighborhood.
May sales were the highest for that month since May 2006, but they still fell 15.0 percent short of the average number sold in May since 1988, when DataQuick’s statistics begin. The 9.7 percent increase in sales between April and May compares with an average change of 6 percent since 1988.
...
“The important thing to remember, though, is that what we saw in May was partly driven by government stimulus,” he continued. “In the second half of the year the market will have to stand on its own again, barring new forms of government involvement. Prices will be tested if there’s any sudden move by lenders to release a flood of distressed properties.”
Foreclosure resales accounted for 33.9 percent of the resale market last month, down from 36.4 percent in April and 49.8 percent a year earlier. The all-time high for foreclosure resales – homes that had been foreclosed on in the prior 12 months – was 56.7 percent in February 2009. Foreclosure resales have waned over the last year as lenders have channeled more distress into loan modifications and short sales.
...
Foreclosure activity remains high by historical standards but is lower than peak levels reached over the last two years.
What matter is this is probably the high point for sales this year. This report includes both new and existing home sales, and new home sales are counted when the contract is signed (peaked in April) and existing home sales are counted when the transaction closes (will peak in May or June).
Employment and Real GDP, Real GDI
by Calculated Risk on 6/15/2010 03:47:00 PM
Last night I excerpted from a speech by St Louis Fed President James Bullard. I noted that GDI might be more useful in measuring the recovery than GDP (they are conceptually equivalent).
As a followup to that post (and also to the previous post with the forecast from UCLA-Anderson's Ed Learmer), here are two graphs looking at payroll employment vs. the change in real GDP and real GDI.
At the bottom of this post are estimates of the unemployment rate in 12 months for several growth scenarios. Note: This is similar to Okun's relationship between GDP and unemployment.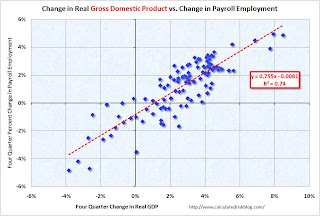 Click on graph for larger image.
The first graph shows the four quarter change in real GDP vs. the four quarter change in employment, as a percent of payroll employment (to normalize for changes in payroll over time).
The second graph shows the same relationship, but uses Gross Domestic Income instead of GDP. There is a clear relationship - the higher the change in the real GDP or real GDI, the larger the increase in payroll employment. The R2 for GDI is slightly higher than for GDP (0.80 vs. 0.74).
This shows that real GDP / real GDI has to grow at a sustained rate of about 1% just to keep the net change in payroll jobs at zero.
A 3% increase in real GDI (over a year) would lead to about a 1.4% increase in payroll employment. With approximately 130 million payroll jobs, a 1.4% increase in payroll employment would be just over 1.8 million jobs over the next year - and the unemployment rate would probably remain close to the current level (9.7%) depending on changes in population and the participation rate.
The following table summarizes several growth scenarios. The unemployment rate is from the household survey and depends on the number of people in the work force - so it cannot be calculated directly. The table uses a range of unemployment rates based on 1.6 to 2.1 million people entering the workforce over the next 12 months (a combination of population growth and discouraged workers reentering the work force).
NOTE: For those interested in understanding the differences between the household and establishment employment surveys - and why the unemployment rate cannot be calculated directly from the payroll report, see: Jobs and the Unemployment Rate
| Real Growth | Percent Payroll Growth | Annual Payroll Growth (000s) | Monthly Payroll Growth (000s) | Unemployment Rate in One Year1 |
|---|---|---|---|---|
| 6.0% | 3.6% | 4648 | 387 | 7.6% to 7.9% |
| 5.0% | 2.9% | 3718 | 310 | 8.2% to 8.5% |
| 4.0% | 2.1% | 2787 | 232 | 8.8% to 9.1% |
| 3.0% | 1.4% | 1857 | 155 | 9.4% to 9.7% |
| 2.0% | 0.7% | 926 | 77 | 10.0% to 10.3% |
| 1.0% | 0.0% | -4 | 0 | 10.6% to 10.9% |
| 1The unemployment rate is from the Household Survey and depends on several factors including changes in population and the participation rate. | ||||
I think Leamer is a little optimistic for 2010 - I'm expecting a 2nd half slowdown in GDP growth this year - and I think the unemployment rate will stay near the current level for some time.
UCLA's Leamer: "A Homeless Recovery"
by Calculated Risk on 6/15/2010 12:14:00 PM
From UCLA: UCLA Anderson Forecast: U.S. recovery a long, slow climb; Calif. recovery weaker than nation's
"If the next year is going to bring exceptional growth," [UCLA Anderson Forecast director Edward] Leamer writes, "consumers will need to express their optimism in the way that really counts — buying homes and cars. And that is not going to happen if businesses continue to express their pessimism in the way that really counts — by not hiring workers."A couple of key points:
The result is an economic Catch-22.
Leamer explains that significant reductions in the unemployment rate require real gross domestic product (GDP) growth in the 5.0 percent to 6.0 percent range. Normal GDP growth is 3.0 percent, enough to sustain unemployment levels, but not strong enough to put Americans back to work. As a consequence, consumers concerned about their employment status are reluctant to spend, and businesses concerned about growth are reluctant to hire.
The forecast for GDP growth this year is 3.4 percent, followed by 2.4 percent in 2011 and 2.8 percent in 2012, well below the 5.0 percent growth of previous recoveries and even a bit below the 3.0 percent long-term normal growth. With this weak economic growth comes a weak labor market, and unemployment slowly declines to 8.6 percent by 2012.
NAHB Builder Confidence declines sharply in June
by Calculated Risk on 6/15/2010 10:00:00 AM
Note: any number under 50 indicates that more builders view sales conditions as poor than good.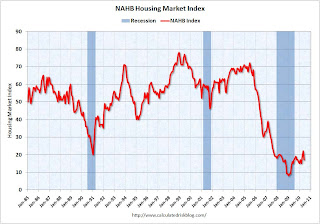 Click on graph for larger image in new window.
This graph shows the builder confidence index from the National Association of Home Builders (NAHB).
The housing market index (HMI) was at 17 in June. This was a sharp decline from 22 in May.
The record low was 8 set in January 2009. This is still very low ... This second graph compares the NAHB HMI (left scale) with single family housing starts (right scale). This includes the June release for the HMI and the April data for starts (May starts will be released tomorrow).
This shows that the HMI and single family starts mostly move generally in the same direction - although there is plenty of noise month-to-month.
Press release from the NAHB: Builder Confidence Declines in June
Snapping a string of two consecutive monthly gains, builder confidence in the market for newly built, single-family homes fell back to February levels, before the beginning of the home buyer tax credit-related surge, according to results of the latest National Association of Home Builders/Wells Fargo Housing Market Index (HMI), released today. The HMI dropped five points to 17 in June.This suggests single family starts will decline sharply soon.
“The home buyer tax credit did its job in stoking spring sales and we expected a temporary pull back in the builders’ outlook after the credit expired at the end of April,” said NAHB Chairman Bob Jones, a home builder from Bloomfield Hills, Mich. “However, the reduction in consumer activity may have been more dramatic than some builders had anticipated, which resulted in their lower confidence levels.”
...
Each of the HMI’s component indexes recorded declines in June. The component gauging current sales conditions fell five points to 17, while the component gauging sales expectations for the next six months declined four points to 23 (from a one-point downward revised index level of 27 in May) and the component gauging traffic of prospective buyers fell two points to 14.
The HMI also posted losses in every region in June. The Northeast, which has the smallest survey sample and is therefore subject to greater month-to-month volatility, fell 17 points to 18 following a 14-point jump in May. The Midwest posted a three-point loss to 14, while the South also registered a three-point decline to 19 and the West fell four points to 15 from a revised May level of 19.
NY Fed: Manufacturing Conditions improve in June
by Calculated Risk on 6/15/2010 08:30:00 AM
From the NY Fed: Empire State Manufacturing Survey
The Empire State Manufacturing Survey indicates that conditions for New York manufacturers improved in June. The general business conditions index edged up from its May level to 19.6, extending its string of positive readings to eleven months. The new orders and shipments indexes were also positive and higher than their May levels. The inventories index remained near zero for a second straight month, indicating that inventory levels were little changed.This came in slightly below expectations. This is more evidence that the inventory adjustment is over. Manufacturing continued to improve, although at a somewhat slower pace than earlier this year.
...
The new orders index rose modestly, to 17.5, and the shipments index climbed to 19.7. The unfilled orders index was negative for a third consecutive month, at -1.2.
...
The index for number of employees slipped 10 points, to 12.4, and the average workweek index climbed from zero last month to 8.6.
Monday, June 14, 2010
Fed's Bullard on the Economy
by Calculated Risk on 6/14/2010 11:59:00 PM
I thought these comments by St Louis Fed President James Bullard today were a little odd: The Global Recovery and Monetary Policy
"As of the first quarter of 2010, real GDP stands just shy of the 2008 second quarter level, so that growth of about 1.25 percent would be sufficient to allow real GDP to surpass the previous peak. At that point, the U.S. economy would be fully "recovered" from the very sharp downturn of late 2008 and early 2009."Fully recovered? Tell that to the millions of unemployed workers.
"To be clear, the 1.25 percent is a quarterly number, and would be 5.0 percent at an annual rate."Uh, I don't think that is clear. The 1.25% is the level real GDP is currently below the pre-recession peak.
What he meant is it would take an annualized quarterly growth rate of about 5% in Q2 to raise real GDP the 1.25% needed to reach the previous peak.
Although I think that 5.0 percent at an annual rate is too much to expect for current quarter real GDP growth, it seems like a reasonable possibility over the next two quarters combined.What he means is he thinks there is "a reasonable possibility" that the economy will grow at an annualized rate of 2.5% over the six months period including Q2 and Q3. That is possible, but I'll take the under.
Given these conditions, I expect the U.S. recovery in GDP to be complete in the third quarter of this year.This is overlooking the weakness in Gross Domestic Income. There are really two measures of GDP: 1) real GDP, and 2) real Gross Domestic Income (GDI). The two measures are conceptually identical, but yield slightly different results.
Recent research suggests that GDI is often more accurate than GDP, especially when the economy is weak. From Fed economist Jeremy Nalewaik, “Income and Product Side Estimates of US Output Growth,” Brookings Papers on Economic Activity.:
Considerable evidence suggests that the growth rates of GDP(I) better represent the business cycle fluctuations in true output growth than do the growth rates of GDP(E). ... These results strongly suggest that economists and statisticians interested in business cycle fluctuations in U.S. output should pay attention to the income-side estimates, and consider using some sort of weighted average of the income- and expenditure-side estimates in their analyses. The evidence in this paper clearly suggests that the weights should be skewed towards GDP(I) ...Real GDI is still 2.3% below the previous peak, and if the economy grows at 3% all year, real GDI will not surpass the previous peak until Q1 2011.
Vacation Cancellations along the Gulf Coast
by Calculated Risk on 6/14/2010 07:51:00 PM
From Kathy Jumper at the Mobile Press-Register: As oil washes ashore, property managers sharply cut condo rents (ht DaveinSV)
Property managers are offering 30 percent to 50 percent cuts at condominium units and beach houses, hoping to fill rooms and prevent cancellations in the wake of the BP oil spill.I'm not sure the lower prices will make much difference. Who wants to vacation at a beach and not be able to swim in the water? Or to see (and probably smell) the oil?
"June has been gutted, as far as rental occupancies," said David Bodenhamer, a partner in Young's Suncoast Vacation Rentals in Gulf Shores ... "We've had $220,000 in cancellations in the last three days." ... "The problem is that even at those lower rates, we're not getting near enough takers. Reservation calls have gone to a fraction of what they would normally be on a daily basis."
The article mentions that Alabama beach resorts generate about 75% of their annual revenue in June, July and August. So this entire season is lost.
On the bright side, other resort areas are probably doing better.
When I went backpacking in the Sierra in the summer of 2008, I asked the ranger how the economy was impacting traffic. He said it was their busiest year ever! People were still going on vacation, just to less expensive destinations. With the Gulf disaster, I expect the inland mountain resorts will have a banner year.


