 RSS Feed
 by Calculated Risk on 6/07/2010 06:42:00 PM
Monday, June 07, 2010
Distressed Sales: Sacramento as an Example, May 2010
The Sacramento Association of REALTORS® is breaking out monthly resales by equity sales (conventional resales), and distressed sales (Short sales and REO sales), and I'm following this series as an example to see mix changes in a distressed area. 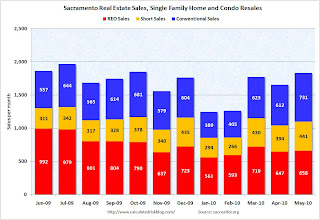 Click on graph for larger image in new window.
Here is the May data.
The Sacramento Association started breaking out REO sales in 2008, but they have only broken out short sales since June 2009 - so we now have one year of data.
In May, 60.1% of all resales (single family homes and condos) were distressed sales. This is the lowest level over the last year.
Note: This data is not seasonally adjusted.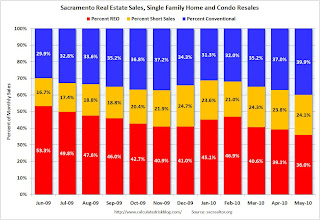 The second graph shows the percent of REO, short sales and conventional sales. The percent of short sales is near the high set in December and will probably continue to increase later this year (2010 is the year of the short sale!).
The percent of REOs has been generally declining (seasonally there are a larger percentage of REOs in the winter). Also there appears to be a higher percentage of conventional sales associated with the tax credit.
Also total sales in May were off 1.8% compared to May 2009; the 12th month in a row with declining YoY sales - even with the tax credit buying this year!
On financing, 57 percent were either all cash (23.3%) or FHA loans (33.6%), suggesting most of the activity in distressed former bubble areas like Sacramento is first time home buyers using government-insured FHA loans, and investors paying cash.
Starting in June we can do some year-over-year comparisons. It appears short sales will be up substantially YoY and REOs down, and it will be interesting to see the level of total distressed sales once the tax credit buying is behind us (July).
Rail Traffic Softens in May
by Calculated Risk on 6/07/2010 03:49:00 PM
From the Association of American Railroads: Rail Time Indicators. The AAR reports traffic in May 2010 was up 15.8% compared to May 2009 - and traffic was still 11.8% lower than in May 2008. Click on graph for larger image in new window.
This graph shows U.S. average weekly rail carloads. Traffic increased in 18 of 19 major commodity categories YoY.
From AAR:
• U.S. freight railroads originated 1,153,675 carloads in May 2010, an average of 288,419 carloads per week. That’s up 15.8% from May 2009 (which is the second highest percentage gain ever, behind April 2010 — see chart ...) but down 11.8% from May 2008.As the graph above shows, rail traffic collapsed in November 2008, and now eleven months into the recovery, traffic has only recovered about half way. This is more evidence of a sluggish recovery ... and the decline in May is concerning, although one month does not make a trend (and May was "a bit overstated" due to the timing of Memorial Day).
• U.S. railroads averaged 294,758 carloads per week in April 2010 and 288,793 in March 2010. Thus, May 2010’s average was actually down slightly from those months ... One month does not a trend make, but it would obviously be worrisome if the decline continued.
• As was the case in April 2010, the big year-over-year percentage gains in May 2010 U.S. rail traffic were partly a function of easy comparisons (May 2009 was a miserable month for rail traffic) and partly a function of real traffic growth.
• For the purposes of AAR rail traffic data, May 2010 consists of the four weeks ending May 29 — i.e., it does not include Memorial Day, which was May 31 this year. However, the May 2009 and May 2008 comparison months do include Memorial Day. The net result is that May 2010 data is a bit overstated relative to the two previous years, and June 2010 will be a bit understated relative to the two previous years. It is impossible to know exactly how much rail traffic is affected.
excerpts with permission
Consumer Credit increases slightly in April
by Calculated Risk on 6/07/2010 03:00:00 PM
The Federal Reserve reports:
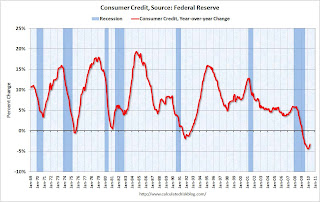
Consumer credit increased at an annual rate of 1/2 percent in April 2010. Revolving credit decreased at an annual rate of 12 percent, and nonrevolving credit increased at an annual rate of 7 percent.
 Click on graph for larger image in new window.
This graph shows the year-over-year (YoY) change in consumer credit. Consumer credit is off 3.2% over the last 12 months.
Note: The Fed reports a simple annual rate (multiplies change in month by 12) as opposed to a compounded annual rate. Consumer credit does not include real estate debt.
Usually there is a fairly sharp increase in consumer credit during a robust recovery - but that isn't happening this time because household balance sheets are still a mess. Just another reminder that the recovery will be sluggish and choppy ...
Impact of Decennial Census on Unemployment Rate
by Calculated Risk on 6/07/2010 12:00:00 PM
Last week I posted the Impact of Census 2010 on Payroll Report
My estimate was that the 2010 Census would add 417,000 payroll jobs in May; the actual was 411,000 payroll jobs.
My preliminary estimate is the Census will subtract 200,000 payroll jobs in June - and most of the remaining temporary Census jobs (564,000 total in May) will be unwound by September.
I've been puzzling over how much (if any) these temporary jobs lowered the unemployment rate in May. I think these workers come from three groups:
1) already employed workers taking a part time job,
2) people not in the workforce picking up a little temporary income (like retirees or students who would otherwise not be in the workforce), and
3) the unemployed taking a part time job.
Sure enough there was an increase in people working multiple jobs in May. The number of multiple jobholders jumped by 210,000 in May (seasonally adjusted). There can be other reasons for this increase, but if we assume these are mostly Census workers, then about half the 411,000 additional Census workers already have other jobs - so for these workers, the temporary Census jobs has no impact on the unemployment rate.
The other half are probably otherwise unemployed workers, or people not in the workforce (although the participation rate declined in May). If we assume that this is mostly unemployed workers, these temporary hires lowered the unemployment rate by around 0.1% (from 9.8% to 9.7%).
Tim Duy: Lost Chance for Global Rebalancing
by Calculated Risk on 6/07/2010 08:35:00 AM
Professor Duy is not happy: A Good Crisis, Wasted
It is official. The rest of the world assumes the economy can pick up were we left off in 2006, with the US as the driver of global demand. And it is apparent there is little US policymakers can or will do to counter the trend. Once again, crisis - and along with it the opportunity to rebalance global growth - is wasted.Not only are we headed back to the pre-crisis imbalances, this suggests that unemployment in the U.S. will stay elevated for some time.
...
Don Geithner [is] tilting at windmills. His battles are futile. Financial markets know it, sensing that the global growth cannot be sustained on the back of the US alone. Of course, this was always the case; demand in the US alone was never sufficient to recreate the fabled "V" recovery of the 1980s. Market participants also know that US policymakers have their finger in the dam of a tidal wave of competitive devaluations. The Dollar, for all its warts, remains the big dog of reserve currencies, and Geithner fears the global pandemonium that would result from an actual US response to the currency manipulation of others. Thus the postponed report on currency manipulators becomes another case of "extend and pretend."
In the end, why continue to hold the Euro on what is increasingly the myth of global rebalancing? It is clear European policymakers want a weaker Euro, and US policymakers are powerless to prevent a stronger dollar. At least we are getting cheaper oil as a result.
When it all shakes out, the US will actually be asked to do more, not less.
...
Where does this all leave us? The rest of the world is intent on pursuing a begger thy neighbor strategy, with the US being the neighbor. I suspect US policymakers will eventually relent; it will be the only choice left. All we can do now is sit back and wait for the inevitable explosion in the US trade deficit, waiting idly by for the next crisis and the "chance" to bring some sanity to the global financial architecture.
Sunday, June 06, 2010
Sunday Night Futures
by Calculated Risk on 6/06/2010 10:55:00 PM
Note: Here is the weekly summary and a look ahead (with plenty of interesting graphs).
The Asian markets are red tonight with the Nikkei off 4%.
From CNBC: Pre-Market Data shows the S&P 500 off about 8 or less than 1%. Dow futures are off about 70 points.
The Euro is down against at 1.19 dollars
Best to all.
Hungary: Never mind
by Calculated Risk on 6/06/2010 06:20:00 PM
Here is the weekly summary and look ahead.
The furious backpedaling continues ...
From the WSJ: Hungary Seeks to Reassure Lenders and Investors
Hungary's new cabinet huddled in an emergency session over the weekend to devise an economic plan aimed at restoring confidence in the nation's creditworthiness, as the government backtracked on officials' earlier comments that the country could default on its debts.
From Reuters: Analysis: Hungary faces struggle to regain trust of markets
Hungary is likely to take months to regain the trust of financial markets after politicians in its new government made controversial comments ...The euro is down to 1.1956 dollars.
This makes me think of Gilda Radner: "Never mind".
Weekly Summary and a Look Ahead
by Calculated Risk on 6/06/2010 11:59:00 AM
The key economic report this week will be April retail sales to be released on Friday.
On Monday, the Fed will release Consumer Credit for April at 3 PM ET. Consumer credit has declined sharply since mid-2008, especially revolving debt (credit cards). Also this week, the May rail traffic report from the Association of American Railroads (AAR) and May LA port traffic will probably be released.
On Tuesday, the National Association of Independent Business (NFIB) will release the small business optimism survey for May. The NFIB pre-released the employment survey on Friday and the employment outlook was described as “bleak”. Also on Tuesday the Job Openings and Labor Turnover Survey (JOLTS) for April will be released at 10 AM by the BLS. This report has been showing very little turnover in the labor market and few job openings.
On Wednesday, the MBA will release the mortgage purchase applications index. This has been falling sharply suggesting a sharp decline in home sales after the expiration of the tax credit. Also on Wednesday, Wholesale Inventories and the Fed’s Beige Book will be released. Fed Chairman Ben Bernanke will testify at 10 AM before the house budget committee (the hearing is about the State of the Economy: View from the Federal Reserve), and the NY Fed’s Brian Sack will speak at noon at the New York Association of Business Economics.
On Thursday the April Trade Balance report will be released at 8:30 AM by the Census Bureau. The consensus is for a further increase in the U.S. trade deficit to around $41 billion (from $40.4 billion). Also on Thursday, the closely watched initial weekly unemployment claims will be released. Consensus is for a decline to 448K from 453K last week.
Also on Thursday, the Fed will release the Q1 Flow of Funds report, and the May Ceridian-UCLA Pulse of Commerce Index (based on diesel fuel consumption) will be released. Last month this was the one of the first indicators that showed the economy slowed in April.
On Friday May retail sales will be released at 8:30 AM. The consensus is for an increase of 0.3% from the April rate, and 0.1% increase ex-autos. Also the May Reuter's/University of Michigan's Consumer sentiment index will be released at 9:55 AM, and April Business inventories will be released at 10 AM.
And of course the FDIC will probably have another busy Friday afternoon ...
And a summary of last week:
From the BLS:
Total nonfarm payroll employment grew by 431,000 in May, reflecting the hiring of 411,000 temporary employees to work on Census 2010, the U.S. Bureau of Labor Statistics reported today. ... The unemployment rate edged down to 9.7 percent.
 Click on graphs for a larger image.
This graph shows the job losses from the start of the employment recession, in percentage terms. This really shows how stunning the job losses were during the great recession.
The dotted line is the job losses ex-Census. Census 2010 hiring was 411,000 in May.
The recession that started in 2007 was by far the worst recession since WWII in percentage terms, and 2nd worst in terms of the unemployment rate (only early '80s recession with a peak of 10.8 percent was worse).
 This graph shows the same data, but this time aligned at the bottom of the recession.
Notice that the 1990 and 2001 recessions were followed by jobless recoveries - and the eventual job recovery was gradual. In earlier recessions the recovery was somewhat similar and a little faster than the decline (somewhat symmetrical).
 This graph shows the Employment-Population ratio. The ratio decreased to 58.7% in May (from 58.8% in April). This had been increasing after plunging since the start of the recession.
Note: the graph doesn't start at zero to better show the change.
The Labor Force Participation Rate decreased to 65.0% from 65.2% in April. This is the percentage of the working age population in the labor force. This decline is disappointing. The decline in participation was a key reason the unemployment rate declined.
 This graph shows the long term unemployed. The blue line is the number of workers unemployed for 27 weeks or more. The red line is the same data as a percent of the civilian workforce.
According to the BLS, there were a record 6.72 million workers who had been unemployed for more than 26 weeks (and still want a job). This was a record 4.34% of the civilian workforce. (note: records started in 1948)
 Based on an estimate from Autodata Corp, light vehicle sales were at a 11.63 million SAAR in May. This is up 18.1% from May 2009 (when sales were very low), and up 3.9% from the April sales rate.
This graph shows the historical light vehicle sales (seasonally adjusted annual rate) from the BEA (blue) and an estimate for May (red, light vehicle sales of 11.63 million SAAR from Autodata Corp).
 The 136,142 consumer bankruptcies filed in May represented a 9 percent increase from May 2009 total.
 This graph shows the non-business bankruptcy filings by quarter using monthly data from the ABI and previous quarterly data from USCourts.gov.
The American Bankruptcy Institute (ABI) has increased their forecast to over 1.6 million filings this year .
 This graph shows private residential and nonresidential construction spending since 1993. Note: nominal dollars, not inflation adjusted.
Private residential construction spending appears to have bottomed in early 2009, but has been mostly moving sideways since then. Residential spending is now 61% below the peak of early 2006.
Private non-residential construction spending is now 29% below the peak of late 2008.
Best wishes to all.
Krugman: "Lost Decade, Here We Come"
by Calculated Risk on 6/06/2010 08:49:00 AM
First, from the Financial Times: G20 drops support for fiscal stimulus
Finance ministers from the world’s leading economies ripped up their support for fiscal stimulus on Saturday ...And from the G20 communiqué:
The communiqué of the meeting made it clear that the G20 no longer thought that expansionary fiscal policy was sustainable or effective in fostering an economic recovery because investors were no longer confident about some countries’ public finances.
Excerpts with permission
The recent events highlight the importance of sustainable public finances and the need for our countries to put in place credible, growth-friendly measures, to deliver fiscal sustainability, differentiated for and tailored to national circumstances. Those countries with serious fiscal challenges need to accelerate the pace of consolidation.And from Paul Krugman: Lost Decade, Here We Come
It’s basically incredible that this is happening with unemployment in the euro area still rising, and only slight labor market progress in the US.
...
The right thing, overwhelmingly, is to do things that will reduce spending and/or raise revenue after the economy has recovered — specifically, wait until after the economy is strong enough that monetary policy can offset the contractionary effects of fiscal austerity. But no: the deficit hawks want their cuts while unemployment rates are still at near-record highs and monetary policy is still hard up against the zero bound.
...
Utter folly posing as wisdom. Incredible.
Saturday, June 05, 2010
Daily Show: The Spilling Fields
by Calculated Risk on 6/05/2010 10:28:00 PM
Since we all need a laugh - Jon Stewart has a suggestion for how to use a vacant McMansion ... Here is the link at the Daily Show
| The Daily Show With Jon Stewart | Mon - Thurs 11p / 10c |
| The Spilling Fields - To Shell and Back | |
Fannie Mae's Duncan: Home-building industry to be tested until early 2013
by Calculated Risk on 6/05/2010 05:46:00 PM
Some comments from Fannie Mae chief economist Douglas Duncan ...
From Greta Guest at Freep.com:
Douglas Duncan, chief economist for Fannie Mae, said he expects the home-building industry to be tested until early 2013 before demand will catch up with the large supply of houses on the market.And from Elizabeth Razzi at the WaPo: Is bulldozer the best option for some boom-time housing?
He said the combination of current inventory of unsold homes plus the foreclosures not yet for sale has elevated supply by roughly 2 million houses over normal levels.
He said that housing starts would be below normal levels until that inventory is absorbed.
Said Duncan: "Some of that shadow investment could have to be torn down. It was not economically viable when it was put in place." ... Duncan said people could find that the cost of sustaining their lifestyle in some developments--including high transportation costs to far-away jobs--is greater than the cost of the home. That would wipe out demand.And I posted this comment yesterday via Kathleen Howley and Daniel Taub at Bloomberg: Fannie Mae’s Duncan Says Homebuyer Tax Credit Shifted Demand
...
The idea is being discussed by economists, but Duncan said he doesn't know of any policymakers who are considering it. "It's un-American to think about tearing down housing," he said. "But we have a long history of ghost towns."
“Temporary tax credits change behavior temporarily. It’s simply shifted demand forward. ... It actually created some price appreciation that’s not supportable long term.” [said Douglas Duncan, Fannie Mae chief economist]
Duration of Unemployment
by Calculated Risk on 6/05/2010 01:16:00 PM
 This graph shows the duration of unemployment as a percent of the civilian labor force. The graph shows the number of unemployed in four categories as provided by the BLS: less than 5 week, 6 to 14 weeks, 15 to 26 weeks, and 27 weeks or more.
Note: The BLS reports 15+ weeks, so the 15 to 26 weeks number was calculated.
As we've discussed before there was more turnover in the '70s and '80s - back then the 'less than 5 weeks' category was much higher as a percent of the civilian labor force than in recent years.
What really makes the current period stand out is the number of people (and percent) that have been unemployed for 27 weeks or more (red line). In the early '80s, the 27 weeks or more unemployed peaked at 2.9 million or 2.6% of the civilian labor force.
In May 2010, there were a record 6.763 million people unemployed for 27 weeks or more, or a record 4.38% of the labor force. This is significantly higher than during earlier periods.
It does appear the number of long term unemployed is near a peak (the increases have slowed). But it is still very difficult for these people to find a job - and this is a very serious employment issue.
Hungary Government Clarifies "default" Comments
by Calculated Risk on 6/05/2010 08:33:00 AM
There were a few reports yesterday of a Hungarian official talking about a possible "default", and saying the budget numbers had been "manipulated". A couple of readers (from Hungary), sent me better translations - and the comments were clumsy, and not as scary.
Today from Reuters: Hungary government says aims to meet 2010 deficit goal
Hungary's government said on Saturday it still aimed to meet this year's deficit target, as it sought to draw a line under "exaggerated" talk of a possible Greek-style debt crisis that had unnerved markets a day earlier.This scare helped push the euro to the lowest level against the dollar since March 2006.
State secretary Mihaly Varga ... said Hungary's previous socialist governments had hidden the true state of the country's public finances, and that additional measures would be needed to reach the 3.8 percent of GDP target.
...
"Those comments which were made on this issue are exaggerated, and if a colleague makes them it is unfortunate," Varga told a news conference.
"I have to say that the situation is consolidated, and the planned deficit (target) is attainable, but for it to be attainable the government must take measures."
More from the WSJ: Hungary Rushes to Calm Markets
 Click on graph for larger image in new window.
The Euro has only been around since Jan 1999. The graph shows the number of dollars per euro since Jan 1, 1999.
The dashed line is the current exchange rate. Just a little further (below 1.1667 dollars per euro), and we will be discussing the lowest level since 2003.
Friday, June 04, 2010
Unofficial Problem Bank List: Assets increase sharply
by Calculated Risk on 6/04/2010 11:03:00 PM
Earlier employment posts today:
This is an unofficial list of Problem Banks compiled only from public sources.
Here is the unofficial problem bank list for June 4, 2010.
Changes and comments from surferdude808:
The Unofficial Problem Bank List finishes the week unchanged in terms of the number of institutions at 762, but there was a substantial increase in assets to $385.9 billion from $369.2 billion.CR note: The FDIC reported there were 775 institutions with assets of $431 billion on the official problem bank list at the end of Q1. There are some timing issues, but the overall number of institutions on the unofficial list is very close to the official list. The addition of Firstbank of Puerto Rico has closed the asset gap, but there is the possibility that a large regional bank may be on the official problem bank list.
There were four additions this week including Firstbank of Puerto Rico, Santurce, PR ($18.8 billion Ticker: FBP); Home Savings of America, Little Falls, MN ($472 million); Builders Bank, Chicago, IL ($464 million); and the Bank of Little Rock, Little Rock, AR ($185 million).
Removals include the failed TierOne Bank ($2.8 billion Ticker: TONE) and Arcola Homestead Savings Bank ($17 million). Other removals are from the OCC terminating Formal Agreements against Valley National Bank, Espanola, NM ($337 million) and Standing Stone National Bank, Lancaster, OH ($74 million). However, it is likely these removals will be short-lived as the OCC has frequently replaced a terminated Formal Agreement with a Consent Order during this banking crisis.
We are anticipating the OCC will release its enforcement actions for May by next Friday
Bank Failure #81: TierOne Bank, Lincoln, Nebraska
by Calculated Risk on 6/04/2010 07:06:00 PM
How have the mighty fallen.
Free falling from peak.
by Soylent Green is People
From the FDIC: Great Western Bank, Sioux Falls, South Dakota, Assumes All of the Deposits of TierOne Bank, Lincoln, Nebraska
As of March 31, 2010, TierOne Bank had approximately $2.8 billion in total assets and and $2.2 billion in total deposits. ...I guess they weren't top tier ...
The FDIC estimates that the cost to the Deposit Insurance Fund (DIF) will be $297.8 million. ... TierOne Bank is the 81st FDIC-insured institution to fail in the nation this year, and the first in Nebraska. The last FDIC-insured institution closed in the state was Sherman County Bank, Loup City, on February 13, 2009.
Bank Failure #80: Arcola Homestead Savings Bank, Arcola, Illinois
by Calculated Risk on 6/04/2010 06:08:00 PM
From the FDIC: FDIC Approves the Payout of the Insured Deposits of Arcola Homestead Savings Bank, Arcola, Illinois
The FDIC was unable to find another financial institution to take over the banking operations of Arcola Homestead Savings Bank....No one wanted this one ...
As of March 31, 2010, Arcola Homestead Savings Bank had approximately $17.0 million in total assets and $18.1 million in total deposits. ...
The FDIC estimates that the cost to the Deposit Insurance Fund (DIF) will be $3.2 million. Arcola Homestead Savings Bank is the 80th FDIC-insured institution to fail in the nation this year, and the twelfth in Illinois. The last FDIC-insured institution closed in the state was Midwest Bank and Trust Company, Elmwood Park, on May 14, 2010.
Bank Failure #79: First National Bank, Rosedale, Mississippi
by Calculated Risk on 6/04/2010 05:02:00 PM
From the FDIC: The Jefferson Bank, Fayette, Mississippi, Assumes All of the Deposits of First National Bank, Rosedale, Mississippi
As of March 31, 2010, First National Bank had approximately $60.4 million in total assets and $63.5 million in total deposits. ...
The FDIC estimates that the cost to the Deposit Insurance Fund (DIF) will be $12.6 million. ... First National Bank is the 79th FDIC-insured institution to fail in the nation this year, and the first in Mississippi. The last FDIC-insured institution closed in the state was Bank of Falkner, Falkner, on September 29, 2000.
Fannie Mae economist: House "price appreciation not supportable" and more
by Calculated Risk on 6/04/2010 04:00:00 PM
“Temporary tax credits change behavior temporarily. It’s simply shifted
demand forward. ... It actually created some price appreciation that’s not
supportable long term.”
Douglas Duncan, Fannie Mae Chief Economist, June 4, 2010 via Bloomberg (ht Brian)
And more on condo shadow inventory in New York from Bloomberg: Manhattan Empty Condos May Be Rentals as Leases Reign (ht Mike In Long Island)
About 8,700 new condos sit empty in Manhattan, with 75 percent not even listed for sale yet ... Developers taking out construction loans borrow an additional amount for interest reserves, which is intended to cover the monthly payments on the loan while the project is under construction and until sales begin ... reserves on loans made in 2007 and 2008 will dwindle in the second half of 2010 and early 2011.We've discussed this before - the flood comes when the interest reserves run dry.
The euro is down to 1.196 dollars. This is the lowest level since March 2006.
The TED spread increased to 41.59 (a measure of credit stress). This is still fairly low, but this is the highest level in eleven months. Note: This is the difference between the interbank rate for three month loans and the three month Treasury. The peak was 463 on Oct 10th and a normal spread is below 50 bps.
 Click on graph for larger image in new window.
This is a slightly different graph from Doug Short of dshort.com (financial planner).
This graph shows the ups and downs of the market since the high in 2007.
Earlier employment posts today:
Temporary Help Services starting to slow, Small Business hiring "Bleak"
by Calculated Risk on 6/04/2010 01:17:00 PM
One more graph based on data in the employment report ...
Earlier employment posts today:
Temporary Help
From the BLS report:
Temporary help services added 31,000 jobs over the month; employment in the industry has risen by 362,000 since September 2009.
 This graph is a favorite of those expecting a huge rebound in employment. The graph is a little complicated - the red line is the three month average change in temporary help services (left axis). This is shifted four months into the future.
The blue line (right axis) is the three month average change in total employment (excluding temporary help services and Census hiring).
Unfortunately the data on temporary help services only goes back to 1990, but it does appear that temporary help leads employment by about four months (although noisy).
The thinking is that before companies hire permanent employees following a recession, employers will first increase the hours worked of current employees (hours worked increased again in May) and also hire temporary employees.
Since the number of temporary workers increased sharply late last year, some people argued this was signaling the beginning of a strong employment recovery - probably in April and May. It didn't happen.
There was also evidence of a shift by employers to more temporary workers, and the joke in the comments was "We are all temporary now!". That is probably closer to the mark. The timing of this graph is useful - temporary help services does lead general employment - but the magnitude of the swings is probably less useful.
Small Business Hiring "Bleak"
The National Federation of Independent Business released the employment outlook from their May survey: Small Business Still Reluctant to Hire
“Since January 2008, the average employment per firm has been negative every month, including May 2010, which yielded a seasonally adjusted loss of negative 0.5 workers per firm. Most firms did not change employment in May, but for those that did, 8 percent increased average employment by 2.4 employees and 20 percent reduced their workforces by an average of 4 employees. Small business job creation has not crossed the 0 line in over 2 years."
...
“Overall, the job creation picture is still bleak. Poor sales and uncertainty continue to hold back any commitments to growth, hiring or capital spending. Job creation plans have been running far below comparable quarters in the recovery from two other major recessions."
Euro falls under 1.20 Dollars, Hungary “manipulated” figures
by Calculated Risk on 6/04/2010 11:45:00 AM
A break from the employment report ...
Update: a couple of Hungarian readers have told me the translation was out of context (ht Gabor, Greg). Here is a different translation:
"It was prime minister Ferenc Gyurcsany [previous prime minister of the now opposition Socialist Party] who talked about default. Indeed, he even remarked proudly that Hungary was on the verge of default one and a half years ago ... and he was proud that he could only save Hungary from default with the help of IMF. In this regard it’s not an exaggeration to talk about default.”So the spokesman was apparently referring to the comments of the previous prime minister, and not talking about default now.
Also the readers said the figures that were "manipulated" were forecasts of deficit (not actual deficit like Greece).
The euro fell to under 1.20 dollars this morning as Hungary spooked investors.
From Bloomberg: Sovereign Credit-Default Swaps Surge on Hungarian Debt Crisis
Credit-default swaps on sovereign bonds surged to a record on speculation Europe’s debt crisis is worsening after Hungary said it’s in a “very grave situation” because a previous government lied about the economy ... a spokesman for Prime Minister Viktor Orban said talk of a default is “not an exaggeration” because a previous administration “manipulated” figures.


