 RSS Feed
 by Calculated Risk on 6/04/2010 09:59:00 AM
Friday, June 04, 2010
Employment-Population Ratio, Part Time Workers, Unemployed over 26 Weeks
Here are a few more graphs based on the employment report ...
Percent Job Losses During Recessions, aligned at Bottom Click on graph for larger image.
This graph shows the job losses from the start of the employment recession, in percentage terms - but this time aligned at the bottom of the recession.
The current recession bounced along the bottom for a few months - so the choice of bottom is a little arbitrary (plus or minus a month or two).
Notice that the 1990 and 2001 recessions were followed by jobless recoveries - and the eventual job recovery was gradual. In earlier recessions the recovery was somewhat similar and a little faster than the decline (somewhat symmetrical).
The dotted line shows the impact of Census hiring. In May, there were 564,000 temporary 2010 Census workers on the payroll. Starting in June, the number of Census workers will decline - and the two red lines will meet later this year.
Employment-Population Ratio
The Employment-Population ratio decreased to 58.7% in May (from 58.8% in April). This had been increasing after plunging since the start of the recession. This is about the same level as in December 1983. This graph shows the employment-population ratio; this is the ratio of employed Americans to the adult population.
Note: the graph doesn't start at zero to better show the change.
The Labor Force Participation Rate decreased to 65.0% from 65.2% in April. This is the percentage of the working age population in the labor force. This decline is disappointing, and the rate is well below the 66% to 67% rate that was normal over the last 20 years.
The reason the unemployment rate declined was because people left the workforce - and that is not good news. As the employment picture improves, people will return to the labor force, and that will put upward pressure on the unemployment rate.
Part Time for Economic Reasons 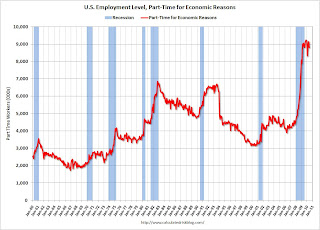 From the BLS report:
The number of persons employed part time for economic reasons (some-times referred to as involuntary part-time workers) declined by 343,000 in May to 8.8 million. These individuals were working part time because their hours had been cut back or because they were unable to find a full-time job.The number of workers only able to find part time jobs (or have had their hours cut for economic reasons) was at 8.809 million in April. This decline was a little bit of good news.
The all time record of 9.24 million was set in October.
These workers are included in the alternate measure of labor underutilization (U-6) that was at 16.6% in May.
Unemployed over 26 Weeks
 The blue line is the number of workers unemployed for 27 weeks or more. The red line is the same data as a percent of the civilian workforce.
According to the BLS, there are a record 6.763 million workers who have been unemployed for more than 26 weeks (and still want a job). This is a record 4.38% of the civilian workforce. (note: records started in 1948). It does appear the increases are slowing ...
Although the headline number of 431,000 payroll jobs was large, this was only 20,000 after adjusting for the 411,000 Census 2010 temporary hires. The underlying details were mixed. The positives: the unemployment rated decreased to 9.7%, the number of part time workers (for economic reasons) decreased helping to push down U-6 to 16.6% (from 17.1%), hourly wages increased (slightly), as did the average hours worked.
Negatives include the employment-population rate declining, the few payroll jobs ex-Census, and a record number of workers unemployed for more than 26 weeks. The number of long term unemployed is one of the key stories of this recession, especially since many of them are now losing their unemployment benefits.
I'll have even more later ...
Earlier employment post today:
May Employment Report: 20K Jobs ex-Census, 9.7% Unemployment Rate
by Calculated Risk on 6/04/2010 08:30:00 AM
From the BLS:
Total nonfarm payroll employment grew by 431,000 in May, reflecting the hiring of 411,000 temporary employees to work on Census 2010, the U.S. Bureau of Labor Statistics reported today. ... The unemployment rate edged down to 9.7 percent.Census 2010 hiring was 411,000 in May. Non-farm payroll employment increased 20,000 in May ex-Census.
 Click on graph for larger image.
This graph shows the unemployment rate and the year over year change in employment vs. recessions.
Nonfarm payrolls increased by 431,000 in May. The economy has lost 0.6 million jobs over the last year, and 7.4 million jobs since the recession started in December 2007. Ex-Census hiring, the economy only added 20,000 jobs in May.
The unemployment rate decreased to 9.7 percent.
 The second graph shows the job losses from the start of the employment recession, in percentage terms (as opposed to the number of jobs lost).
The dotted line is ex-Census hiring. The two lines will rejoin later this year when the Census hiring is unwound.
For the current recession, employment peaked in December 2007, and this recession is by far the worst recession since WWII in percentage terms, and 2nd worst in terms of the unemployment rate (only early '80s recession with a peak of 10.8 percent was worse).
This is a very weak report. The decrease in the unemployment rate was because of a decline in the participation rate - and that is not good news. I'll have much more soon ...
Thursday, June 03, 2010
WSJ: China's Property Market Freezes Up
by Calculated Risk on 6/03/2010 11:59:00 PM
The WSJ has an article tonight about the Chinese real estate market and the recent government actions: China's Property Market Freezes Up
Beijing in mid-April announced a package of policies intended to blow the froth out of the market by restricting speculative purchases. ... The housing market in many—though not all—Chinese cities seems to have nearly ground to a halt after the government moves. On average, the number of residential property transactions in the four weeks after the restrictions were announced is down 40% compared with the four weeks before the measuresThis slowdown is showing up in commodity prices. A key question is how the Chinese government will react.
Professor Michael Pettis, of the Peking University’s Guanghua School of Management, expects the Chinese government to take action to cushion the slow down, see Beijing’s stop-and-go measures: As
I have said many times before, I suspect we will see a lot of discontinuity in policymaking this year – amid lots of panicking – and recent events show just how. In the past few months Beijing seems to have become so worried about signs of overheating that, after trying unsuccessfully many times to pare growth carefully, it has given up the scalpel and has brought out the sledgehammer.It could be a wild ride.
...
Given the bad global environment, China’s huge domestic imbalances, and its out-of-control monetary condition, there are precious few tools Beijing has for fine-tuning growth. Instead policymakers are going to switch back and forth throughout the year between stomping on the accelerator and stomping on the brakes.
Oil and Florida Tourism
by Calculated Risk on 6/03/2010 08:34:00 PM
Earlier I posted: Oil Gusher impacting Gulf Coast Hotels
William Spain at MarketWatch has more: Spill could mean dark times for Sunshine State
At stake [in Florida] alone are hundreds of thousands of jobs and perhaps billions of dollars in revenue, depending on when and where the oil from BP PLC's runaway well makes landfall.Of course the loss of tourism pales in comparison to the ecological damage from the oil gusher.
Although the beaches were still in the clear as of Thursday afternoon, widespread reports of vacation cancellations are already coming in ...
"It is already ugly," said John Fareed, a partner at Fareed Zapala Koepke, an Orlando-based hospitality-industry consultancy. "When it hits, it will be real and will position itself in the psyche of consumers who are getting ready to make vacation plans. It is going to have a huge impact in terms of future bookings and cancellations.
"Every indication from the people we work with is that bookings have slowed to a trickle".
Euro Bond and CDS Spreads Widen
by Calculated Risk on 6/03/2010 03:36:00 PM
Here are two graphs from the Atlanta Fed weekly Financial Highlights released today (graph as of June 2nd): Click on graph for larger image in new window.
From the Atlanta Fed:
Despite the latest announcement of planned austerity measures by Spain, Portugal, and Italy, uncertainty around the adjustment
challenges in peripheral Europe continues to weigh on the region’s bond prices.
Downgrading of Spanish sovereign debt by Fitch and ongoing concerns about the Spanish banking sector further added to investor worries.
Compared with two weeks ago, peripheral Europe's bond spreads to bunds have widened by 30 basis points (bps) on average.
After declining early last week, sovereign debt spreads have begun widening for peripheral euro area countries. As of June 1, the 10-year bond spread stands at 503 basis points (bps) for Greece, 219 bps for Ireland, 195 bps for Portugal, and 162 bps for Spain.

Similarly, CDS spreads have risen after the initial response to the stabilization package.After declining following the policy response, the bond and CDS spreads have resumed their steady climb - especially for Greece and Portugal.
It should be noted that the German government, through its financial services regulator BaFin, unilaterally and temporarily banned naked short selling of sovereign debt securities, naked credit default swaps on European sovereign
debt in which the buyer has no hedging demand, and naked short sales in 10 prominent German financials.
And from Reuters today: Hungary Warns of Deficit Overshoot; EU Urges Action
Hungary ... government officials reiterated the 2010 fiscal gap may reach almost twice the target agreed with lenders including the EU. ... Public finances were in much worse shape than previously expected and there was only a slim chance of avoiding a Greek-style scenario, news portal napi.hu cited [the vice chairman of the ruling Fidesz party, Lajos Kosa] as saying.The euro is down to 1.2166 dollars, the lowest level in four years.
Report: Oil Gusher impacting Gulf Coast Hotels
by Calculated Risk on 6/03/2010 02:43:00 PM
From Christine Blank at HotelNewsNow.com: Oil-spill update: Hotels report mixed results
Tourism officials and hotel operators in Gulf of Mexico coastal regions say they are struggling with occupancy and reservations, but some areas are suffering more than others.The economic impact of the oil gusher is unclear, although tourism, fishing and shipping are all being impacted.
...
“We have had some cancellations. It is hitting the beachfront properties hard and the casinos have seen some impact ... and the charter boat companies,” said Richard Forester, executive director of the Mississippi Gulf Coast Convention and Visitors Bureau in Biloxi.
...
“Our members are experiencing unprecedented cancellations heading into their peak season, and this advertising campaign is critical to our economic survival,” said Carol Dover, president and CEO of the Florida Restaurant and Lodging Association in Tallahassee ... Many hoteliers in Northwest Florida that are typically at 90 percent occupancy rates heading into the Memorial Day weekend, were reporting a drop in bookings by 30 percent, according to the FRLA.
...
Texas’s coastal hotels also are feeling an impact, but that could be due to the overall U.S. economy more than to the oil spill.
“We have yet to have any cancellations [because of the oil spill],” said Theresa Elliott, GM of Casa del Mar Beachfront Suites, Galveston, Texas. ... Galveston-area hotels are significantly discounting rooms to boost stays, such as 20-percent off Sunday through Thursday stays, according to Elliott.
Employment Report Prediction: Bad Reporting!
by Calculated Risk on 6/03/2010 12:51:00 PM
This is probably a safe prediction: There will be some really bad reporting tomorrow.
Note: The May headline payroll number will be large (consensus is for 540,000 payroll jobs added in May), but this will include around 400,000 temporary Census jobs.
I think this poor reporting will fall into two major categories:
1) Reporters who use the headline payroll number and write that this shows the recovery is picking up steam. We will probably see someone use the headline number and write something like "This is the largest monthly gain since September 1983" - well, were there 400,000+ temporary Census hires in September 1983? If not, why does this comparison matter?
2) Anyone who calls the number of temporary census workers "fake" or subtracts the birth/death adjustment from the seasonally adjusted headline number.
I've spoken with actual Census workers, and I guarantee their jobs are not "fake". Their jobs are real but temporary, and it is appropriate to subtract the Census 2010 workers from the headline payroll number to determine the underlying trend (even though it is obvious, I verified this calculation with the Census Bureau).
And no matter what anyone thinks of the birth / death model, the adjustment is added to the NSA numbers - and can't be subtracted from the SA numbers. Note: I think the birth / death model is useful although we have to aware of the weaknesses (it misses turning points - something I wrote about in 2006).
The employment report has many useful numbers. But the key payroll number is U-3 minus the number of Census 2010 temporary workers. The Census Bureau is tasked with reporting an estimate of the number of payroll jobs each month - so they include the Census 2010 jobs - but they also provide the information on the number of Census hires (the report will be released here).
It is the responsibility of anyone reporting on the numbers to do the heavy math and subtract the Census workers from the headline number. I will report both numbers.
Starting in June, the impact of the Census 2010 on the payroll report will be negative - see: Impact of Census 2010 on Payroll Report. That will require adding the temporary Census 2010 workers back to determine the underlying trend.
For some reason, print reports tend to contain the first mistake, and online reports the second error. Both are poor reporting, although the second is far more egregious (because the statements are blatantly false).
Oh well ... sorry for the rant, but I'm already seeing some really bad "analysis".
ISM Non-Manufacturing Index Shows Expansion
by Calculated Risk on 6/03/2010 10:00:00 AM
The May ISM Non-Manufacturing index was at 55.4%, unchanged from April (slightly below expectations). The employment index showed some growth after 28 consecutive months of contraction.
From the Institute for Supply Management: May 2010 Non-Manufacturing ISM Report On Business®
Economic activity in the non-manufacturing sector grew in May for the fifth consecutive month, say the nation's purchasing and supply executives in the latest Non-Manufacturing ISM Report On Business®.
The report was issued today by Anthony Nieves, C.P.M., CFPM, chair of the Institute for Supply Management™ Non-Manufacturing Business Survey Committee; and senior vice president — supply management for Hilton Worldwide. "The NMI (Non-Manufacturing Index) registered 55.4 percent in May, the same percentage as registered in both April and March, indicating continued growth in the non-manufacturing sector. The Non-Manufacturing Business Activity Index increased 0.8 percentage point to 61.1 percent, reflecting growth for the sixth consecutive month. The New Orders Index decreased 1.1 percentage points to 57.1 percent, and the Employment Index increased 0.9 percentage point to 50.4 percent, reflecting growth for the first time after 28 consecutive months of contraction. The Prices Index decreased 4.1 percentage points to 60.6 percent in May, indicating that prices are still increasing but at a slower rate than in April. According to the NMI, 16 non-manufacturing industries reported growth in May. Respondents' comments remain mostly positive about current business conditions and the general direction of the economy."
emphasis added
Weekly Initial Unemployment Claims at 453,000
by Calculated Risk on 6/03/2010 08:30:00 AM
The DOL reports on weekly unemployment insurance claims:
In the week ending May 29, the advance figure for seasonally adjusted initial claims was 453,000, a decrease of 10,000 from the previous week's revised figure of 463,000. The 4-week moving average was 459,000, an increase of 1,750 from the previous week's revised average of 457,250.
...
The advance number for seasonally adjusted insured unemployment during the week ending May 22 was 4,666,000, an increase of 31,000 from the preceding week's revised level of 4,635,000.
 Click on graph for larger image in new window.
This graph shows the 4-week moving average of weekly claims since 1971.
The four-week average of weekly unemployment claims increased this week by 1,750 to 459,000.
The dashed line on the graph is the current 4-week average. The current level of 453,000 (and 4-week average of 459,000) is still high, and suggests ongoing weakness in the labor market.
David Greenlaw at Morgan Stanley offered some possible reasons that claims have stayed elevated such as more ineligible filers and that "construction workers tend to file more frequently", although I'm not convinced. This is still disappointing ... the 4-week average has been moving sideways since December.
ADP: Private Employment increased 55,000 in May
by Calculated Risk on 6/03/2010 08:15:00 AM
ADP reports:
Nonfarm private employment increased 55,000 from April to May 2010 on a seasonally adjusted basis, according to the ADP National Employment Report. The estimated change in employment from March to April 2010 was revised, from an increase of 32,000 to an increase of 65,000.Note: ADP is private nonfarm employment only (no government jobs).
May’s rise in private employment was the fourth consecutive monthly gain. However, over these four months the increases have averaged a modest 39,000. The slow pace of improvement from February through May is consistent with the pause in the decline of initial unemployment claims that occurred during the winter months.
This is close to the consensus forecast of ADP showing an increase of 60,000 private sector jobs in May.
The BLS reports tomorrow, and the consensus is for an increase of 540,000 payroll jobs in May, on a seasonally adjusted (SA) basis, with over 400,000 temporary Census 2010 jobs.
Wednesday, June 02, 2010
Research: 270 Days is Optimal Time in Foreclosure
by Calculated Risk on 6/02/2010 11:54:00 PM
BofA executive Jack Schakett made some interesting comments earlier today:
"There is a huge incentive for customers to walk away because getting free rent and waiting out foreclosure can be very appealing to customers."Schakett noted that the foreclosure process is currently taking 13 to 14 months ...
For many the timeframe is apparently much longer. On Monday David Streitfeld wrote in the NY Times: Owners Stop Paying Mortgages, and Stop Fretting
The average borrower in foreclosure has been delinquent for 438 days before actually being evicted, up from 251 days in January 2008, according to LPS Applied Analytics.These long foreclosure time lines can have a significant adverse impact on housing.
...
More than 650,000 households had not paid in 18 months, LPS calculated earlier this year. With 19 percent of those homes, the lender had not even begun to take action to repossess the property ...
Housing economist Tom Lawler alerted me to a 2008 research paper by Freddie Mac economists Amy Crews Cutts and William A. Merrill: Interventions in Mortgage Default: Policies and Practices to Prevent Home Loss and Lower Costs. They studied the foreclosure time lines and costs in several states and found that 270 days is sufficient time to allow the borrower to cure, and any more time actually incentivizes the borrower to strategically default:
There are many challenges that policy makers, investors, servicers and borrowers face in minimizing the incidence of home loss through foreclosure. Among them is the tension between too little time in the foreclosure process, such that some borrowers are unable to recover from relatively mild setbacks before they lose the home but investors minimize pre-foreclosure time related costs, and too much time in the foreclosure process, such that the borrower is incented to let the home go to foreclosure sale during which no mortgage payments are made (in essence, free rent for a significant time) and investor costs rise rapidly.One of unintended consequences of the government foreclosure delaying strategy (probably aimed at limiting supply and supporting house prices), is that strategic defaults have gained fairly widespread acceptance. And that means the eventual cost to the taxpayer will be higher than if the lenders had either modified the loans, or foreclosed, or approved a short sale, within about 270 days.
...
A sweet spot for the optimal time in foreclosure likely exists around a statutory timeline of 120 days (the current national median, and equivalent to 270 days after adding in 150 days for pre-referral loss mitigation activities by servicers through workouts) in which the borrower’s incentives are aligned with both a high probability of curing out of the foreclosure and keeping the pre-foreclosure costs to the investor contained.
Housing Bust and Labor Immobility
by Calculated Risk on 6/02/2010 08:47:00 PM
Here is a theme we've been discussing for a few years - when a homeowner is underwater, it is difficult to make a career move ...
From Rana Cash at the Atlanta Journal-Constitution: Real estate market stalls recruiting, promotions (ht Ann)
When executive Wade Ledbetter leaped at the opportunity to move up in his company, the shackles of relocation snatched him back down to earth.Negative equity is impacting one of the historic strengths of the U.S. labor market - the ability of households to easily move from one region to another for a better employment opportunity.
That fabulous promotion came with a price: The $30,000 he’d invested in home improvements, the 20 percent he’d put down on his house and the extra payment every year for 7 1/2 years would be a wash, along with settling on a selling price well below what he’d paid for the home and just about all its contents. Add living away from his family in a one-bedroom apartment for eight months while his home languished on the market and his frustration accrued.
“It was horrible,” said Ledbetter, who relied in part on relocation assistance from his company. “It was constant, horrid stress. There were a number of times I said to myself, ‘What have I done?’ ”
Personal Bankruptcy Filings increase 9% compared to May 2009
by Calculated Risk on 6/02/2010 05:48:00 PM
From the American Bankruptcy Institute: May Consumer Bankruptcy Filings up 9 Percent from Last Year
The 136,142 consumer bankruptcies filed in May represented a 9 percent increase nationwide over the 124,838 filings recorded in May 2009, according to the American Bankruptcy Institute (ABI), relying on data from the National Bankruptcy Research Center (NBKRC). NBKRC’s data also showed that the May consumer filings represented a 6 percent decrease from the 144,490 consumer filings recorded in April 2010. ...
“While consumer filings dipped slightly from last month, housing debt and other financial burdens weighing on consumers are still a cause for concern,” said ABI Executive Director Samuel J. Gerdano. “Consumer filings this year remain on track to top 1.6 million filings.”
 Click on graph for larger image in new window.
This graph shows the non-business bankruptcy filings by quarter using monthly data from the ABI and previous quarterly data from USCourts.gov.
Based on the comment from Gerdano, it appears the ABI has increased their forecast to over 1.6 million filings this year from their earlier forecast of just over 1.5 million filings this year.
Excluding 2005, when the so-called "Bankruptcy Abuse Prevention and Consumer Protection Act of 2005" was enacted (really a pro-lender act), the record was in 2003 when 1.62 million personal bankruptcies were filed. This year will be close to that level.
I wonder how many of these bankruptcy filings are by homeowners who lost their homes in foreclosure and are now trying to extinguish any related recourse debt (1st or 2nd)?
U.S. Light Vehicle Sales 11.6 Million SAAR in May
by Calculated Risk on 6/02/2010 03:54:00 PM
Based on an estimate from Autodata Corp, light vehicle sales were at a 11.63 million SAAR in May. This is up 18.1% from May 2009 (when sales were very low), and up 3.9% from the April sales rate. Click on graph for larger image in new window.
This graph shows the historical light vehicle sales (seasonally adjusted annual rate) from the BEA (blue) and an estimate for May (red, light vehicle sales of 11.63 million SAAR from Autodata Corp).
The second graph shows light vehicle sales since the BEA started keeping data in 1967. Note: dashed line is current month sales rate.
Auto sales have recovered from the low levels of early 2009, but are still at the lowest point of the '90/'91 recession (even with a larger number of registered drivers).
This was slightly above most forecasts of around 11.2 million SAAR.
Report: BofA acknowledges "foreclosure can be very appealing to customers"
by Calculated Risk on 6/02/2010 01:56:00 PM
From Diana Olick at CNBC: BofA: Mortgage Walkaways Have Huge Incentive
On the conference call ... this morning, BofA's credit loss mitigation executive, Jack Schakett, said the amount of strategic defaulters ... are "more than we have ever experienced before." He went on to say, "there is a huge incentive for customers to walk away because getting free rent and waiting out foreclosure can be very appealing to customers."This is just acknowledging the obvious - borrowers have "a huge incentive to walk away" and "foreclosure can be very appealing to customers".
Schakett says the foreclosure process is still taking 13 to 14 months ... and so there's over a year of free rent.
emphasis added
On the conference call, BofA announced a new "Principal Reduction Enhancement" program for certain underwater borrowers. Here is the press release via MarketWatch: Qualified Homeowners Who Are Severely Underwater May Earn Forgiveness of Some Principal Over Three or Five Years
NHRP-eligible loans include subprime, Pay-Option ARM and prime-quality two-year hybrid ARM loans originated by Countrywide on or prior to January 1, 2009, if the amount of principal owed exceeds the current property value by at least 20 percent and the loan is 60 days or more past due.This is really targeted at Option ARMs ... and I guess they are asking borrowers to stop paying so they can get a principal reduction.
General Motors: Sales up 16.6% compared to May 2009
by Calculated Risk on 6/02/2010 11:08:00 AM
From MarketWatch: GM posts 16.6% rise in May U.S. sales:
General Motors Co. on Wednesday reported a 16.6% rise in May U.S. sales from a year ago to 223,822 vehicles.This is based on an easy comparison: in May 2009 U.S. light vehicle sales fell 31% to 9.8 million (SAAR) from 14.2 million (SAAR) in May 2008. The sharp decline last year was due to the financial crisis, the recession, the Chrysler bankruptcy (Chrysler filed for bankruptcy at the end of April, 2009) and reports of the then impending bankruptcy of GM (GM filed for bankruptcy on June 1, 2009).
UPDATE: From Ford: Ford's U.S. May Sales Up 23 Percent
UPDATE2: From MarketWatch: Chrysler U.S. May sales rise 33% to 104,819 units (Chrysler was in BK last May).
UPDATE3: From MarketWatch: Toyota U.S. May sales up 6.7%
I'll add reports from the other major auto companies as updates to this post.
NOTE: Once all the reports are released, I'll post a graph of the estimated total May sales (SAAR: seasonally adjusted annual rate) - usually around 4 PM ET. Most estimates are for about the same level as April (11.2 million SAAR).
Pending Home Sales "Surge" in April
by Calculated Risk on 6/02/2010 10:00:00 AM
From the NAR: Pending Home Sales Surge Continuing
The Pending Home Sales Index, a forward-looking indicator, rose 6.0 percent to 110.9 based on contracts signed in April, from an upwardly revised 104.6 in March, and is 22.4 percent higher than April 2009 when it was 90.6. That follows gains of 7.1 percent in March and 8.3 percent in February.Once again this is no surprise - the tax credit has pulled demand forward, and existing home sales will decline after June (existing home sales are counted when the contract closes).
Pending home sales are at the highest level since last October when the index reached 112.4 and first-time buyers were rushing to beat the initial deadline for the tax credit. The data reflects contracts and not closings, which usually occur with a lag time of one or two months.
I suspect a number of these homes will never close. I've heard stories of buyers entering into two deals at the end of April, intending to cancel one. Also some short sales will probably not close on time because of the lengthy process.
Post title next month: Pending home sales collapse in May!
MBA: Mortgage Purchase Applications lowest level since April 1997
by Calculated Risk on 6/02/2010 07:06:00 AM
The MBA reports: Mortgage Refinance Applications Increase Slightly, Purchase Applications Decline Further
The Refinance Index increased 2.4 percent from the previous week. This was a smaller increase than in previous weeks, but was still the fourth consecutive weekly increase for the Refinance Index and it remains at its highest level since October 2009. The seasonally adjusted Purchase Index decreased 4.1 percent from one week earlier. The Purchase Index decreased for the fourth consecutive week and is currently at the lowest level since April 1997.
...
The average contract interest rate for 30-year fixed-rate mortgages increased to 4.83 percent from 4.80 percent, with points decreasing to 1.05 (including the origination fee) for 80 percent loan-to-value (LTV) ratio loans.
 Click on graph for larger image in new window.
This graph shows the MBA Purchase Index and four week moving average since 1990.
The purchase index has declined sharply following the tax credit related buying, suggesting home sales will fall sharply too. Pending home sales for April will be announced today and a large increase is expected, however May pending home sales will be much lower.
As the Michael Fratantoni, MBA’s Vice President of Research and Economics noted two weeks ago: "The data continue to suggest that the tax credit pulled sales into April at the expense of the remainder of the spring buying season."
Tuesday, June 01, 2010
Fannie Mae: Serious Delinquencies decline in March
by Calculated Risk on 6/01/2010 08:17:00 PM
Breaking a trend ... Click on graph for larger image in new window.
Fannie Mae reported today that the rate of serious delinquencies - at least 90 days behind - for conventional loans in its single-family guarantee business decreased to 5.47% in March, down from 5.59% in February - and up from 3.13% in March 2009.
"Includes seriously delinquent conventional single-family loans as a percent of the total number of conventional single-family loans."
This is the first decline since early 2006 and could be because Fannie (and Freddie and the FHA) are moving ahead with foreclosures.
As noted last month, the combined REO (Real Estate Owned) inventory for Fannie, Freddie and the FHA increased by 22% in Q1 2010 from Q4 2009. The REO inventory (foreclosed homes) increased 59% compared to Q1 2009 (year-over-year comparison). This graph shows the REO inventory for Fannie, Freddie and FHA through Q1 2010.
Even with all the delays in foreclosure, the REO inventory has increased sharply over the last three quarters, from 135,868 at the end of Q2 2009, to 153,007 in Q3 2009, 172,357 at the end of Q4 2009 and now 209,500 at the end of Q4 2010.
These are new records for all three agencies.
Market Update
by Calculated Risk on 6/01/2010 04:33:00 PM
The euro is down to 1.2238 dollars. It has been at about this level for two weeks now ...
The TED spread increased to 39.12 (a measure of credit stress). This is still fairly low, but has been increasing steadily. Note: This is the difference between the interbank rate for three month loans and the three month Treasury. The peak was 463 on Oct 10th and a normal spread is below 50 bps.
This is a slightly different graph from Doug Short of dshort.com (financial planner).
This graph shows the ups and downs of the market since the high in 2007. The S&P 500 is now off 12.27% from the recent high.


