 RSS Feed
 by Calculated Risk on 6/01/2010 02:49:00 PM
Tuesday, June 01, 2010
Impact of Census 2010 on Payroll Report
We are starting to see articles like this from CNBC: Strong Jobs Number on Friday Could Give the Markets a Boost
Economists expect the US economy generated about 540,000 jobs in May—a large portion of which expected to come from Census hiring—and many analysts will be hoping that's enough to assuage investor fears that the European debt contagion could cause a double-dip recession.The BLS will release the May employment report on Friday. The consensus is for a gain of 540,000 payroll jobs in May, and for the unemployment rate to decline slightly to 9.8% (from 9.9%).
As the CNBC article noted, a large portion of the payroll jobs in May will be temporary hires for Census 2010 (May is the peak month). It will be important to remove the Census hiring to try to determine the underlying trend.
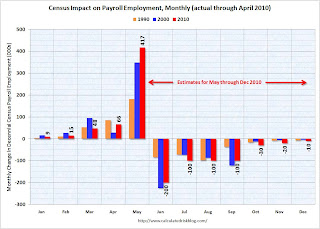
We can estimate the Census hiring using weekly payroll data from the Census bureau (ht Bob_in_MA). If we subtract the number of Temporary 2010 Census Workers in the 2nd week of May from the number in the second week of April, this suggests the Census boost will be around 417K in May. The Census Bureau will release the actual number with the employment report.
 Click on graph for larger image in new window.
This graph shows the actual impact of Census hiring in 1990, 2000, and through April 2010. The impact of the Census hiring, from May through December 2010, are my preliminary estimates.
When the employment report is released on Friday, a key number will be payroll jobs ex-Census - since the Census will probably add over 400,000 temporary payroll jobs (these are real jobs, but they mask the underlying trend). This temporary hiring will also push down the unemployment rate in May by 0.1% or 0.2% based on previous decennial Census hiring.
Most ex-Census forecasts are in the 130,000 to 150,000 range (although most forecasts only release the headline number). This would be a decrease from the 224,000 ex-Census payroll jobs in April.
Starting in June, the Census will negatively impact the payroll report. My preliminary estimate is for a decline of 200,000 Census payroll jobs in June (see graph above). If the underlying trend is a positive 200,000 payroll jobs, the headline number will be zero! And that will understate the underlying trend, just like the 500,000+ will overstate the trend in May. So we will need to adjust for the decennial Census for most of this year.
Distressed House Sales: Movin' on up!
by Calculated Risk on 6/01/2010 12:58:00 PM
From Carolyn Said at the San Francisco Chronicle: Foreclosures shifting to affluent ZIP codes
Foreclosures are going upscale across the Bay Area. ... Even more striking is the growth of mortgage defaults - the first step in the foreclosure process - in affluent ZIP codes.Option ARMs were very popular in the mid-to-high end bubble areas.
While the high-end numbers are far shy of the massive wave of lower-priced foreclosures, the growth reflects a significant shift in the foreclosure landscape ... Mortgage distress has moved upstream in part because of economic conditions ... Also in play [are] option ARM (adjustable rate mortgage) that's just beginning to cause problems.
Previous Chronicle analyses have found that option ARMs were heavily used in the Bay Area, accounting for 20 percent of all homes bought or refinanced here from 2004 to 2008. They were used for homes averaging about $823,000 in value.Although many of these loans already recast - or were refinanced - there are still quite a few that will recast over the next couple of years. Since Option ARMs were frequently used as "affordability products", many homeowners will not be able to afford the higher payments when the loans recast.
Carolyn Said also notes that banks prefer short sales to foreclosures in the mid-to-high end areas. So just tracking foreclosures doesn't tell the entire story. I'm seeing more and more high end homes listed as short sales ... and this means there are more distressed sales coming in certain mid-to-high end bubble areas and also more price declines.
Construction Spending increases in April
by Calculated Risk on 6/01/2010 10:30:00 AM
Overall construction spending increased in April, and private construction spending, both residential and non-residential, also increased in April. From the Census Bureau: April 2010 Construction at $847.3 Billion Annual Rate
The U.S. Census Bureau of the Department of Commerce announced today that construction spending during April 2010 was estimated at a seasonally adjusted annual rate of $869.1 billion, 2.7 percent (±1.4%) above the revised March estimate of $845.9 billion. The April figure is 10.5 percent (±1.6%) below the April 2009 estimate of $971.4 billion. ... Spending on private construction was at a seasonally adjusted annual rate of $565.8 billion, 2.9 percent (±1.1%) above the revised March estimate of $549.7 billion.
 Click on graph for larger image in new window.
The first graph shows private residential and nonresidential construction spending since 1993. Note: nominal dollars, not inflation adjusted.
Private residential construction spending appears to have bottomed in early 2009, but has been mostly moving sideways since then. Residential spending is now 61% below the peak of early 2006.
Private non-residential construction spending is now 29% below the peak of late 2008.
 The second graph shows the year-over-year change for private residential and nonresidential construction spending.
Nonresidential spending is off 24.6% on a year-over-year (YoY) basis.
Residential construction spending is now up 4.1% from a year ago (easy comparison), and will probably decline slightly later this year.
Private residential spending will probably exceed non-residential spending later this year - mostly because of continued declines in non-residential spending. Private construction will be a weak sector for some time.
ISM Manufacturing Index Shows Expansion in May
by Calculated Risk on 6/01/2010 10:00:00 AM
PMI at 59.7% in May, down from 60.4% in April.
From the Institute for Supply Management: May 2010 Manufacturing ISM Report On Business®
Economic activity in the manufacturing sector expanded in May for the 10th consecutive month, and the overall economy grew for the 13th consecutive month, say the nation's supply executives in the latest Manufacturing ISM Report On Business®.This was close to expectations of 59.5% and suggests continued growth in the manufacturing sector.
The report was issued today by Norbert J. Ore, CPSM, C.P.M., chair of the Institute for Supply Management™ Manufacturing Business Survey Committee. "The manufacturing sector grew for the 10th consecutive month during May. The rate of growth as indicated by the PMI is driven by continued strength in new orders and production. Employment continues to grow as manufacturers have added to payrolls for six consecutive months. The recovery continues to broaden as 16 of 18 industries report growth. There are a number of reports, particularly in the tech sector, of shortages of components; this is the result of excessive inventory de-stocking during the downturn."
...
ISM's Employment Index registered 59.8 percent in May, which is 1.3 percentage points higher than the 58.5 percent reported in April. This is the sixth consecutive month of growth in manufacturing employment. An Employment Index above 49.8 percent, over time, is generally consistent with an increase in the Bureau of Labor Statistics (BLS) data on manufacturing employment.
emphasis added
Unemployment Rate increases in Europe, Euro Slides
by Calculated Risk on 6/01/2010 08:51:00 AM
The euro is at a four year low this morning at 1.2174 dollars
From Eurostat: Euro area unemployment rate at 10.1%
The euro area1 (EA16) seasonally-adjusted unemployment rate was 10.1% in April 2010, compared with 10.0% in March. It was 9.2% in April 2009. The EU271 unemployment rate was 9.7% in April 2010, unchanged compared with March. It was 8.7% in April 2009.
Eurostat estimates that 23.311 million men and women in the EU27, of whom 15.860 million were in the euro area, were unemployed in April 2010.
Among the Member States, the lowest unemployment rates were recorded in the Netherlands (4.1%) and Austria (4.9%), and the highest rates in Latvia (22.5%), Spain (19.7%) and Estonia (19.0% in the first quarter of 2010).
Compared with a year ago, one Member State recorded a fall in the unemployment rate and twenty-six an increase. The fall was observed in Germany (7.6% to 7.1%), and the smallest increases in Luxembourg (5.3% to 5.4%) and Malta (6.9% to 7.0%). The highest increases were registered in Estonia (11.0% to 19.0% between the first quarters of 2009 and 2010), Latvia (15.4% to 22.5%) and Lithuania (11.2% to 17.4% between the first quarters of 2009 and 2010).
Commodity Prices Decline and Futures
by Calculated Risk on 6/01/2010 12:55:00 AM
 | Click on cartoon for larger image in new window. Cartoon from Eric G. Lewis www.EricGLewis.com (site coming soon) |
From Bloomberg: Commodities’ Biggest Drop Since Lehman Bear Signal
The Journal of Commerce commodity index that includes steel, cattle hides, tallow and burlap plunged 57 percent in May, two years after a decline that foreshadowed the worst recession in half a century. The index of 18 industrial materials declined the most since October 2008 as Europe’s debt crisis widened and China took steps to curb growth.From the WSJ: Steel Prices Under Pressure
From the WSJ: China Bites Into Commodities Reserves
The Dow Jones-UBS Commodity Index last week dropped to its lowest level since July, before recouping some of its losses. The index is down 9.9% this year.The euro is down to 1.226 dollars.
In April, China posted a significant drop in imports for some commodities, leaving many analysts wondering whether China's appetite for commodities has abated.
The Asian markets are off tonight about 0.5% to 1%.
The futures are off somewhat (Dow off 47).
Monday, May 31, 2010
In Foreclosure and ... happy?
by Calculated Risk on 5/31/2010 10:09:00 PM
From David Streitfeld at the NY Times: Owners Stop Paying Mortgages, and Stop Fretting. A few excerpts:
Foreclosure procedures have been initiated against 1.7 million of the nation’s households.Streitfeld provides a few examples. One lady said "The longer I’m in foreclosure, the better."
...
The average borrower in foreclosure has been delinquent for 438 days before actually being evicted, up from 251 days in January 2008, according to LPS Applied Analytics.
...
More than 650,000 households had not paid in 18 months, LPS calculated earlier this year. With 19 percent of those homes, the lender had not even begun to take action to repossess the property ...
This isn't for everyone. Streitfeld quotes Kyle Lundstedt, managing director of Lender Processing Service’s analytics group:
“These people are playing a dangerous game. There are processes in many states to go after folks who have substantial assets postforeclosure.”
Few Jobs for Students this Summer
by Calculated Risk on 5/31/2010 08:54:00 PM
Note: Here is the Weekly Summary and a Look Ahead (it will be a busy week).
From Mickey Meese at the NY Times: Fading Summer Jobs
State and local governments, traditionally among the biggest seasonal employers, are knee-deep in budget woes, and the stimulus money that helped cushion some government job programs last summer is running out. Private employers are also reluctant to hire until the economy shows more solid signs of recovery.
So expect fewer lifeguards on duty at public beaches this summer in California, fewer workers at some Massachusetts state parks and camping grounds and taller grass outside state buildings in Kentucky.
 Click on graph for large image.
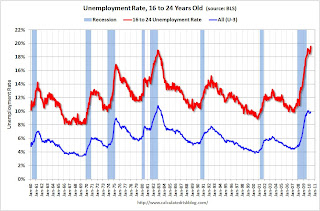
For summer jobs, this will probably be the worst year since the Great Depression.
This graph shows the unemployment rate for workers 16 to 24 years old (from the BLS), and the headline unemployment rate (blue). The unemployment rate hit a record 19.6% in April for this group.
This probably ties into the recent NY Times article on overwhelming student debt. When I was in college, I was able to find summer jobs that helped me pay my way through college (of course I walked 10 miles through the snow and all that too). Times have really changed ...
ECB reports on financial stability, warns of "contagion"
by Calculated Risk on 5/31/2010 04:02:00 PM
The ECB released the twice yearly Finanical Stability Review report today. Here are couple of articles about the report:
From the Financial Times: ECB warns of ‘hazardous contagion’
The eurozone’s financial sector and economy are facing “hazardous contagion” effects from the region’s debt crisis, according to the European Central Bank ... Taking into account writedowns already reported and loan loss provisions, some €90bn of writedowns have yet to feed through, it said. For 2011, it expected banks would have to make additional loan-loss provisions of about €105.There is also a video discussion with Martin Wolf and Richard Haass, president of the Council on Foreign Relations.
except with permission
From the NY Times: Europe’s Banks at Risk From Slower Growth, Report Says
... the E.C.B. expressed particular concern about banks’ need to refinance some €800 billion, or $980 billion, in long-term debt by the end of 2012. Borrowing costs could rise as the banks compete with governments in the bond market “making it challenging to roll over a sizeable amount of maturing bonds by the end of 2012,” the report said.
Chicago: Shadow Condo Inventory
by Calculated Risk on 5/31/2010 12:39:00 PM
Just continuing a theme ...
From Eddie Baeb at Crain's Chicago Business: Nearly vacant condo tower goes back to lender
The 35-story Lexington Park, near Michigan Avenue and Cermak Road, was surrendered last week by its Irish developer through a deed-in-lieu of foreclosure. The private-equity venture that now owns the property acquired Corus Bank’s the distressed condo loans after the Chicago-based lender failed last fall.Hey, they closed on 1% percent of the units!
Just three buyers have closed on Lexington Park’s 333 units, according to property records. The tower, 2138 S. Indiana Ave., was supposed to be ready for occupancy in 2008.
Note that the developer just "walked away" (deed-in-lieu) and the original lender was Corus, the "Condo King". Unless listed for sale, these units are not included in the new or existing home inventory reports - real shadow inventory!
Real PCE Growth in Q2
by Calculated Risk on 5/31/2010 09:13:00 AM
Note: Here is the Weekly Summary and a Look Ahead (it will be a busy week).
On Friday, the BEA released the Personal Income and Outlays report for April. The report showed that Real PCE increased less than 0.1 percent in April (compared to March).
Even though the month-to-month increase was small, this was fairly large increase from January (comparing the first month of Q2 to the first month of Q1).
In calculating PCE for the GDP report, the quarterly change in PCE is based on the change from the average in one quarter, compared to the average of the preceding quarter.
The following graph illustrates how this is calculated. Note that the y-axis doesn't start at zero to better show the change.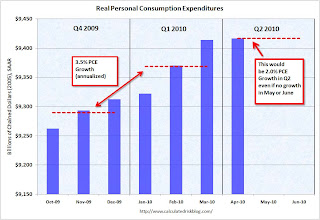 Click on graph for large image.
The blue columns show real PCE by month, and the dashed red lines are the quarterly average.
PCE didn't increase much in January compared to December either, but there was strong growth in February and March. This resulted in PCE growing at an annualized rate of 3.5% for Q1.
Even if PCE was flat in May and June compared to April (preliminary reports suggest growth in May), real PCE would grow at 2.0% in Q2. More likely - with some growth in May and June - PCE will grow closer to 3% in Q2.
This is just a reminder that PCE growth (and GDP growth) is pretty much already baked into Q2.
Best to all.
Sunday, May 30, 2010
Condo Shadow Inventory
by Calculated Risk on 5/30/2010 10:13:00 PM
From Buck Wargo at the Las Vegas Sun: CityCenter condo closings slow in down economy
Through the end of April, MGM Mirage and Dubai World, the owners of the project, have closed on 78 of 1,543 units at the Vdara condo-hotel, according to SalesTraq.This is a reminder that unless these condos are listed, they do not show up as either existing or new home inventory (the new home report doesn't include high rise condos).
... Houston-based Metrostudy reported that Las Vegas has more than 8,200 condominium units that are sitting empty, including those still vacant in CityCenter.
There are some areas - like Las Vegas and Miami - that have a huge number of vacant high rise condos. But there are also many smaller buildings that are mostly vacant in a number of cities (like in New York, Raliegh, N.C. and Irvine, Ca). This is part of the shadow inventory ...
Percent Job Losses During Recessions, aligned at Bottom
by Calculated Risk on 5/30/2010 05:17:00 PM
By request ... here is an update through April with the impact of Census hiring added. Click on graph for larger image.
This graph shows the job losses from the start of the employment recession, in percentage terms - but this time aligned at the bottom of the recession. This assumes that the 2007 recession has reached bottom.
The current recession has been bouncing along the bottom for a few months - so the choice of bottom is a little arbitrary (plus or minus a month or two).
Notice that the 1990 and 2001 recessions were followed by jobless recoveries - and the eventual job recovery was gradual. In earlier recessions the recovery was somewhat similar and a little faster than the decline (somewhat symmetrical).
The dotted line shows the impact of Census hiring.
In April, there were 154,000 temporary 2010 Census workers on the payroll. This barely shows up on the graph.
The number of temporary workers will jump to around 573,000 in May - and the dotted line will be well below the red line. Starting in June, the number of Census workers will decline - and the two lines will meet later this year.
Weekly Summary and a Look Ahead
by Calculated Risk on 5/30/2010 12:01:00 PM
The key economic report this week will be the May Employment Report to be released on Friday. Note: U.S. and U.K. stock markets will be closed on Monday.
On Tuesday, at 10 AM, the ISM Manufacturing index for May will be released (expectations are for a decrease to 59.5 from 60.4 in April) and Construction Spending for April (consensus is for private spending to be flat).
On Wednesday, the automakers will report vehicle sales for May. Expectations are for about a 11.2 million SAAR for light vehicles in May – or about the same rate as in April. The NAR will release April Pending Home Sales at 10 AM (expect a tax credit related increase). And the American Bankruptcy Institute will probably report personal bankruptcy filings for May on Wednesday too. This will probably show another "surge" in filings.
On Thursday, the closely watched initial weekly unemployment claims will be released. Consensus is for a decline to 450K from 460K last week. Also on Thursday, the ADP employment report will be released (consensus is for an increase of 60K private sector jobs, up from 32K in April). Also on Thursday, the May ISM non-manufacturing report will be released. Consensus is for a slight increase to 55.9 from 55.4 in the service sector. Factory Orders for April will also be released.
And on Friday, the BLS will release the May Employment report at 8:30 AM. The consensus is for a gain of 540K payroll jobs in May, and for the unemployment rate to decline slightly to 9.8% (from 9.9%). Of course the 540K includes a substantial number of temporary hires for Census 2010 (May is the peak month). It will be important to remove the Census hiring to try to determine the underlying trend.
We can estimate the Census hiring using this data from the Census bureau (ht Bob_in_MA). If we subtract the number of Temporary 2010 Census Workers in the 2nd week of May from the number in the second week of April, this suggests the Census boost will be around 417K in May. The Census Bureau will release the actual number with the employment report.
Here are two ex-Census forecasts from MarketWatch: Job growth seen a little less robust in May
David Greenlaw, economist at Morgan Stanley, expects a downshift to 105,000 jobs in May excluding the census workers.This is down from 224,000 ex-Census in April.
Economists at Credit Suisse expect private sector job creation around 130,000 in May.
Also on Friday the FDIC will probably have another busy Friday afternoon ... plus there will be several Fed speeches this week.
And a summary of last week:
 Click on graph for larger image in new window.
This graph shows existing home sales, on a Seasonally Adjusted Annual Rate (SAAR) basis since 1993.
Sales in April 2010 (5.77 million SAAR) were 7% higher than last month, and were 22.8% higher than April 2009 (4.61 million SAAR).
Sales surged last November when many first-time homebuyers rushed to beat the initial expiration of the tax credit. There will probably be a further increase in May and June this year. Note: existing home sales are counted at closing, so even though contracts must be signed in April to qualify for the tax credit, buyers have until June 30th to close.
 The second graph shows nationwide inventory for existing homes.
According to the NAR, inventory increased to 4.04 million in April from 3.63 million in March. The all time record high was 4.57 million homes for sale in July 2008.
The next graph shows the year-over-year (YoY) change in reported existing home inventory and months-of-supply. Inventory is not seasonally adjusted, so it really helps to look at the YoY change.
 Inventory increased 2.7% YoY in April, the first YoY increase since 2008.
 This increase in the inventory is especially concerning because the reported inventory is already historically very high, and the 8.4 months of supply in April is well above normal. The months of supply will probably decline over the next two months because of the increase in sales due to the tax credit (reported at closing), but this will be something to watch this summer and later this year.
 This graph shows the nominal not seasonally adjusted Composite 10 and Composite 20 indices (the Composite 20 was started in January 2000).
The Composite 10 index is off 29.8% from the peak, and up slightly in March (SA).
The Composite 20 index is off 29.3% from the peak, and down slightly in March (SA).
 This graph shows the price declines from the peak for each city included in S&P/Case-Shiller indices.
Prices decreased (SA) in 11 of the 20 Case-Shiller cities in March (SA).
Prices in Las Vegas are off 56% from the peak, and prices in Dallas only off 5.8% from the peak.
The Census Bureau reports New Home Sales in April were at a seasonally adjusted annual rate (SAAR) of 504 thousand. This is an increase from the revised rate of 439 thousand in March (revised from 411 thousand).
 The first graph shows monthly new home sales (NSA - Not Seasonally Adjusted).
Note the Red columns for 2010. In April 2010, 48 thousand new homes were sold (NSA).
The record low for the month of April was 32 thousand in 1982 and 2009; the record high was 116 thousand in 2005.
 The second graph shows New Home Sales vs. recessions for the last 45 years.
 Sales of new one-family houses in April 2010 were at a seasonally adjusted annual rate of 504,000 ... This is 14.8 percent (±19.5%)* above the revised March rate of 439,000 and is 47.8 percent (±26.0%) above the April 2009 estimate of 341,000.New home sales are counted when the contract is signed, so this pickup in activity is related to the tax credit.
For new home sales, the tax credit selling ended in April and sales will probably decline sharply in May.
Best wishes to all.
Europe Update
by Calculated Risk on 5/30/2010 09:07:00 AM
NY Times editorial: The Transatlantic Crisis: Europe’s Endangered Banks
... Several [European countries] have weak governments that may not be able to carry through the prescribed fixes. Even if they do, the budget cuts are likely to make them even weaker.From The Times: Spain races to avert banking crisis as euro faces slide
...
This is a recipe for economic stagnation. It also may not avert a debt rescheduling by some of the weaker European countries, which would force European banks to take a cut on their holdings. Sitting on slim cushions of capital reserves, European banks are in no shape for a sharp drop in the value of their assets.
It would be best to recognize that debt restructuring is inevitable.
...
American banks ended 2009 with $1.2 trillion worth of total European debt. ... It would be foolhardy to assume this problem is far away.
One of Spain’s biggest banks was this weekend negotiating a merger with five smaller rivals as part of a desperate government effort to restore confidence in the faltering economy, which threatens to drag down the rest of the eurozone.And also from The Times: Greece urged to give up euro
Caja Madrid, the country’s second-largest savings bank, opened talks in the hope of beating the June 30 deadline to tap a €99 billion (£84 billion) government bank rescue fund.
THE Greek government has been advised by [private] British economists to leave the euro and default on its €300 billion (£255 billion) debt to save its economy.
Saturday, May 29, 2010
Bank Failures per Week
by Calculated Risk on 5/29/2010 09:41:00 PM
I haven't updated this graph for some time ...
There have been 246 bank failures in this cycle (starting in 2007):
| FDIC Bank Failures by Year | 2007 | 3 |
|---|---|
| 2008 | 25 |
| 2009 | 140 |
| 2010 | 78 |
| Total | 246 |
 Click on graph for larger image in new window.
This graph shows bank failures by week in 2008, 2009 and 2010.
The 140 bank failures last year was the highest total since 1992 (181 bank failures).
As the previous post noted, banks are being added to the unofficial problem bank list much faster than they are being removed ... and it looks like there will be something close to 200 failures this year. That is more than in 1992, but probably less than the 271 in 1991. Bank failures peaked at 534 in 1989 during the S&L crisis.
Unofficial Problem Bank List increases to 762 Institutions
by Calculated Risk on 5/29/2010 03:52:00 PM
This is an unofficial list of Problem Banks compiled only from public sources.
Here is the unofficial problem bank list for May 28, 2010.
Changes and comments from surferdude808:
The Unofficial Problem Bank List underwent major changes this week from closings and with the FDIC releasing its enforcement actions for April 2010. The list includes 762 institutions with aggregate assets of $369.2 billion, up from 737 institutions and assets of $363.5 billion last week.CR note: The FDIC reported there were 775 institutions with assets of $431 billion on the official problem bank list at the end of Q1. There are some timing issues, but the overall number of institutions on the unofficial list is very close to the official list. However the assets on the unofficial list are far short of the assets on the official list. This suggests the possibility that a large regional bank may be on the official problem bank list.
There were 31 additions this week. Notable additions include Citizens Bank & Trust Company, Chillicothe, MO ($1.1 billion); Park Cities Bank, Dallas, TX ($1.0 billion); and Magyar Bank, New Brunswick, NJ ($550 million Ticker: MGYR).
Removals include the five failures this week -- Bank of Florida - Southeast, Bank of Florida - Southwest, Bank of Florida - Tampa Bay, Granite Community Bank, NA, and Sun West Bank; and action termination against Indiana Community Bank. Other changes for banks already on the list include Prompt Corrective Action orders issued against two Seattle-based institutions -- First Sound Bank and Washington First International Bank.
The Oil Gusher
by Calculated Risk on 5/29/2010 02:37:00 PM
I know everyone want to discusss this in the comments ...
Here is the live feed from BP.
Here is a discussion of the "top kill" and "junk shot" from the Oil Drum.
I wonder if there is a chemical solution, like a two-part glue. Maybe they could inject a resin down one tube and an accelerator down another tube (both liquids) - and gunk up the Blowout preventer (a "gunk shot"). It would have to be a very fast reaction ...
Pretty grim ...
Key Economic Index suggests Tough Times
by Calculated Risk on 5/29/2010 10:45:00 AM
Just for fun ... in 1926, economist George Taylor suggested the "Hemline Index"; he observed that hemlines moved with stock prices.
And from the NY Times: A Long, Lean Backlash to the Mini. Here is the hot new look:

Does that mean stocks are at a bottom, or that stocks are about to crash?
ATA Truck Tonnage index increases in April
by Calculated Risk on 5/29/2010 08:49:00 AM
From the American Trucking Association: ATA Truck Tonnage Index Increased 0.9 Percent in April
The American Trucking Associations’ advance seasonally adjusted (SA) For-Hire Truck Tonnage Index increased for the sixth time in the last seven months, gaining another 0.9 percent in April. This followed a 0.4 percent increase in March. The latest improvement put the SA index at 110.2 (2000=100), which is the highest level since September 2008. Over the last seven months, the tonnage index grew a total of 6.5 percent.This is the opposite of the report from Ceridian-UCLA that showed diesel fuel consumption down in April, although it might be a difference in the seasonal adjustment factors (NSA this report showed a 4.4% decline). Rail traffic was also up in April.
The not seasonally adjusted index, which represents the change in tonnage actually hauled by the fleets before any seasonal adjustment, equaled 111.3 in April, down 4.4 percent from the previous month.
Compared with April 2009, SA tonnage surged 9.4 percent, which was the fifth consecutive year-over-year gain and the largest increase since January 2005. Year-to-date, tonnage is up 6 percent compared with the same period in 2009.
...
“Tonnage is being boosted by robust manufacturing output and stronger retail sales.” [ATA Chief Economist Bob Costello said] “For most fleets, freight volumes feel better than reported tonnage because the supply situation, particularly in the truckload sector, is turning quickly.”


