 RSS Feed
 by Calculated Risk on 3/23/2010 10:00:00 AM
Tuesday, March 23, 2010
Existing Home Sales Decline in February
The NAR reports: February Existing-Home Sales Ease with Mixed Conditions Around the Country
Existing-home, which are finalized transactions that include single-family, townhomes, condominiums and co-ops, slipped 0.6 percent nationally to a seasonally adjusted annual rate of 5.02 million units in February from 5.05 million in January, but are 7.0 percent higher than the 4.69 million-unit pace in February 2009.
...
Total housing inventory at the end of February rose 9.5 percent to 3.59 million existing homes available for sale, which represents an 8.6-month supply at the current sales pace, up from a 7.8-month supply in January. Raw unsold inventory is 5.5 percent below a year ago.
 Click on graph for larger image in new window.
This graph shows existing home sales, on a Seasonally Adjusted Annual Rate (SAAR) basis since 1993.
Sales in February 2010 (5.02 million SAAR) were 0.6% lower than last month, and were 7.0% higher than February 2009 (4.69 million SAAR).
Sales surged last November when many first-time homebuyers rushed to beat the initial expiration of the tax credit. There will probably be another increase in May and June this year, although that will be probably be smaller than the November increase. Note: existing home sales are counted at closing, so even though contracts must be signed in April to qualify for the tax credit, buyers have until June 30th to close.
 The second graph shows nationwide inventory for existing homes.
According to the NAR, inventory increased to 3.59 million in February from 3.27 million in January. The all time record high was 4.57 million homes for sale in July 2008.
Inventory is not seasonally adjusted and there is a clear seasonal pattern - inventory should increase further in the spring.
 The last graph shows the 'months of supply' metric.
Months of supply increased to 8.6 months in February.
A normal market has under 6 months of supply, so this is high - and probably excludes some substantial shadow inventory.
I'll have more later ...
Geithner on Fannie and Freddie
by Calculated Risk on 3/23/2010 08:21:00 AM
From Bloomberg: Treasury’s Geithner Urges End to Fannie, Freddie ‘Ambiguity’
U.S. Treasury Secretary Timothy F. Geithner said the government should end the “ambiguity” over its involvement in mortgage finance companies Fannie Mae and Freddie Mac.Here is Geithner's testimony (ht TD) Some excerpts (note: Embargo was broken by the Financial Services Committee and several web sites):
“Private gains can no longer be supported by the umbrella of public protection, capital standards must be higher and excessive risk-taking must be appropriately restrained,” Geithner said in testimony prepared for the House Financial Services Committee that was obtained by Bloomberg News. The hearing is scheduled for today at 10 a.m. in Washington.
The Administration has defined a framework of objectives for reform of the mortgage finance system. A reformed housing finance system should deliver stability and efficiency to the housing market, while minimizing the risks and costs borne by the American taxpayer.NOTE: 10 AM ET embargo was broken by several web sites before this was posted.
Objectives of Reform
In considering reform, the Administration will be guided by the view that a stable and wellfunctioning housing finance market should achieve the following objectives:The housing finance system could be redesigned in a variety of ways to meet these objectives. However, the Administration believes that any system that achieves these goals should be characterized by:Widely available mortgage credit. Mortgage credit should be available and distributed on an efficient basis to a wide range of borrowers, including those with low and moderate incomes, to support the purchase of homes they can afford. This credit should be available even when markets may be under stress, at rates that are not excessively volatile. Housing affordability. A well-functioning housing market should provide affordable housing options, both ownership and rental, for low- and moderate-income households. The government has a role in promoting the development and occupancy of affordable single- and multi-family residences for these families. Consumer protection. Consumers should have access to mortgage products that are easily understood, such as the 30-year fixed rate mortgage and conventional variable rate mortgages with straightforward terms and pricing. Effective consumer financial protection should keep unfair, abusive or deceptive practices out of the marketplace and help to ensure that consumers have the information they need about the costs, terms, and conditions of their mortgages. Financial stability. The housing finance system should distribute the credit and interest rate risk that results from mortgage lending in an efficient and transparent manner that minimizes risk to the broader financial and economic system and does not generate excess volatility. The mortgage finance system should not contribute to systemic risk or overly increase interconnectedness from the failure of any one institution. Alignment of incentives. A well functioning mortgage finance system should align incentives for all actors – issuers, originators, brokers, ratings agencies and insurers – so that mortgages are originated and securitized with the goal of long-term viability rather than short term gains. Avoidance of privatized gains funded by public losses. If there is government support provided, such as a guarantee, it should earn an appropriate return for taxpayers and ensure that private sector gains and profits do not come at the expense of public losses. Moreover, if government support is provided, the role and risks assumed must be clear and transparent to all market participants and the American people. Strong regulation. A strong regulatory regime should (i) ensure capital adequacy throughout the mortgage finance chain, (ii) enforce strict underwriting standards and (iii) protect borrowers from unfair, abusive or deceptive practices. Regulators should have the ability and incentive to identify and proactively respond to problems that may develop in the mortgage finance system. Standardization. Standardization of mortgage products improves transparency and efficiency and should provide a sound basis in a reformed system for securitization that increases liquidity, helps to reduce rates for borrowers and promotes financial stability. The market should also have room for innovations to develop new products which can bring benefits for both lenders and borrowers. Support for affordable single- and multifamily-housing. Government support for multifamily housing is important and should continue in a future housing finance system to ensure that consumers have access to affordable rental options. The housing finance system must also support affordable and sustainable ownership options. Diversified investor base and sources of funding. Through securitization and other forms of intermediation, a well functioning mortgage finance system should be able to draw efficiently upon a wide variety of sources of capital and investment both to lower costs and to diversify risk. Accurate and transparent pricing. If government guarantees are provided, they should be priced appropriately to reflect risks across the instruments guaranteed. If there is crosssubsidization in the housing finance system, care must be exercised to insure that it is transparent and fully consistent with the appropriate pricing of the guarantee and at a minimal cost to the American taxpayer. Secondary market liquidity. Today, the US housing finance market is one of the most liquid markets in the world, and benefits from certain innovations like the “to be announced” (or TBA) market. This liquidity has provided a variety of benefits to both borrowers and lenders, including lower borrowing costs, the ability to “lock in” a mortgage rate prior to completing the purchase of a home, flexibility in refinancing, the ability to pre-pay a mortgage at the borrowers’ discretion and risk mitigation. This liquidity also further supports the goal of having well diversified sources of mortgage funding. Clear mandates. Institutions that have government support, charters or mandates should have clear goals and objectives. Affordable housing mandates and specific policy directives should be pursued directly and avoid commingling in general mandates, which are susceptible to distortion.
Monday, March 22, 2010
The Party's Over-Ture
by Calculated Risk on 3/22/2010 11:56:00 PM
"A sampler of versusplus.com musical econoparodies!" (I've posted most of these over the last couple of years):
Obama Adminstration to outline changes for Fannie and Freddie
by Calculated Risk on 3/22/2010 08:45:00 PM
There will be hearing tomorrow about Fannie and Freddie, but the Obama administration will only "outline broad principles".
From Jim Puzzanghera at the LA Times: Pressure rises to overhaul Fannie Mae, Freddie Mac
[I]n a hearing Tuesday, lawmakers will start pressing the Obama administration for an exit strategy [for Fannie Mae and Freddie Mac] ...And from Nick Timiraos and Michale Crittenden at the WSJ: New Plan to Reshape Mortgage Market
"It's clear that Fannie and Freddie, as they currently exist, should be put out of existence, which means the important question is what combination of entities public and private will replace them," said Rep. Barney Frank (D-Mass.), chairman of the House Financial Services Committee.
He has called Treasury Secretary Timothy F. Geithner to testify at the hearing before his committee about how to do that.
The administration will outline broad principles for the future of the mortgage market at the hearing, including stronger consumer protections and explicit guarantees for any government backstop of mortgages.Clearly we can't go back to a structure that privatizes profits and socializes losses.
"The housing-finance system cannot continue to operate as it has in the past," Mr. Geithner says in prepared testimony. The administration won't issue a detailed overhaul proposal until later this year.
Fed's Lockhart: The U.S. Economy and Emerging Risks
by Calculated Risk on 3/22/2010 05:32:00 PM
From Atlanta Fed President Dennis Lockhart: The U.S. Economy and Emerging Risks. Lockhart reviews his general forecast for a modest U.S. recovery and then discusses risks from Greece (sovereign debt) and fiscal uncertainty - especially for U.S. states and local government:
There are other plausible emerging scenarios that are not factored into my formal outlook. I monitor these for evidence that they're materializing—becoming real—and need to be more formally considered. One such concern is what might be called "fiscal uncertainty."Earlier in his speech, Lockhart notes that "stabilization of the housing sector—especially house prices—is likely a precondition for sustained economic recovery". Housing is probably the major risk to Lockhart's view of a modest recovery.
You've all been reading about Greece and the European Union's handling of the Greek fiscal crisis. At the moment a nexus of fiscal uncertainty is the situation playing out in Greece.
Last October, the government of Greece revised its 2009 fiscal deficit sharply higher to more than 12 percent of GDP. Consequently, the ratio of public debt to GDP was revised up by 17 percentage points this year to 125 percent of GDP.
Investors around the world are concerned about Greece's deficit and rising debt. Market pressures, along with European Monetary Union mandates, have forced the government to present a credible plan to tame its deficit. As of today, how this will play out is not clear.
It's worth considering whether this is just a distant development or one with relevance to us here in the United States. What do fiscal problems in Greece have to do with my economic outlook for the United States?
I see three ways the Greek crisis might directly affect the U.S. economy. First, adjustment across the EU to fiscal problems could dampen euro area growth and constrain U.S. exports to that region. The European Union as a whole is this nation's largest export market. Second, related to this, safe haven currency flows from the euro into dollar assets could cause appreciation of the dollar and hurt U.S. export competitiveness. Third is the possibility that the Greek fiscal crisis could lead to a broad shock to financial markets. This could play out in the banking system or in the form of a general retreat from sovereign debt.
At this point, these possibilities are not factored into my outlook in any way. But developments around the Greek situation deserve rapt attention.
We have our own set of fiscal uncertainties in this country—at all levels of government. The National League of Cities projects that municipal governments will face a shortfall of $56 billion to $83 billion from 2010 to 2012. Local governments in this country are pressured by lower sales tax revenues and shrinking property tax digests along with other demands.
On average, state-level governments began fiscal year 2010 with a revenue-expenditure gap of 17 percent. Three states had expected budget gaps in excess of 40 percent. ...
Across the country, state governments have responded to these strains by drawing down rainy day funds, raising taxes, cutting budgets, and furloughing employees.
To date, some amount of spending cuts and tax increases at the state level have been avoided thanks to the federal stimulus package, but that infusion of money is temporary. It appears state budgets next year will need to shrink considerably to get to balance.
I'm sure you're familiar generally with the situation at the federal level. According to the Congressional Budget Office, under current law federal budget deficits rose from an average of about 2.4 percent of GDP in the period from 1970 to 2008 to 10 percent in 2009. No budget path currently under consideration would keep the public debt from growing relative to gross domestic product. Clearly, an ever-rising debt-to-GDP ratio is unsustainable and a matter of great concern.
Government finances are severely strained at all levels. All of these fiscal pressures represent another downside risk for the broad economy.
emphasis added
The Pressure on Malls: More Store Closings
by Calculated Risk on 3/22/2010 02:06:00 PM
Hang Nguyen at the O.C. Register has an interesting post from the Bank of America Merrill Lynch 2010 consumer conference:
Pat Connolly, executive vice president [Williams-Sonoma Inc., which also owns Pottery Barn]: "We are committed to restoring our retail channel profitability to historical levels ... We are working diligently to restructure our portfolio of stores and optimize our sales and costs per square foot. This will be accomplished by selective store closings and lease negotiations ... Over the next three fiscal years, 25 percent of our store leases will reach maturity ... E-commerce is 30 percent of our corporate revenue and it’s very profitable ... even in this environment. The Internet and e-commerce have become the focus on our capital investment."As the leases expire, Williams-Sonoma will be looking to cut the lease rates substantially, or close the stores. This is especially true in multi-store markets.
Sharon McCollam, chief operating officer and chief financial officer: "Every quarter last year, we increased the number of stores that we plan to close ... If we could get the deals (with landlords) done, we would not necessarily want to close stores if you could get to the profitability levels you were historically. ... However, we don’t believe that that is a strategy that can be executed. So there will be additional store closings ...
Other retailers probably have similar plans, and that means that malls will be facing rising vacancies and lower rents for some time.
For Q4 2009, real estate research firm Reis reported that the mall (and strip mall) vacancy rates were the highest since Reis began tracking the data. At the time, Reis economist Ryan Severino said:
"Our outlook for retail properties as a whole is bleak ... we do not foresee a recovery in the retail sector until late 2012 at the earliest."The comments from Williams-Sonoma executives fit with Severino's forecast.
Note: The Q1 mall vacancy rate be released in early April, and I expect more records.
Moody's: CRE Prices increase 1% in January 2010
by Calculated Risk on 3/22/2010 12:55:00 PM
From Bloomberg: U.S. Property Index Rises for Third Straight Month
The Moody’s/REAL Commercial Property Price Index climbed 1 percent from December, Moody’s said today in a report. Values are 40 percent lower than the peak in October 2007. The index fell 24 percent from a year earlier.Below is a comparison of the Moodys/REAL Commercial Property Price Index (CPPI) and the Case-Shiller composite 20 index.
...
The number of transactions fell 8 percent to 376 in January from a year earlier and was lower than December, when buyers and sellers tried to complete deals before the year’s end, according to the report.
“A few months of price gains does not necessarily indicate a sustainable trend, particularly in these difficult times,” Moody’s said.
Notes: Beware of the "Real" in the title - this index is not inflation adjusted. Moody's CRE price index is a repeat sales index like Case-Shiller - but there are far fewer commercial sales - and that can impact prices.
 Click on graph for larger image in new window.
CRE prices only go back to December 2000.
The Case-Shiller Composite 20 residential index is in blue (with Dec 2000 set to 1.0 to line up the indexes).
CRE prices peaked in late 2007 and are now 40% below the peak in October 2007. Prices are at about the same level as early 2003.
DOT: Vehicle Miles Driven decline in January
by Calculated Risk on 3/22/2010 09:45:00 AM
Yesterday we discussed the impact of high oil prices on vehicle miles driven.
And today the Department of Transportation (DOT) reported that vehicle miles driven in January were down from January 2009:
Travel on all roads and streets changed by -1.6% (-3.7 billion vehicle miles) for January 2010 as compared with January 2009. Travel for the month is estimated to be 222.8 billion vehicle miles.
 Click on graph for larger image in new window.
This graph shows the percent change from the same month of the previous year as reported by the DOT.
As the DOT noted, miles driven in January 2010 were down -1.6% compared to January 2009, and miles driven have declined 2.9% compared to January 2008, and are down 4.7% compared to January 2007. This is a multi-year decline, and miles driven appear to be falling again.
Chicago Fed: Economic Activity index decreased in February
by Calculated Risk on 3/22/2010 08:30:00 AM
Note: This is a composite index based on a number of economic releases.
From the Chicago Fed: Index shows economic activity slowed in February
Led by declines in production-related indicators, the Chicago Fed National Activity Index decreased to –0.64 in February, down from –0.04 in January. Three of the four broad categories of indicators that make up the index deteriorated, and only the sales, orders, and inventories category made a positive contribution.
The index’s three-month moving average, CFNAI-MA3, decreased to –0.39 in February from –0.13 in January, but for the second consecutive month, it was higher than at any point since December 2007. February’s CFNAI-MA3 suggests that growth in national economic activity was below its historical trend.
...
Most of the weakness in the index continued to stem from the consumption and housing category. ... Employment-related indicators also made a negative contribution to the index, contributing –0.16 to the index in February compared with –0.02 in January.
 Click on table for larger image in new window.
This graph shows the Chicago Fed National Activity Index (three month moving average) since 1967. According to the Chicago Fed:
A CFNAI-MA3 value below –0.70 following a period of economic expansion indicates an increasing likelihood that a recession has begun. A CFNAI-MA3 value above –0.70 following a period of economic contraction indicates an increasing likelihood that a recession has ended. A CFNAI-MA3 value above +0.20 following a period of economic contraction indicates a significant likelihood that a recession has ended.According to Chicago Fed, it is still too early to call the official recession over - but with the three month average CFNAI-MA3 above -0.70, the likelihood that a recession has ended is increasing.
Sunday, March 21, 2010
Report: China Losing Support of American Business Community
by Calculated Risk on 3/21/2010 09:21:00 PM
From the Financial Times: China to lose ally against US trade hawks
Myron Brilliant, senior vice-president for international affairs, who has previously helped to protect Beijing from hawkish trade policies, told the Financial Times: “I don’t think the Chinese government can count on the American business community to be able to push back and block action [on Capitol Hill].”Mr Brilliant has long supported China, including lobbying for China to join the WTO.
...
Mr Brilliant said corporate America’s attitude had changed in response to a range of “industrial policies” pursued by Beijing, including the undervaluation of the renminbi, which made it harder for US companies to do business and compete with China.
excerpted with permission
And China keeps pushing back - from the WaPo: China's commerce minister: U.S. has the most to lose in a trade war
China's commerce minister warned the United States on Sunday that if it launches a "trade war" against China by levying punitive tariffs on Chinese imports, the United States will suffer the most.This is heating up prior to April 15th release of the Treasury report on worldwide currencies that might name China a "currency manipulator".
...
"You're not going to get 1.3 billion Chinese to change by insulting them," [Commerce Minister Chen Deming] said. "Could it be related to upcoming elections? I don't know. Because economically, it makes no sense."
...
"[Obama] wants exports to double in five years, but I don't know whom he is going to sell them to."
Oil Prices and Vehicle Miles
by Calculated Risk on 3/21/2010 05:03:00 PM
Something for a Sunday - in the weekly look ahead post I forgot to mention that the Department of Transportation (DOT) will release the vehicle miles driven report for January this week.
In early 2008 there was sharp drop in U.S. vehicle miles driven and that was one of the key signs of demand destruction for oil that led me to predict oil prices would decline sharply in the 2nd half of 2008.
First a look at oil prices ... Click on graph for larger image in new window.
This graph shows the daily Cushing, OK WTI Spot Price FOB from the Energy Information Administration (EIA).
With oil prices hoovering around $80 per barrel, I've started looking for possible signs of demand destruction again (see: Oil Prices Push Above $81 per Barrel). Of course there are other factors - like China - but vehicle miles is something to watch in the U.S. The second graph shows monthly oil prices and vehicle miles (month over the same month of the previous year with a 3 month centered average).
Although vehicle miles driven are noisy month to month, it appear that miles driven responds to spikes in oil prices.
For December 2009 - the last month of data - the DOT reported that miles driven were unchanged compared to December 2008 after increasing in 5 of the 6 pervious months. This slow down in miles driven could be because of the sluggish recovery, or it could be because oil prices are starting to impact miles driven.
Weekly Summary and a Look Ahead
by Calculated Risk on 3/21/2010 12:30:00 PM
There will be two key housing reports released this week (existing home sales on Tuesday and new home sales on Wednesday) and plenty of Fed speeches ...
On Monday, the Chicago Fed will release the February Chicago Fed National Activity Index at 8:30 AM ET. Activity in February was probably sluggish. Also on Monday, Treasury Secretary Tim Geithner will speak at the American Enterprise Institute (4:30 PM ET), and Atlanta Fed President Dennis Lockhart will speak in the evening in Florida.
Probably early this week, the Moody's/REAL Commercial Property Price Indices (CPPI) for January will be released. This is a repeat sales price index for Commercial Real Estate (CRE).
On Tuesday, Existing Home sales for February will be released by the National Association of Realtors (NAR) at 10 AM ET. Expectations are for a slight decrease in sales to a 5 million Seasonally Adjusted Annual Rate (SAAR). I’ll take the under. The Census Bureau will also release the Mass Layoffs report for February on Tuesday.
Also on Tuesday the FHFA House Price Index for January will be released (this has been ignored recently), the Richmond Fed Survey (March) at 10 AM ET, and San Francisco Fed President Janet Yellen will speak at 3:35 PM ET. It is widely reported that Yellen will be nominated to be the next Fed Vice Chairman.
On Wednesday the American Institute of Architects’ February Architecture Billings Index will be released - a leading indicator for Commercial Real Estate (CRE). This has been showing significant weakness for some time.
Also on Wednesday, the New Home sales report from the Census Bureau will be released at 10 AM ET. The consensus is for some increase from the record low set in January (309 thousand SAAR), but the number will still be very low. Sales have averaged 370 thousand (SAAR) over the last 12 months, and February will be well below that level.
Also on Wednesday, the weekly MBA mortgage purchase applications index will be released (7 AM ET) and the Durable Goods report for February at 10 AM ET.
There will be more Fed speak on Wednesday: the FOMC’s lone dissenter, Kansas Fed President Thomas Hoenig, speaks at 10:45 AM ET, and outgoing Fed Vice Chairman Donald Kohn speaks at 8 PM ET.
On Thursday, the closely watched initial weekly unemployment claims will be released. Also the Census Bureau will released the Regional and State Employment and Unemployment for February at 10 AM ET.
Cleveland Fed President Sandra Pianalto speaks at 9 AM ET, and Fed Chairman Ben Bernanke testifies before the House Financial Services Committee at 10 AM ET.
On Friday the 3rd estimate of Q4 GDP released (any change will be minor), and the Reuter's/University of Michigan's Consumer sentiment index for March will be released at 9:55 AM ET (consensus is for a slight increase to 73 from 72.5).
Also on Friday the FDIC will probably close several more banks. I think this is the week for Puerto Rico!
And a summary of last week ...
 Click on graph for larger image in new window.
Total housing starts were at 575 thousand (SAAR) in February, down 5.9% from the revised January rate, and up 20% from the all time record low in April 2009 of 479 thousand (the lowest level since the Census Bureau began tracking housing starts in 1959). Starts had rebounded to 590 thousand in June, and have moved mostly sideways for nine months.
Single-family starts were at 499 thousand (SAAR) in February, down 0.6% from the revised January rate, and 40% above the record low in January and February 2009 (357 thousand). Just like for total starts, single-family starts have been at about this level for nine months.
Note: any number under 50 indicates that more builders view sales conditions as poor than good.
 This graph shows the builder confidence index from the National Association of Home Builders (NAHB).
The housing market index (HMI) was at 15 in March. This is a decrease from 17 in February.
The record low was 8 set in January 2009. This is very low - and this is what I've expected - a long period of builder depression.
 From the Fed: "Industrial production edged up 0.1 percent in February following a gain of 0.9 percent in January. ... Capacity utilization for total industry moved up 0.2 percentage point to 72.7 percent, a rate 7.9 percentage points below its average from 1972 to 2009."
This graph shows Capacity Utilization. This series is up 6.5% from the record low set in June (the series starts in 1967).
Capacity utilization at 72.7% is still far below normal - and far below the the pre-recession levels of 80.5% in November 2007.
The Fed's favorite house price indicator from First American CoreLogic’s LoanPerformance ...
 From LoanPerformance: "On a month-over-month basis, the national average home price index decline accelerated, falling by 1.9 percent in January 2010 compared to 0.8 percent in December 2009, indicating the housing market still remains weak."
This graph shows the national LoanPerformance data since 1976. January 2000 = 100.
The index is off 0.7% over the last year, and off 29% from the peak.
The index has declined for five consecutive months.
Here is an update on the price-to-rent ratio using the First Amercican CoreLogic house price index and the Owners' Equivalent Rent (OER) from the BLS.
 This graph shows the price to rent ratio (January 2000 = 1.0).
 This suggests that house prices are still a little too high on a national basis. But it does appear that prices are much closer to the bottom than the top.
Also, OER declined slightly again in February. The price index has declined 6 of the last 8 months, although most of the declines have been very small. With rents still falling, the OER index will probably continue to decline - pushing up the price-to-rent ratio.
Best wishes to all.
I.M.F. Warns Wealthy Nations about Debt
by Calculated Risk on 3/21/2010 09:27:00 AM
From Sewell Chan and Keith Bradsher at the NY Times: I.M.F. Warns Wealthiest Nations About Their Debt
The global economic crisis has left “deep scars” in the fiscal balances of the world’s advanced economies, which should begin to rein in spending next year as the recovery continues, the No.2 official at the International Monetary Fund said Sunday.The U.S. deficit can be separated into 1) a cyclical deficit that will start to decline automatically when the economy begins to recover, and 2) a structural deficit that will be very difficult to resolve. But we need a recovery first, and then we can discuss deficit reduction.
...
For the United States, “a higher public savings rate will be required to ensure long-term fiscal sustainability,” Mr. Lipsky said.
...
“Addressing this fiscal challenge is a key near-term priority, as concerns about fiscal sustainability could undermine confidence in the economic recovery,” Mr. Lipsky said. ... While it makes sense for the world’s largest economies to continue stimulus spending through the end of this year, “fiscal consolidation should begin in 2011, if the recovery occurs at the projected pace,” Mr. Lipsky said.
Mr. Lipsky also discussed the need for rebalancing the world economy, although he didn't criticize China's currency manipulation (he was speaking in China).
Phoenix Housing Market: The Rise of the Investor
by Calculated Risk on 3/21/2010 01:09:00 AM
This is an article describing the changing dynamics in the Phoenix housing market ...
From Craig Anderson at the Arizona Republic: Real-estate investors, who once fueled a run-up in home values, now helping stabilize market (ht JG)
For decades to come, participants in the Valley's housing economy are sure to remember 2009 as the Year of the Investor. ... Investors and bank foreclosures helped boost Maricopa County home sales up to 78,899 in 2009, up from 58,454 the previous year, according to The Arizona Republic's analysis of 2009 Valley home-values data from the Information Market, based in Phoenix.These investors are very different from the "investors" (really speculators) in the 2003 - 2006 period. The current investors are paying all cash - and planning on renting the homes until prices increase. Of course this is supply that will come back on the market eventually ...
... [Alan] Langston, executive director of the Arizona Real Estate Investors Association, based in Tempe, said a number of recent developments have slowed the rate of lender foreclosure in recent months ...
One factor is the rise in short sales, which have replaced about 25 percent of the foreclosures banks were initiating a year ago, he said. ...
Another recent change is the decision by some lenders to use "drop bids" to sell more properties in default to third-party investors before they become bank-owned, he said.
Before the first half of 2009, it was rare for private parties to buy homes at a trustee's deed sale, a cash-only auction for pre-foreclosed properties that takes place daily at the Maricopa County courthouse.
Drop bids changed all that, Langston said. They are a last-minute decision by the lender to slash a property's auction price. Langston said drop bidding has helped lenders avoid taking possession of even more homes while providing new opportunities for buyers.
Saturday, March 20, 2010
Federal Home Loan Bank sues Wall Street Banks for Billions
by Calculated Risk on 3/20/2010 09:33:00 PM
This was lawsuit was filed on March 15th. Here are some details from the bank and see Morgenson's story in the NY Times for more ...
From the Federal Home Loan Bank of San Francisco: Statement Regarding PLRMBS Litigation
Today the Federal Home Loan Bank of San Francisco (Bank) filed complaints in the Superior Court of California, County of San Francisco, against nine securities dealers in relation to certain of the Bank’s investments in private-label residential mortgage-backed securities (PLRMBS). The Bank is seeking to rescind its purchases of 134 securities in 113 securitization trusts, for which the Bank originally paid more than $19.1 billion. The Bank’s complaints allege that the dealers made untrue or misleading statements about the characteristics of the mortgage loans underlying the securities.From Grechen Morgenson at the NY Times: Pools That Need Some Sun
All of the PLRMBS in the Bank’s mortgage portfolio, including those identified in the complaints filed today, were rated AAA when purchased, based on the information provided by the securities dealers.
The suit, filed March 15 in state court in California, seeks the return of the $5.4 billion as well as broader financial damages.All the private mortgage insurers are working hard to rescind as many insurance policies as possible based on fraud and misrepresentation . As are Fannie and Freddie.
...
The defendants in the Federal Home Loan Bank case were among the biggest sellers of mortgage-backed securities back in the day; among those named are Deutsche Bank; Bear Stearns; Countrywide Securities, a division of Countrywide Financial; Credit Suisse Securities; and Merrill Lynch. The securities at the heart of the lawsuit were sold from mid-2004 into 2008 ...
In the complaint, the Federal Home Loan Bank recites a list of what it calls untrue or misleading statements .... The alleged inaccuracies involve disclosures of the mortgages’ loan-to-value ratios ... as well as the occupancy status of the properties securing the loans. ...
Finally, the complaint said, the sellers of the securities made inaccurate claims about how closely the loan originators adhered to their underwriting guidelines.
Fannie Mae and Freddie Mac may force lenders including Bank of America Corp., JPMorgan Chase & Co., Wells Fargo & Co. and Citigroup Inc. to buy back $21 billion of home loans this year as part of a crackdown on faulty mortgages.It makes sense that the Federal Home Loan Banks get more aggressive too.
Economic Outlook: Review of Possible Downside Risks to Forecast
by Calculated Risk on 3/20/2010 06:02:00 PM
Last week I reviewed some possible upside surprises for my economic outlook for sluggish and choppy growth in 2010. The most likely upside surprise appears to be coming from consumer spending and the lack of an increase in the saving rate. I still think the saving rate will continue to rise - although maybe not as fast as I originally expected.
Before I comment on downside risks, a quick comment on forecasts: I think a reasonably intelligent person can always make a compelling bearish argument for the economy, and yet most of the time the economy grows and employment increases. Just something I like to remember.
And although I enjoy being a contrarian at times (like calling the housing bubble and bust, or predicting in 2006 that a recession would start in 2007 - or calling the bottom for housing and autos early last year), I try to avoid the mistake of being a contrarian just to be contrary.
Right now my forecast is middle-of-the-road; no V-shaped recovery and no double-dip recession in 2010. Of the two, I think a double-dip is more likely, but I think we will avoid both. Of course the downside to sluggish growth is that unemployment will probably stay elevated for some time.
Don't get me wrong - I'd like to see 6% to 8% GDP growth and the unemployment rate dropping sharply (a "V-shaped recovery") but that seems very unlikely with the two usual engines of recovery, consumer spending and residential investment, both under pressure.
Downside Risks
There are a number of international risks that might impact the U.S. economy in 2010 such as a sovereign debt issues in Europe and elsewhere, and the escalating dispute with China over currency manipulation or a slowdown in the global economy. My guess is the impact on the U.S. this year will be minimal. And there are also long term issues - like the U.S. structural budget deficit and debt - but this will have little impact in the short term.
So I'll focus on domestic issues, and the number one risk remains housing:
The next wave of distressed sales is building based on analysis by both Barclays Capital and economist Tom Lawler. Although this wave will probably be somewhat smaller than in late 2008, it might be more sustained (it will just keep flooding the market with distressed homes).
After the expiration of the tax credit, demand will probably decline - and prices could start falling again in areas with significant distressed sale activity. Note: For the tax credit, buyers have to sign agreements by April 30th and close by June 30th. This wave of distressed sales will probably be concentrated in the bubble states, but will be more price diverse than the late 2008 foreclosure wave that was primarily in lower end areas.
If prices fall further than I expect that could have a serious impact on banks (more losses) and consumer confidence (less spending).
Note: Most of the forecasts for residential investment (RI) in 2010 were for moderate growth. My forecast was for RI to move sideways with perhaps sluggish growth. This is especially important for construction related industries and employment. Most of the forecasts have recently been revised down substantially, as an example from Reuters: Fannie Mae slashes mortgage investment forecast
Residential investment is likely to drop 17.2 percent in the first quarter and rebound for the rest of 2010, Fannie Mae economists, led by Doug Duncan, said in their outlook. Just a month ago, they expected the first quarter's residential investment would rise 2.8 percent.The other possible downside risks I mentioned last year were (these all still remain although are less likely):
For all of 2010, residential investment will grow 10 percent, slightly below the previous forecast, they said.
An index measuring small-business optimism fell 1.3 points to 88.0 in February, erasing January's gain, according to a monthly survey released Tuesday by the National Association of Independent businesses.To summarize: I think sluggish and choppy growth in 2010 is still likely, but the key downside risks are from falling home prices and less than expected residential investment.
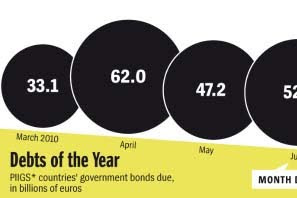
PIIGS Debt Coming Due
by Calculated Risk on 3/20/2010 01:09:00 PM
 Click on graphic for Full Image at Der Spiegel
This graphic is from Anne Seith at Der Spiegel: Moment of Truth for Europe's Common Currency
Greece's financial difficulties have exposed numerous weaknesses which threaten Europe's common currency. Now, policy makers and economic experts are trying to find ways to stabilize the euro. SPIEGEL ONLINE takes a look at the proposals.Seith looks at several proposals from the formation a common EU economic government, to having better and automatic economic stablizers, to a Eurpoean Monetary Fund (EMF). None seem likely in the near term ...
"Worst of the IMF, without the benefits of a loan"
And from Le Monde (Google Translation): The cacophony lowers the euro
Greek Prime Minister George Papandreou has ... called for EU leaders to agree at the summit of Heads of State and Government on 25 and 26 March. Otherwise, it could well turn to the IMF. ... Mr. Papandreou stressed that with the austerity measures demanded by Brussels to Athens, his country had, in theory, "the worst of the IMF, but without the benefits of a loan".
...
Meanwhile, the IMF scenario seems to attract more and more within a Euro disoriented. After Germany, it is the Netherlands, Finland and Sweden are out of the woods Friday to support such intervention. Some are opposed, however, as the President of the European Central Bank (ECB), Jean-Claude Trichet.
Bank Failure Update
by Calculated Risk on 3/20/2010 09:38:00 AM
There have been 205 bank failures in this cycle (starting in 2007):
| FDIC Bank Failures by Year | 2007 | 3 |
|---|---|
| 2008 | 25 |
| 2009 | 140 |
| 2010 | 37 |
| Total | 205 |
 Click on graph for larger image in new window.
The first graph shows bank failures by week in 2008, 2009 and 2010.
The FDIC started fast in 2010, but slowed down when the snow storm hit D.C. - now it looks like the pace is picking back up again.
My (easy) prediction is the FDIC will close more banks in 2010 than in 2009 (more than 140), but fewer banks than in 1989 - peak of the S&L crisis (534 banks).
 The second graph shows bank failures by year since the FDIC was started.
The 140 bank failures last year was the highest total since 1992 (181 bank failures).
For those interested in bank failures by number of institutions and assets, the December Congressional Oversight Panel’s Troubled Asset Relief Program report through Nov 30th for 2009 (see page 45).
Friday, March 19, 2010
Unofficial Problem Bank List increases to 653
by Calculated Risk on 3/19/2010 10:51:00 PM
This is an unofficial list of Problem Banks compiled only from public sources. Changes and comments from surferdude808:
Publication of actions issued by the OCC and OTS contributed to an increase in the number of institutions and aggregate assets on the Unofficial Problem Bank List this week.The list is compiled from regulator press releases or from public news sources (see Enforcement Action Type link for source). The FDIC data is released monthly with a delay, and the Fed and OTC data is more timely. The OCC data is a little lagged. Credit: surferdude808.
This week the list includes 653 institutions with assets of $332.0 billion, up from 640 institutions with assets of $325.6 billion last week. The list increased despite the FDIC best efforts closing seven institutions of which five were on last week's list. The removals because of failure include Advanta Bank Corp. ($1.6 billion Ticker: ADVNQ), Appalachian Community Bank ($1.0 billion Ticker: APAB), First Lowndes Bank ($137 million), American National Bank ($70 million), and State Bank of Aurora ($28 million).
There were 18 institutions with assets of $9.3 billion added to the list this week. Additions include Los Alamos National Bank, Los Alamos, NM ($1.7 billion); NCB, FSB, Hillsboro, OH ($1.6 billon); Citizens First National Bank, Princeton, IL ($1.3 billion Ticker: PNBC); First Chicago Bank & Trust, Itasca, IL ($1.2 billion); and Norstates Bank, Waukegan, IL ($626 million Ticker: NSFC).
Other changes for institutions already on the list include Prompt Corrective Action Orders issued by the OTS against Savings Bank of Maine ($892 million); Inter Savings Bank, FSB ($701 million); and Woodlands Bank ($388 million).
See description below table for Class and Cert (and a link to FDIC ID system).
For a full screen version of the table click here.
The table is wide - use scroll bars to see all information!
NOTE: Columns are sortable - click on column header (Assets, State, Bank Name, Date, etc.)
Class: from FDIC
The FDIC assigns classification codes indicating an institution's charter type (commercial bank, savings bank, or savings association), its chartering agent (state or federal government), its Federal Reserve membership status (member or nonmember), and its primary federal regulator (state-chartered institutions are subject to both federal and state supervision). These codes are:Cert: This is the certificate number assigned by the FDIC used to identify institutions and for the issuance of insurance certificates. Click on the number and the Institution Directory (ID) system "will provide the last demographic and financial data filed by the selected institution".N National chartered commercial bank supervised by the Office of the Comptroller of the Currency SM State charter Fed member commercial bank supervised by the Federal Reserve NM State charter Fed nonmember commercial bank supervised by the FDIC SA State or federal charter savings association supervised by the Office of Thrift Supervision SB State charter savings bank supervised by the FDIC
Bank Failures #34 through #37: Busy Day at FDIC
by Calculated Risk on 3/19/2010 06:22:00 PM
Bair's team dominate the boards
Four more fall today
by Soylent Green is People
From the FDIC: Community & Southern Bank, Carrollton, Georgia, Assumes All of the Deposits of Appalachian Community Bank, Ellijay, Georgia
...As of December 31, 2009, Appalachian Community Bank had approximately $1.01 billion in total assets and $917.6 million in total deposits. ...From the FDIC: Citizens South Bank, Gastonia, North Carolina, Assumes All of the Deposits of Bank of Hiawassee, Hiawassee, Georgia
The FDIC estimates that the cost to the Deposit Insurance Fund (DIF) will be $419.3 million. .... Appalachian Community Bank is the 34th FDIC-insured institution to fail in the nation this year, and the fourth in Georgia. The last FDIC-insured institution closed in the state was Century Security Bank, Duluth, earlier today.
As of December 31, 2009, Bank of Hiawassee had approximately $377.8 million in total assets and $339.6 million in total deposits. ...From the FDIC: First Citizens Bank, Luverne, Alabama, Assumes All of the Deposits of First Lowndes Bank, Fort Deposit, Alabama
The FDIC estimates that the cost to the Deposit Insurance Fund (DIF) will be $137.7 million. ... Bank of Hiawassee is the 35th FDIC-insured institution to fail in the nation this year, and the fifth in Georgia. The last FDIC-insured institution closed in the state was Appalachian Community Bank, Ellijay, earlier today.
As of December 31, 2009, First Lowndes Bank had approximately $137.2 million in total assets and $131.1 million in total deposits....From the FDIC: Northern State Bank, Ashland, Wisconsin, Assumes All of the Deposits of State Bank of Aurora, Aurora, Minnesota
The FDIC estimates that the cost to the Deposit Insurance Fund (DIF) will be $38.3 million. ... First Lowndes Bank is the 36th FDIC-insured institution to fail in the nation this year, and the first in Alabama. The last FDIC-insured institution closed in the state was New South Federal Savings Bank, Irondale, on December 18, 2009.
As of December 31, 2009, State Bank of Aurora had approximately $28.2 million in total assets and $27.8 million in total deposits. ...Seven down today. Probably more to come ...
The FDIC estimates that the cost to the Deposit Insurance Fund (DIF) will be $4.2 million. ... State Bank of Aurora is the 37th FDIC-insured institution to fail in the nation this year, and the fourth in Minnesota. The last FDIC-insured institution closed in the state was 1st American State Bank of Minnesota, Hancock, on February 5, 2010.


