 RSS Feed
 by Calculated Risk on 5/25/2007 11:24:00 AM
Friday, May 25, 2007
More on Existing Home Sales
NAR reported that existing home inventories are at record levels today. To put these numbers into perspective, here are the year-end inventory and months of supply numbers, since 1982 (Note: The only data I have is year-end starting in 1982). Click on graph for larger image.
The current inventory of 4.2 million units is an all time record. The "months of supply" metric is now above the level of the previous housing slump in the early '90s, but still below the levels of the housing bust in the early '80s.
The "months of supply" is calculated by dividing the total inventory by the seasonally adjusted annual rate (SAAR) of sales, and multiplying by 12. Currently inventory is 4.2 million, SAAR sales are 5.99 million giving 8.4 months of supply.
Both the numerator and the denominator are moving in the wrong direction. Not only is inventory at record levels, but sales - though falling - are still significantly above the normal range as a percent of owner occupied units (a measure of turnover). See this post from last year Historical: Existing Home Sales and Inventory.
And writing about sales, the followings shows the actual cumulative existing home sales (through April) vs. three annual forecasts for 2007 (NAR's Lereah, Fannie Mae's Berson, and me). My forecast was for sales to be between 5.6 and 5.8 million units (shown as 5.7 million).
To reach the NAR forecast (revised downward on April 11 to 6.34 million units), sales will have to be slightly above 2006 levels for the remainder of the year. Given tighter lending standards, we can probably already say the recent NAR forecast is "no longer operative"!
April Existing Home Sales
by Calculated Risk on 5/25/2007 10:07:00 AM
UPDATE: Added NAR press release.
The National Association of Realtors (NAR) reports Tighter Lending Standards Affect April Existing-Home Sales
Total existing-home sales including single-family, townhomes, condominiums and co-ops fell 2.6 percent to a seasonally adjusted annual rate of 5.99 million units in April from an upwardly revised level of 6.15 million in March, and are 10.7 percent lower than the 6.71 million-unit pace in April 2006.
...
The national median existing-home price for all housing types was $220,900 in April, down 0.8 percent from April 2006 when the median was $222,600.
 Click on graph for larger image.
The first graph shows the NSA sales per month for the last 3 years.
The pattern of YoY declines in sales is continuing. For New home sales, March is usually the strongest sales month of the year. For existing homes, the Summer months are more critical.

The second graph shows the months of supply. With the months of supply now over 8 months, we should expect falling prices nationwide. The NAR reports that YoY prices fell again in April.
 The third graph shows nationwide inventory for existing homes. According to NAR, inventory increased to a record 4.2 million units in April.
Total housing inventory rose 10.4 percent at the end of April to 4.20 million existing homes available for sale, which represents a 8.4 month supply at the current sales pace, up from a 7.4 month supply in March.I'm surprised that the NAR doesn't mention this is the all time record for inventory (not months of supply though).
All Your Access to Money Are Belong To Us
by Anonymous on 5/25/2007 06:10:00 AM
I have argued that if a mortgage broker isn't acting in a fiduciary capacity, I don't see the point of hiring a broker. It appears I fail to understand this business. From the Wall Street Journal, "Mortgage Brokers: Friends or Foes" (hat tip, yal):
Borrowers often see mortgage brokers as their allies, searching far and wide for just the right home loan at an attractively low price. But many brokers are making it clear they don't see things that way. They are fighting efforts by federal and state politicians to impose a fiduciary duty on them to put their customers' interests first, as lawyers, real-estate agents and financial planners generally are required to do with their clients.
"The mortgage broker does not represent the borrower," says Chris Holbert, president of the Colorado Mortgage Lenders Association. "We sell access to money." The industry group recently opposed language in Colorado legislation that would have required mortgage brokers to act "primarily for the benefit of the borrower." That provision was later deleted. . . .
The National Association of Mortgage Brokers, the main nationwide trade group for brokers, argues that brokers work neither for consumers nor for lenders. Imposing a fiduciary duty would increase the risk of litigation over whether brokers are to blame for loans that go bad, says Joseph Falk, legislative chairman of the association. He adds that the group favors clear disclosures to consumers and no hiding of important details.
I had the idea that "we sell access to money, so you can't sue us" probably didn't make for a winning mission statement, so I wandered over to NAMB's website:
A typical broker has a working relationship with numerous banks and other lenders and provides the consumer with access to hundreds of options when it comes to financing a home. This allows mortgage brokers to provide consumers the most efficient and cost-effective method of obtaining a mortgage that fits the consumer's financial goals and circumstances. Mortgage brokers have helped many consumers, including low-to-moderate income borrowers with less than perfect credit histories, enjoy the benefits of homeownership.
How odd. If you read NAMB's Mission Statement rather carelessly, you'd get the impression that the broker works for the consumer.
Thursday, May 24, 2007
More on April New Home Sales
by Calculated Risk on 5/24/2007 06:20:00 PM
For more graphs, please see my earlier post: April New Home Sales Click on graph for larger image.
The first graph shows New Home Sales vs. Recession for the last 35 years. New Home sales were falling prior to every recession, with the exception of the business investment led recession of 2001. This should raise concerns about a possible consumer led recession in the months ahead.
For Fun: Here is the same graph after the December 2006 sales were reported just a few months ago.
The housing bust was "over".
Ooops!
Once again, this reminds us to take the "just reported" data with a grain of salt.
The third graph compares annual New Home Sales vs. Not Seasonally Adjusted (NSA) New Home Sales through April.
Typically, for an average year, about 35% of all new home sales happen before the end of April. At the current pace, new home sales for 2007 will probably be under 900 thousand - about the same level as the late '90s. This is significantly below the forecasts of even many bearish forecasters.
Fed: Loan Delinquency Rates Increase in Q1
by Calculated Risk on 5/24/2007 05:31:00 PM
 Click on graph for larger image.
The Federal Reserve reports that delinquency rates at U.S. commercial banks increased in Q1 for all types of real estate loans. For residential real estate, the delinquency rate increased to 2.04% from 1.94% in Q4 2006. For commercial real estate, the delinquency rate increased to 1.37% from 1.29% in Q4.
Housing Revisions
by Calculated Risk on 5/24/2007 11:09:00 AM
Here was the original report for April 2006. Many analysts claimed housing had bottomed and the recovery was starting.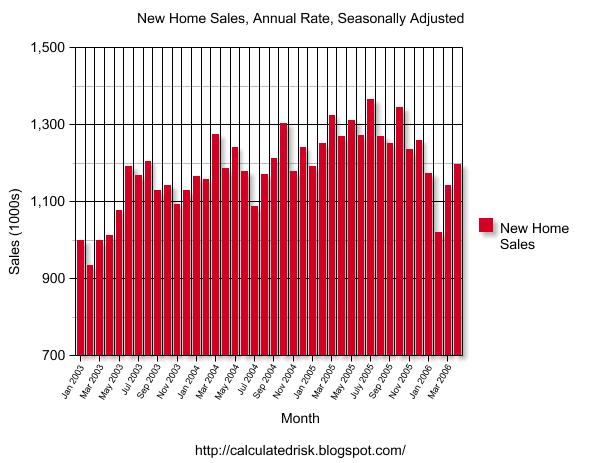
Click on Graph for larger image.
NOTE: The graph starts at 700 thousand units per month to better show monthly variation.
Originally the Census Bureau reported a significant increase in sales for both March and April 2006.
Here is the graph today. The "recovery" in March and April 2006 has been revised away.
I expect the April 2007 sales number to be revised downwards too.
More later today on New Home Sales.
April New Home Sales
by Calculated Risk on 5/24/2007 10:00:00 AM
According to the Census Bureau report, New Home Sales in April were at a seasonally adjusted annual rate of 981 thousand. Sales for March were revised down to 844 thousand, from 858 thousand. Numbers for January and February were revised up.
Click on Graph for larger image.
Sales of new one-family houses in April 2007 were at a seasonally adjusted annual rate of 981,000 ... This is 16.2 percent above the revised March rate of 844,000, but is 10.6 percent below the April 2006 estimate of 1,097,000.
The Not Seasonally Adjusted monthly rate was 92,000 New Homes sold. There were 100,000 New Homes sold in April 2006.
April '07 sales were the lowest since April 2003 (91,000).
The median and average sales prices were up down. Caution should be used when analyzing monthly price changes since prices are heavily revised.
The median sales price of new houses sold in April 2007 was $229,100; the average sales price was $299,100.
The seasonally adjusted estimate of new houses for sale at the end of April was 538,000.
The 538,000 units of inventory is slightly below the levels of the last six months. Inventory numbers from the Census Bureau do not include cancellations - and cancellations are at record levels. Actual New Home inventories are much higher - some estimate about 20% higher.
This represents a supply of 6.5 months at the current sales rate.
This is a surprisingly strong report, and sales will probably be revised down. More later today on New Home Sales.
WSJ on the Construction Employment Riddle
by Calculated Risk on 5/24/2007 01:29:00 AM
From the WSJ: Job Market's Strength May Have Been Overstated
Official employment data may have overstated job growth, especially in the home-building industry, some economists say.Nothing new - maybe it's laid-off illegal immigrants, maybe it's out of work self-employed, maybe there is a lag between the housing slump and layoffs, maybe the BLS missed the turning point, maybe commercial construction has absorbed some of the residential construction workers ...
"There's a lot of potential answers and partial solutions" to the riddle, [Michael Feroli, an economist at J.P. Morgan Chase & Co.] said. "With each one of these stories, you fix one hole, but you spring another leak somewhere else."The "riddle" may be caused by a combination of several factors, but it does appear that the BLS will revise job growth down significantly this year.
Wednesday, May 23, 2007
Quotes from MBA Mortgage Conference
by Calculated Risk on 5/23/2007 03:39:00 PM
From CNNMoney: Speed of subprime bust surprises lenders. A few quotes from the article:
"Last October, I predicted the subprime market would collapse and many issuers would go out of business. But the violence and speed of the market sell-off surprised people."
Michael Marriott, managing director, Credit Suisse, 5/21/2007
"35 percent of what once could be done, can no longer be done," referring to mortgage loan products that have effectively been taken off the shelves.
David Lowman, chief executive of JPMorgan Chase & Co.'s global mortgage business
"Anything that smacks of no-income and no-documentation is history. Anything above 85 percent to 90 percent loan-to-value, anything non-owner occupied, anything ludicrous as to value - like someone stepping up from a $1,000 a month payment to a $6,000 a month - is history."Tough talk, so I'm sure everyone welcomed Comptroller Dugan's comments: Dugan Opens Fire.
Allen Hardester, director of business development, Guaranteed Rate
Stated Income Update: Dugan Opens Fire
by Anonymous on 5/23/2007 10:48:00 AM
I made a little joke the other day about the Comptroller of the Currency reading Angelo Mozilo's remarks to the MBA, and I guess that was too inside baseball for those who are not regulatory afficionados.
John C. Dugan is the C of the C, head of the OCC which is a regulator of some big banks, and he has been one of the major drivers behind what regulatory responses we've been getting, such as they are, over the last few years (like the Nontraditional Mortgage Guidance).
He just let loose with a speech on stated income lending that is gonna have some lenders hiding behind the credenza:
“Sound underwriting – and, for that matter, simple common sense – suggests that a mortgage lender would almost always want to verify the income of a riskier subprime borrower to make sure that he or she had the means to make the required monthly payments,” Mr. Dugan said in a speech to Neighborhood Housing Services of New York.
“But the norm appears to be just the opposite: nearly 50 percent of all subprime loans last year accepted stated income,” he said.
Mr. Dugan noted that in a market where house prices are rising, the risks of stated income loans are masked, since borrowers can refinance if they run into trouble.
“As a result, the rapidly rising housing market of 2003-2005 was the perfect Petri dish to incubate the widespread practice of stated income loans,” he said. “At a very fundamental level, it was a bet that the increasing value of a borrower’s collateral would offset any inadequacy of the borrower’s income.”
However, he added, we are now seeing the results of stated income loans in a market where house prices are falling or failing to increase, and the consequences have been rising delinquencies and foreclosures, with serious costs for families and communities.
While reliance on stated income is not the only cause of today’s problems, Mr. Dugan said, “I do find it telling that, when faced with new housing market conditions, lenders have responded first by tightening standards on stated income.” In addition, he said, one of the first things loan servicers do when trying to decide whether to restructure or foreclose on a mortgage is to seek verification of income.
“Apparently verified income is viewed as a critical factor in determining whether a loan can be saved, which of course begs the question: if loan verification is such an important predictor of the borrower’s ability to repay in the current environment, why wasn’t it equally important when the loan was first made?” Mr. Dugan asked.
The Comptroller said there are clearly some circumstances in which reliance on stated income is appropriate, such as a straight refinancing that doesn’t involve a cash take-out and which is underwritten by the same lender. The lender not only has experience with the borrower, but knows that the new mortgage will be more affordable, and hence more secure, than the one it replaces.
But he said such uses of stated income lending should be the exception, rather than the rule, for three key reasons:
*Stated income is too great a temptation for misrepresentation and, in its most extreme form, outright fraud.
*The practice also undermines transparency: “How can lenders seriously talk about debt-to-income ratios, for example, if the denominator of ‘income’ is really an unknown variable that can be whatever the borrower says it is?” he asked.
*It is not a safe and sound underwriting practice to make mortgage loans that substitute future house price appreciation for borrower income as a key source of repayment, as appears to have been the case in many subprime loans underwritten in the last few years.
Mr. Dugan noted that the use of stated income has been addressed by the federal banking agencies in guidance on home equity lending and nontraditional mortgages.
“Now we must decide whether to address the practice even more strongly in the context of finalizing the guidance on subprime lending,” he said. “For the reasons described above, I believe we should, although how we do so and the extent to which we do it are of course decisions that should only be made after careful consideration of the comments we have received.”
Oh, man. Dad's home, and he's not happy.
Servicing Update: About Those Modifications . . .
by Anonymous on 5/23/2007 07:00:00 AM
Fitch just convened a workshop of RMBS servicers, to find out what's on their minds, and the resulting Special Report, "U.S. RMBS Servicer Workshop," is available here. Anyone who wants further context for some of the questions being raised all over the place about servicing issues generally and subprime/Alt-A in particular should take a look; it's only five pages. My purpose this morning is mostly to continue a process I started in this post and fear I will be ending some time in 2009, but let's be optimistic. Per Fitch:
Servicers also discussed the factors contributing to increased defaults, including flat or decreasing home price appreciation; higher risk products where borrowers were qualified at teaser rates; affordability products; payment shock at ARM resets; high loan-to-value ratio (LTV) or piggyback loans; stated income; lower FICO scores and significant risk layering. Servicers indicated that as little as one year ago, refinances resulting in full payoffs were used most frequently for ARM resets and as a loss mitigation tool for defaulted loans. Today, refinance is not an option for many subprime borrowers due to tightened guidelines and flat or declining home appreciation. Further, third party and short sales, which resulted in some losses, although minimal due to some home price appreciation, are now less effective due to concerns on ultimate value in many markets, and while still less costly than real estate owned (REO) liquidation, are seeing dramatically higher losses.
Let's pause just for a moment to reflect on "refinances . . . as a loss mitigation tool for defaulted loans," or what mortgage wags have always described as "a rolling loan gathers no loss." Some loans were refinanced before they experienced delinquencies (borrowers looking for a way out just before that reset, or as the reset hit but while they could still manage to make the payment), and some were refinanced after they became delinquent. The latter requires a subprime lender to "take out" the loan by definition: it's currently defaulted. So this "cures" a problem from an MBS perspective only to the extent that it moves a problem into someone else's pool or portfolio (depending on what the refinancing lender chooses to do with the new loan).
Now, from the borrower's perspective, the refi may (or may not) actually improve things; that comes down to a question of whether the refinance terms represented a true benefit to the borrower or a long-term solution to the payment difficulties as opposed to, say, a temporary rolling into another short-term teaser to delay the inevitable while accreting yet another set of closing costs in the balance. You would never know which it is from any data provided on the original MBS delinquency report, because the loan is now "gone" from that pool. Hang onto that thought for a minute.
Almost all servicers indicated that they have not used modifications extensively as a loss mitigation tool in the past, primarily because there were other viable options for the borrowers. However, most indicated that they are preparing for significant increases in modification volume. . . . The servicers who had the most experience with loan modifications indicated that a re-default rate for modifications has been in the 30%–35% range, based on an admittedly small number of modifications completed to date. Discussions also included challenges around their modification strategies’ impact on transaction [i.e., the security pool] cash flows. Servicers generally expressed the belief that the ultimate loss to the transaction should be the only consideration in determining the execution of the best loss mitigation strategy. By using best execution calculations (lowest loss to transaction based on current value of property as compared to foreclosure and liquidation loss, which should be regularly updated using actual costs by area) applied on a consistent, documented basis, the actions of the servicer should be defendable to the consumer, their advocates and investors.
OK. I'm not yet prepared to take that 30-35% number as statistical gold, not just because of the small number of mods in question but because we don't know how representative the servicers in question or the loans in question are, how a "re-default" was defined, or how much the terms of the re-defaults were truly comparable to the terms of the successful loans. That said, in the current context it doesn't strike me as all that implausible.
The next question is what, for our present purposes at least, the real difference is between a mod and a refi as a "workout" tool. A very fruitful line of inquiry for someone with access to the data--O rating agencies, hear my cries!--would be to look at the "re-default rates" for those refis.
On the one hand, one might expect the failure rate for mods to be higher than for the refis, given that the "mod pool" involves some percentage of already-refinanced loans, meaning for at least some loans the mods are, actually, the "re-defaults" of the refis. On the other hand, consider that the "modifier" is someone who is acting out of an extreme sensitivity to loss calculations (there's nothing much on the gain side here) and who by definition gets to keep the "problem" if the mod doesn't solve it. The "modifier," in essence, is like our "traditional" hold-to-maturity lender. The "refinancer" is someone who is applying the same underwriting guidelines that got us into this mess in the first place, will make a profit on the transaction, and is undoubtedly planning to put the new loan into a new RMBS, which is why "refinancers" are in such short supply these days. In which hand am I holding the real uglies?
In the absence of any other data you have to guess that. It is highly likely that the final losses on a re-defaulted mod are substantially higher than they would have been had the servicer originally foreclosed. That does not settle the question of how much higher and whether the loss mitigation on the total mods is still in the plus column compared to what losses would have been if no loan had been modified. It also does not mean much at all unless good data on those failures is fed back into the "best execution" model that is used to make modification decisions in the first place. Servicers are going to say they've been doing that, duh. I'm cool with that; I suspect they have. That's why I keep scratching my head over the apparent absence of this data on the trustee reports. That actually came up in the Fitch workshop:
The discussion of investor reporting identified an increased need to develop standardized reporting for modified loans and detailed loan level default reporting. Some servicers indicated that in addition to the large variety of reporting standards and requirements, they are seeing increased requests for more granular reporting, indicating more heightened scrutiny on trustee statements.
Servicers expressed that they expect to see new deal documents which contain more detailed [information] reporting requirements, and most indicated that they would welcome this event. Some servicers indicated that they are prepared to provide this high level of detail, and had in fact attempted to provide it on current deals; however, because the documents did not require the additional fields, certain trustees were not willing or prepared to include this on their monthly reports to investors.
I find that last sentence absolutely believable, by the way. A mortgage servicing database is incredibly rich. No one I know has ever described a trustee report as "incredibly rich" unless the control group was some sticky notes. You would want to ask, at this point, why people buying bonds wouldn't create some demand for deal documents that require the trustee to make the kind of robust reports a servicer can easily produce. You would probably answer that the folks who are buying these bonds don't know enough about how a pig becomes a sausage to know what to ask for, and that, as usual, nobody gave a pork butt until the music stopped ("sausage" metaphors allow a high degree of mixing, so don't start with me). At some level it's just a matter of human nature to prefer the executive summary to the UberNerd reports, just as it is human nature to prefer "nobody told me" to "I failed to ask" when that strategy backfires.
This is why I'm shaking my head all the time over people who bought tranches of securities backed by a bunch of subprime refis (as well as those lovely 100% CLTV purchases made by the speculators' marks), as if that didn't represent a certain recycling of risk. Having done that, they're now a bit miffed to discover that they actually have to live with the "re-default" rate, since the refi door closed and now we have to modify. Honestly, how many times do you have to explain the rules of musical chairs to people? It's not a complicated game like Calvinball (although that might be what some market participants think they're playing).
In any case, I hope we can see the point our dear valiant mort_fin keeps trying to make in the comments, and that I keep failing to make clearly myself: a foreclosed subprime loan can represent the second, third, or nth subprime loan that borrower has had on the same property. In this case, the last loan in the series ended up in foreclosure; the first n loans ended up as prepayments due to refinances (or possibly mods, although that isn't reported as a new loan), which means they count in the "successful" pile of loans. Looking at current rates of delinquency or foreclosure cannot tell you anything about cumulative numbers, and it does not track one borrower all the way through all the refis until the end game. It is perfectly possible, at least hypothetically, to have a situation in which 40% of subprime homeowners eventually end up in FC or short sale or jingle mail, but only after three or four loans, so that on any given month, on the current total book of outstanding subprime loans, "only" 4% are currently in foreclosure.
Such a hypothesis could be tested with empirical data, but not with a mortgage servicer's current delinquency reports. If you wanted to use mortgage data, you would need something like OFHEO's house price index: a large database that has identifiers unique to the borrower, not just the loan or the property, that can identify "repeat transactions" as a chain, can distinguish between a payoff resulting from voluntary sale of the property that recoups the borrower's investment versus a payoff from refinance or distressed sale, and then can connect ultimate disposition of the home over some time horizon to the starting point (the original purchase money loan). Anybody who waves around these "but x% of borrowers make it" claims is blowing smoke if that claim is based on how many loans out of a mix of purchases and refis are in default at the moment. I am sorry to be so bloody repetitive but apparently you can't just shoot this one; you have to cut off its head, drive a stake through its heart, and bury it at the crossroads under a garlic wreath.
One last item from Fitch:
Higher defaults, and anticipated defaults due to the large volume of upcoming adjustable rate mortgage (ARM) resets, require an increase in loss mitigation proficiency and staffing levels. Low home price appreciation and tightening credit standards on new originations have reduced refinancing opportunities for borrowers so these loans will stay in portfolio longer and likely become delinquent. Regulatory and legislative scrutiny may also hamper effective timeline management. In addition, decreasing origination volume will change the ratio between performing loans and non-performing loans, which will be staying in transactions longer and are more costly to service. [my bold]
Two sets of numbers will be getting a lot of scrutiny in the coming months: mortgage-related job losses and non-performing loan ratios. Neither set of numbers will be easy to interpret in isolation from each other or from new origination volumes.
And another note: I did not actually make up that hypothetical 40% above entirely out of thin air. From Carolina Katz Reid's longitudinal study on low-income homeowners, published in 2004 and based on data that was current just up to the beginning of the most recent subprime lending boom:
Of low-income households who became homeowners, only 64 percent remain homeowners after 2 years, compared with 88 percent of high-income homeowners. Over 5 years, only 47 percent remain homeowners, compared with 77 percent of high-income homeowners. The hazard rate of leaving homeownership also varies by income group. For low-income respondents, the risk of returning to the rental market is extremely high in the first three years, but then drops off. The hazard for middle-income respondents is also high in the first three years, although lower than that of low income respondents. For high-income respondents, the hazard rate is more stable over time, hovering at around 5 percent per year. . . .
The dramatic finding is that for low income minorities, low-income whites, and middle-income minorities, the financial returns to homeownership over even 10 or more years of owning a home are extremely small. Indeed, for low-income minority homeowners, the average value of their housing only increased from $50,000 to $65,000—roughly a 30 percent increase over a 10 year period. While this does represent an increase in house value, this rate of return is less than the “riskless” return on Treasury bills.
Thanks, mort_fin, for the reference.
Tuesday, May 22, 2007
Measuring Equity Extraction
by Calculated Risk on 5/22/2007 08:02:00 PM
The gold standard for net equity extraction (or MEW - Mortgage Equity Withdrawal) is the Kennedy-Greenspan data usually available a few days after the Fed's Flow of Funds report is released.
For Q1 2007, the Flow of Funds report is scheduled to be released on June 7, 2007. In the meantime, we can estimate MEW from a couple of sources.
Freddie Mac provides an estimate of Total Home Equity Cashed Out for prime conventional loans. The quarterly amount is shown on the following graph in purple. Freddie Mac chief economist Frank Nothaft noted on May 8th:
... 82 percent of loans refinanced during the first quarter resulted in a new loan balance at least 5 percent greater than the unpaid balance of the original loan, with an estimated $70.5 billion cashed out, only slightly below the $77.0 billion cashed out in the fourth quarter of 2006.Since this is "prime conventional loans" only, this is a subset of the total amount cashed out.
Another early measure is available from the BEA (with a little work). As a supplement to the advance GDP report (released April 27th), the BEA provides an estimate of mortgage interest paid for the quarter, and the effective mortgage interest rate. The blue line shows an estimated MEW derived from the BEA data.
Over the long term, the estimate from the BEA data appears to tracks the Kennedy-Greenspan numbers, however there can be a large variance quarter-to-quarter. Using this method, my "advance estimate" for Q1 2007 MEW is $120 Billion or about 5% of Disposable Personal Income (DPI).
 Click on graph for larger image.
This graph shows the gold standard for equity extraction (Kennedy-Greenspan in red), the Freddie Mac data, and an estimate using the BEA data from the advance GDP report.
It seems obvious that declining MEW in 2007 will negatively impact consumption. The questions are: How much will MEW decline, what will be the size of the impact, and what will be the timing of the impact. No one really knows the answers to these questions. Greenspan has argued that about 50% of MEW flows to consumption. This may be too high or too low - the percentage is difficult to estimate because of other factors, such as income gains and other borrowing such as credit card debt, also impact consumption. I'll try to answer these questions in a future post.
Fremont Sells Commercial Lending Business
by Calculated Risk on 5/22/2007 03:58:00 PM
From Reuters: Fremont shares soar on stake, loan unit sales
Fremont ... said it would sell its commercial real estate lending business to iStar Financial Inc. ...
The company will also sell a minority stake in itself to an investor group led by former S&L executive Gerald Ford for about $80 million in preferred stock and warrants.
...
The company in March sold $4 billion in subprime loans at a $140 million loss at a time rival lenders scrambled to stay afloat.
New York-based iStar, which provides investment capital to real estate owners, agreed to buy Fremont's commercial real estate loans and fund up to about $4.4 billion in unfunded loan commitments. The purchase of the commercial real estate lending unit is expected to be completed by June 30.
Santa Monica, California-based Fremont will receive payment of 30 percent of the portfolio upfront in cash, or $1.9 billion. Going forward it will also receive interest payments from the remaining 70 percent to be controlled by iStar.
Kennedy-Greenspan MEW
by Calculated Risk on 5/22/2007 11:47:00 AM
Here are the updated estimates of home equity extraction for Q4 2006, provided by Jim Kennedy based on the mortgage system presented in "Estimates of Home Mortgage Originations, Repayments, and Debt On One-to-Four-Family Residences," Alan Greenspan and James Kennedy, Federal Reserve Board FEDS working paper no. 2005-41. For Q4 2006, Dr. Kennedy has calculated Net Equity Extraction as $82.8 Billion, or 3.42% of Disposable Personal Income (DPI).
This graph shows the MEW results, both in billions of dollars quarterly (not annual rate), and as a percent of personal disposable income.
Although my estimate (presented yesterday) is close, I'd prefer to use the Kennedy-Greenspan numbers to avoid confusion. I will also present an advance estimate based on the BEA estimates when the advance GDP report is released (more later today on this advance estimate).
MEWPEE: It's Not Just For Ferraris Any More
by Anonymous on 5/22/2007 11:25:00 AM
You will not find the term "MEWPEE" in serious literature published by the Federal Reserve, more's the pity. I just made it up. It stands for Mortgage Equity Withdrawal Profit Extraction Expenditures.
From the OC Register via commenter Curious:
Daniel Sadek played Orange County's subprime lending boom like a card shark dealt the ace and jack of spades.
Just five years ago he was selling cars.
Then, in January 2002, he anted up $250 for a state lender license and started selling home loans through his company, Quick Loan Funding.
Over the next five years, Quick Loan wrote $3.8 billion in mortgages, lending money fast – and often on onerous terms – to people with shaky credit.
Boosted by high fees and interest rates – high even for the subprime industry – Quick Loan's after-tax profits averaged 29 percent of revenue. In 2005, Quick Loan's biggest year, profit topped $37 million.
Sadek used the earnings to live the high life, buying a fleet of Ferraris, Lamborghinis and Porsches, dating a soap opera starlet and producing movies. He flew private jets to Las Vegas, where he gambled with high rollers at the Bellagio Resort. . . .
His staff, once 700 strong, has shriveled to about 125. Monthly loan volume plunged to $30 million from a record $218 million in December 2005.
"I've sold all my cars to keep the company going," says Sadek, 38. "Every property I own is mortgaged to the max."
Thus MEW creates MEWPEE which converts to MEW, which suggests we need a term for the financial position of whoever mortgaged every property Sadek owns. Go for it.
Monday, May 21, 2007
MEW Update
by Calculated Risk on 5/21/2007 05:39:00 PM
I've been patiently waiting for the Q4 2006 release of the unofficial Kennedy-Greenspan Mortgage Equity Withdrawal (MEW) estimates. I haven't seen the Q4 estimates yet, so I've worked up an approximation for MEW. Click on graph for larger image.
The first graph compares the quarterly Net Equity Extraction for the Kennedy-Greenspan method and the new CR method. Note that the Kennedy-Greenspan data (blue) ends in Q3 2006.
Here is my method to estimate MEW (correlation: 97.9%):
1) Calculate the increase in mortgage debt for the quarter from the Fed's Flow of Funds report, Table B.100, line 32.
2) Subtract 80% of the investment in Single-family structures from the BEA, Underlying Detail Tables, Table 5.4.5BU. Private Fixed Investment in Structures by Type, line 37 The second graph shows the MEW results, both in billions of dollars quarterly (not annual rate), and as a percent of personal disposable income.
In the future, I'll update MEW as soon as the Fed's Flow of Funds report is released (probably early June for Q1 2007).
In the meantime we can use the BEA estimate of mortgage payments in Q1 (and effective interest rate) to calculate MEW (this is a rough approach, I'll have more on this estimate soon). Using the BEA data, MEW will probably rebound to around 6% to 7% 5% of DPI in Q1 - so MEW was probably strong in Q1, and declining MEW didn't significantly impact consumption spending in Q1.
More Mozilo
by Anonymous on 5/21/2007 05:00:00 PM
He just keeps talking . . .
Countrywide Chief Executive Angelo Mozilo said depreciating home values are the main culprit.
"The cause of the problem that we have today is decreasing values. That's the cause of the problem, because we didn't have delinquencies and foreclosures when values were going up," he said at a Mortgage Bankers Association conference in Manhattan.
"First-time home buyers were begging us to make them loans because they thought home values were going up significantly, and so they put a lot of pressure on us to make them loans," he said.
If Option ARMs Are Outlawed, Only Outlaws Will Have Option ARMs
by Anonymous on 5/21/2007 11:45:00 AM
Reuters reports that Angelo Mozilo prefers regulations that prevent bad lenders from offering good products, while allowing good lenders to offer good products to keep the playing field level. Or at least I think that's what this means. Possibly it is just the equally uncontroversial claim that no good lender would suffer from a declining RE market if enough bad lenders continued to provide good products to homebuyers so that they could take a problem off the hands of those sellers who are somewhat tired of the good product they got last year. Alternately, it could mean that Mr. Mozilo is so burdened by regulation that he was unable to stand close enough to the podium, and what the mic picked up was some heckler in the audience. Then again the reporter might be stoned, but I don't know how we'd be able to falsify such a claim. Maybe you should just read it:
NEW YORK, May 21 (Reuters) - Countrywide Financial Corp. Chief Executive Angelo Mozilo on Monday said regulation in the subprime mortgage industry will help crooks while hurting lenders and the housing market.
"It's better for the crooks," Mozilo told Reuters before speaking at a Mortgage Bankers Association conference in Manhattan. "It's only the good people who have to comply. Regulation, in my opinion, has caused part of the problem. When they attacked the pay option and interest-only loans, that really put a dent in a lot of the product, which is perfectly good product."
Mozilo also said current guidelines proposed by regulators will exacerbate problems in the housing market.
"The reason why people can't sell their houses is there is no buyers around," Mozilo said. "And there are no buyers around because they can't get the financing."
Now, I'm sure the Golden Calf got around, at some point in his talk, to defining a "good product." I am willing to bet a substantial sum that the definition could be summed up as "a product that would present no risk to a borrower who did not actually need it."
The crucial context, of course, is that Mozilo is talking to his peers at the MBA, who find such logic compelling. Like that's not a prima facie reason to regulate the pants off them . . .
UPDATE: There's a new version of the story that provides meaningful context in which Mr. Mozilo's remarks may possess greater analytic power. I only hope the Comptroller of the Currency had put his drink down before he read it.
Lowe's Cuts Outlook
by Calculated Risk on 5/21/2007 10:43:00 AM
From MarketWatch: Housing slump batters Lowe's bottom line
Lowe's Cos. reported a 12% slump in first quarter profit Monday as the housing slump and tough comparisons sawed into the home improvement retailer's bottom line.Actually, so far, there hasn't been much of a home improvement slump - see What Home Improvement Investment Slump?. With declining Mortgage Equity Withdrawal (MEW), it is very possible that home improvement spending might slump like in the early '80s and '90s.
...
"Multiple factors, including a difficult housing market in many areas, tough comparisons to hurricane rebuilding efforts, and significant lumber and plywood price deflation, continued to create a challenging sales environment in the first quarter," said Robert Niblock, Lowe's chief executive, in the earnings report. "Those anticipated factors were compounded by mixed weather during the quarter."
Anti-Crimes Rhymes in the Times
by Anonymous on 5/21/2007 07:43:00 AM
On mortgage-fraud busting efforts in Georgia:
The three women call themselves the All-Broad Fraud Squad.


