by Calculated Risk on 5/24/2007 11:09:00 AM
Thursday, May 24, 2007
Housing Revisions
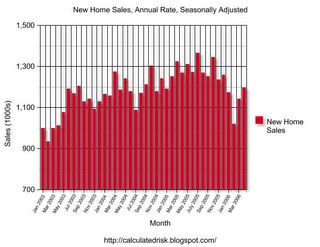
Here was the original report for April 2006. Many analysts claimed housing had bottomed and the recovery was starting.
Click on Graph for larger image.
NOTE: The graph starts at 700 thousand units per month to better show monthly variation.
Originally the Census Bureau reported a significant increase in sales for both March and April 2006.
Here is the graph today. The "recovery" in March and April 2006 has been revised away.
I expect the April 2007 sales number to be revised downwards too.
More later today on New Home Sales.


