 RSS Feed
 by Calculated Risk on 7/13/2025 06:13:00 PM
Sunday, July 13, 2025
Sunday Night Futures
Weekend:
• Schedule for Week of July 13, 2025
Monday:
• No major economic releases scheduled.
From CNBC: Pre-Market Data and Bloomberg futures S&P 500 are down 26 and DOW futures are down 185 (fair value).
Oil prices were up over the last week with WTI futures at $68.45 per barrel and Brent at $70.36 per barrel. A year ago, WTI was at $83, and Brent was at $87 - so WTI oil prices are down about 18% year-over-year.
Here is a graph from Gasbuddy.com for nationwide gasoline prices. Nationally prices are at $3.11 per gallon. A year ago, prices were at $3.50 per gallon, so gasoline prices are down $0.39 year-over-year.
Saturday, July 12, 2025
Real Estate Newsletter Articles this Week: Months-of-supply is higher than the previous 8 years!
by Calculated Risk on 7/12/2025 02:11:00 PM
At the Calculated Risk Real Estate Newsletter this week:
 Click on graph for larger image.
• Part 1: Current State of the Housing Market; Overview for mid-July 2025
• Part 2: Current State of the Housing Market; Overview for mid-July 2025
• 2nd Look at Local Housing Markets in June
• July ICE Mortgage Monitor: Home Prices Continue to Cool, Early Signs of Homeowner Risk Emerge
• 1st Look at Local Housing Markets in June
This is usually published 4 to 6 times a week and provides more in-depth analysis of the housing market.
Schedule for Week of July 13, 2025
by Calculated Risk on 7/12/2025 08:11:00 AM
The key reports this week are June CPI, Retail Sales and Housing Starts.
For manufacturing, the June Industrial Production report and the July New York and Philly Fed manufacturing surveys will be released.
No major economic releases scheduled.
8:30 AM: The Consumer Price Index for June from the BLS. The consensus is for a 0.3% increase in CPI, and a 0.3% increase in core CPI. The consensus is for CPI to be up 2.6% year-over-year and core CPI to be up 2.9% YoY.
8:30 AM: The New York Fed Empire State manufacturing survey for July. The consensus is for a reading of -10.1, up from -16.0.
7:00 AM ET: The Mortgage Bankers Association (MBA) will release the results for the mortgage purchase applications index.
8:30 AM: The Producer Price Index for June from the BLS. The consensus is for a 0.2% increase in PPI, and a 0.2% increase in core PPI.
 9:15 AM: The Fed will release Industrial Production and Capacity Utilization for June.
This graph shows industrial production since 1967.
The consensus is for a 0.1% increase in Industrial Production, and for Capacity Utilization to be unchanged at 77.4%.
2:00 PM: the Federal Reserve Beige Book, an informal review by the Federal Reserve Banks of current economic conditions in their Districts.
8:30 AM: The initial weekly unemployment claims report will be released. The consensus is for initial claims to decrease to 225 thousand from 227 thousand last week.
 8:30 AM: Retail sales for June is scheduled to be released. The consensus is for a 0.2% increase in retail sales.
This graph shows retail sales since 1992. This is monthly retail sales and food service, seasonally adjusted (total and ex-gasoline).
8:30 AM: the Philly Fed manufacturing survey for July. The consensus is for a reading of -0.5, up from -4.0.
10:00 AM: The July NAHB homebuilder survey. The consensus is for a reading of 33, up from 32. Any number below 50 indicates that more builders view sales conditions as poor than good.
10:00 AM: Speech, Fed Governor Adriana Kugler, A View of the Housing Market and U.S. Economic Outlook, At the Housing Partnership Network Symposium, Washington, D.C.
 8:30 AM ET: Housing Starts for June.
 This graph shows single and multi-family housing starts since 2000.
The consensus is for 1.300 million SAAR, up from 1.256 million SAAR in May.
10:00 AM: University of Michigan's Consumer sentiment index (Preliminary for July).
10:00 AM: State Employment and Unemployment (Monthly) for June 2025
Friday, July 11, 2025
"The Office Sector’s Double Whammy"; Record High Office Vacancy Rate
by Calculated Risk on 7/11/2025 03:55:00 PM
From Nick Villa at Moody's The Office Sector’s Double Whammy
The ongoing challenges affecting the office sector have not only resulted in deteriorating space market fundamentals—evidenced by the record-high national office vacancy rate in the second quarter of 2025—but have also had a direct negative impact on capital market activities, including the performance of commercial mortgage-backed securities (CMBS). Figure 1 illustrates the office sector’s “double whammy”—in particular, record-high vacancy rates and CMBS conduit delinquency rates. Specifically, the chart benchmarks the cumulative change in each of these metrics going back to the end of 2019. While the U.S. office vacancy rate has increased by nearly four percentage points over this period, the rise in office-backed CMBS delinquency has been significantly higher at around 11 percentage points.

As one would expect, vacancy rates have slowly inched higher from weaker tenant demand and new supply entering the market, while the long-term nature of most office leases has helped delay the full impact on net operating income. Consequently, this has temporarily masked the underlying CMBS distress, which has recently become more apparent through rising loan delinquencies and declining property valuations. For example, the office-backed CMBS delinquency rate increased by approximately 600 basis points in 2024, which was the fastest annual increase on record since data collection began in 2000. In other words, 2024’s full-year delinquency spike even outpaced levels seen during the Global Financial Crisis (GFC). Concerningly, however, the first six months of 2025 reflected the fastest midyear increase on record, underscoring the unique structural challenges now facing the sector.
 The second graph shows the office vacancy rate over time.
Moody’s Analytics reported that the office vacancy rate was at 20.7% in Q2 2025, up from 20.4% in Q1 2025, and up from 20.1% in Q2 2024.
This is the highest vacancy rate on record and is above the 19.3% peak during the S&L crisis.
Realtor.com Reports Most Active "For Sale" Inventory since December 2019
by Calculated Risk on 7/11/2025 02:48:00 PM
What this means: On a weekly basis, Realtor.com reports the year-over-year change in active inventory and new listings. On a monthly basis, they report total inventory. For May, Realtor.com reported inventory was up 28.9% YoY, but still down 12.9% compared to the 2017 to 2019 same month levels.
Here is their weekly report: Weekly Housing Trends: Latest Data as of July 5
• Active inventory climbed 26.7% year-over-year
The number of homes actively for sale remains on a strong upward trajectory, virtually unchanged from last week, at 26.7% higher than this time last year. This represents the 87th consecutive week of annual gains in inventory. There were more than 1 million homes for sale again last week, marking the ninth week in a row over the threshold and the highest inventory level since December 2019.
• New listings—a measure of sellers putting homes up for sale—rose 9.3% year over year
New listings rose again last week on an annual basis, up 9.3% compared with the same period last year.
• he median list price was up 0.2% year over year
The median list price climbed again this week but is still down 0.3% year to date. The median list price per square foot—which adjusts for changes in home size—rose 0.8% year over year. With inventory on the rise and more than 1 in 5 sellers cutting prices, the market is tilting back toward balance, marked by slowing price growth and increasing buyer leverage.
Q2 GDP Tracking: Mid-to-high 2s
by Calculated Risk on 7/11/2025 11:40:00 AM
From BofA:
Since our last weekly publication, our 2Q GDP tracking is down two-tenths to 2.3% q/q saar. [July 11th estimate]From Goldman:
emphasis added
[W]e have lowered our Q2 GDP tracking estimate by 0.6pp to +3.0% (quarter-over-quarter annualized). Our Q2 domestic final sales estimate stands at +0.7%. [July 3rd estimate]And from the Atlanta Fed: GDPNow

The GDPNow model estimate for real GDP growth (seasonally adjusted annual rate) in the second quarter of 2025 is 2.6 percent on July 9, unchanged from July 3 after rounding. After this morning's wholesale trade report from the US Census Bureau, the nowcast of second-quarter real residential fixed investment growth decreased from -6.4 percent to -6.5 percent, while the nowcast of the contribution of inventory investment to annualized second-quarter real GDP growth decreased from -2.13 percentage points to -2.15 percentage points. [July 9th estimate]
2nd Look at Local Housing Markets in June
by Calculated Risk on 7/11/2025 08:26:00 AM
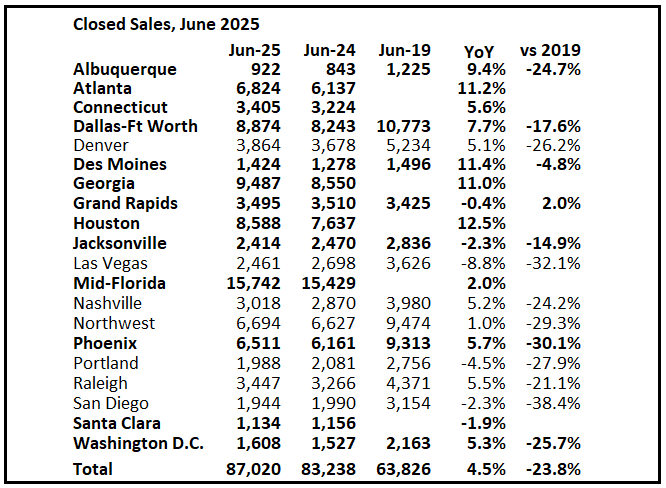
Today, in the Calculated Risk Real Estate Newsletter: 2nd Look at Local Housing Markets in June
A brief excerpt:
Closed sales in June were mostly for contracts signed in April and May, and mortgage rates, according to the Freddie Mac PMMS, averaged 6.73% in April and 6.82% in May (slightly higher than for closed sales in May).There is much more in the article.
...
In June, sales in these early reporting markets were up 4.5% YoY. Last month, in May, these same markets were down 4.7% year-over-year Not Seasonally Adjusted (NSA).
Important: There were more working days in June 2025 (20) as in June 2024 (19). So, the year-over-year change in the headline SA data will be lower than for the NSA data.
...
Many more local markets to come!
Thursday, July 10, 2025
Leading Index for Commercial Real Estate Increased 7% in June
by Calculated Risk on 7/10/2025 04:47:00 PM
From Dodge Data Analytics: Dodge Momentum Index Expands 7% in June
The Dodge Momentum Index (DMI), issued by Dodge Construction Network, grew 6.8% in June to 225.1 (2000=100) from the downwardly revised May reading of 210.9. Over the month, commercial planning grew 7.3% while institutional planning improved 5.7%.
“Nonresidential planning steadily improved in June, alongside strength in warehouse, recreational and data center planning,” stated Sarah Martin, associate director of forecasting at Dodge Construction Network. “Planning momentum in other key sectors – like education, hotels, and retail stores – was more subdued. Expectations for weaker consumer spending and travel demand, as well as volatility around funding, is likely contributing to weaker momentum of projects entering the planning queue for those sectors.”
Warehouse activity gained substantive momentum in June, and data center planning levels remain robust. On the institutional side, large recreational projects propped up the month-over month gain, while healthcare planning momentum continued to accelerate. In June, the DMI was up 20% when compared to year-ago levels. The commercial segment was up 11% from June 2024, and the institutional segment was up 46% after a weak June last year. If all data center projects between 2023 and 2025 are excluded, commercial planning would be up 12% from year-ago levels and the entire DMI would be up 23%.
...
The DMI is a monthly measure of the value of nonresidential building projects going into planning, shown to lead construction spending for nonresidential buildings by a full year.
emphasis added
 Click on graph for larger image.
This graph shows the Dodge Momentum Index since 2002. The index was at 225.1 in June, up from 210.9 the previous month.
According to Dodge, this index leads "construction spending for nonresidential buildings by a full year". This index suggests a pickup in mid-2025, however, uncertainty might impact these projects.
Commercial construction is typically a lagging economic indicator.
Hotels: Occupancy Rate Decreased 0.4% Year-over-year
by Calculated Risk on 7/10/2025 02:19:00 PM
The U.S. hotel industry reported negative year-over-year comparisons, according to CoStar’s latest data through 5 July. ...The following graph shows the seasonal pattern for the hotel occupancy rate using the four-week average.
29 June through 5 July 2025 (percentage change from comparable week in 2024):
• Occupancy: 61.1% (-0.4%)
• Average daily rate (ADR): US$156.71 (-0.9%)
• Revenue per available room (RevPAR): US$95.80 (-1.3%)
emphasis added
 Click on graph for larger image.
The red line is for 2025, blue is the median, and dashed light blue is for 2024. Dashed purple is for 2018, the record year for hotel occupancy.
The 4-week average of the occupancy rate is tracking behind last year and the median rate for the period 2000 through 2024 (Blue).
Note: Y-axis doesn't start at zero to better show the seasonal change.
The 4-week average will increase further during the summer travel season.
Part 2: Current State of the Housing Market; Overview for mid-July 2025
by Calculated Risk on 7/10/2025 11:09:00 AM
Today, in the Calculated Risk Real Estate Newsletter: Part 2: Current State of the Housing Market; Overview for mid-July 2025
A brief excerpt:
Yesterday, in Part 1: Current State of the Housing Market; Overview for mid-July 2025 I reviewed home inventory, housing starts and sales. I noted that the key stories for existing homes are that inventory is increasing sharply, and sales are essentially flat compared to last year (and sales in 2024 were the lowest since 1995). That means prices are under pressure. And there are significant regional differences too.There is much more in the article.
In Part 2, I will look at house prices, mortgage rates, rents and more.
...
The Case-Shiller National Index increased 2.7% year-over-year (YoY) in April and will likely be lower year-over-year in the May report compared to April (based on other data).
...
In the January report, the Case-Shiller National index was up 4.2%, in February up 3.9%, in March up 3.4%, and now, in the April report, up 2.7%.
And the April Case-Shiller index was a 3-month average of closing prices in February, March and April. ("April" is a 3-month average of February, March and April closing prices). February closing prices include some contracts signed in December!
Not only is this trending down, but there is a significant lag to this data.


