 RSS Feed
 by Calculated Risk on 7/11/2025 11:40:00 AM
Friday, July 11, 2025
Q2 GDP Tracking: Mid-to-high 2s
From BofA:
Since our last weekly publication, our 2Q GDP tracking is down two-tenths to 2.3% q/q saar. [July 11th estimate]From Goldman:
emphasis added
[W]e have lowered our Q2 GDP tracking estimate by 0.6pp to +3.0% (quarter-over-quarter annualized). Our Q2 domestic final sales estimate stands at +0.7%. [July 3rd estimate]And from the Atlanta Fed: GDPNow

The GDPNow model estimate for real GDP growth (seasonally adjusted annual rate) in the second quarter of 2025 is 2.6 percent on July 9, unchanged from July 3 after rounding. After this morning's wholesale trade report from the US Census Bureau, the nowcast of second-quarter real residential fixed investment growth decreased from -6.4 percent to -6.5 percent, while the nowcast of the contribution of inventory investment to annualized second-quarter real GDP growth decreased from -2.13 percentage points to -2.15 percentage points. [July 9th estimate]
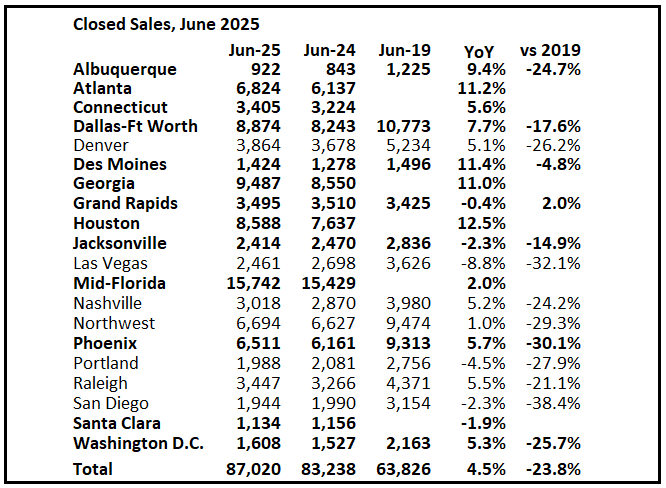
2nd Look at Local Housing Markets in June
by Calculated Risk on 7/11/2025 08:26:00 AM
Today, in the Calculated Risk Real Estate Newsletter: 2nd Look at Local Housing Markets in June
A brief excerpt:
Closed sales in June were mostly for contracts signed in April and May, and mortgage rates, according to the Freddie Mac PMMS, averaged 6.73% in April and 6.82% in May (slightly higher than for closed sales in May).There is much more in the article.
...
In June, sales in these early reporting markets were up 4.5% YoY. Last month, in May, these same markets were down 4.7% year-over-year Not Seasonally Adjusted (NSA).
Important: There were more working days in June 2025 (20) as in June 2024 (19). So, the year-over-year change in the headline SA data will be lower than for the NSA data.
...
Many more local markets to come!
Thursday, July 10, 2025
Leading Index for Commercial Real Estate Increased 7% in June
by Calculated Risk on 7/10/2025 04:47:00 PM
From Dodge Data Analytics: Dodge Momentum Index Expands 7% in June
The Dodge Momentum Index (DMI), issued by Dodge Construction Network, grew 6.8% in June to 225.1 (2000=100) from the downwardly revised May reading of 210.9. Over the month, commercial planning grew 7.3% while institutional planning improved 5.7%.
“Nonresidential planning steadily improved in June, alongside strength in warehouse, recreational and data center planning,” stated Sarah Martin, associate director of forecasting at Dodge Construction Network. “Planning momentum in other key sectors – like education, hotels, and retail stores – was more subdued. Expectations for weaker consumer spending and travel demand, as well as volatility around funding, is likely contributing to weaker momentum of projects entering the planning queue for those sectors.”
Warehouse activity gained substantive momentum in June, and data center planning levels remain robust. On the institutional side, large recreational projects propped up the month-over month gain, while healthcare planning momentum continued to accelerate. In June, the DMI was up 20% when compared to year-ago levels. The commercial segment was up 11% from June 2024, and the institutional segment was up 46% after a weak June last year. If all data center projects between 2023 and 2025 are excluded, commercial planning would be up 12% from year-ago levels and the entire DMI would be up 23%.
...
The DMI is a monthly measure of the value of nonresidential building projects going into planning, shown to lead construction spending for nonresidential buildings by a full year.
emphasis added
 Click on graph for larger image.
This graph shows the Dodge Momentum Index since 2002. The index was at 225.1 in June, up from 210.9 the previous month.
According to Dodge, this index leads "construction spending for nonresidential buildings by a full year". This index suggests a pickup in mid-2025, however, uncertainty might impact these projects.
Commercial construction is typically a lagging economic indicator.
Hotels: Occupancy Rate Decreased 0.4% Year-over-year
by Calculated Risk on 7/10/2025 02:19:00 PM
The U.S. hotel industry reported negative year-over-year comparisons, according to CoStar’s latest data through 5 July. ...The following graph shows the seasonal pattern for the hotel occupancy rate using the four-week average.
29 June through 5 July 2025 (percentage change from comparable week in 2024):
• Occupancy: 61.1% (-0.4%)
• Average daily rate (ADR): US$156.71 (-0.9%)
• Revenue per available room (RevPAR): US$95.80 (-1.3%)
emphasis added
 Click on graph for larger image.
The red line is for 2025, blue is the median, and dashed light blue is for 2024. Dashed purple is for 2018, the record year for hotel occupancy.
The 4-week average of the occupancy rate is tracking behind last year and the median rate for the period 2000 through 2024 (Blue).
Note: Y-axis doesn't start at zero to better show the seasonal change.
The 4-week average will increase further during the summer travel season.
Part 2: Current State of the Housing Market; Overview for mid-July 2025
by Calculated Risk on 7/10/2025 11:09:00 AM
Today, in the Calculated Risk Real Estate Newsletter: Part 2: Current State of the Housing Market; Overview for mid-July 2025
A brief excerpt:
Yesterday, in Part 1: Current State of the Housing Market; Overview for mid-July 2025 I reviewed home inventory, housing starts and sales. I noted that the key stories for existing homes are that inventory is increasing sharply, and sales are essentially flat compared to last year (and sales in 2024 were the lowest since 1995). That means prices are under pressure. And there are significant regional differences too.There is much more in the article.
In Part 2, I will look at house prices, mortgage rates, rents and more.
...
The Case-Shiller National Index increased 2.7% year-over-year (YoY) in April and will likely be lower year-over-year in the May report compared to April (based on other data).
...
In the January report, the Case-Shiller National index was up 4.2%, in February up 3.9%, in March up 3.4%, and now, in the April report, up 2.7%.
And the April Case-Shiller index was a 3-month average of closing prices in February, March and April. ("April" is a 3-month average of February, March and April closing prices). February closing prices include some contracts signed in December!
Not only is this trending down, but there is a significant lag to this data.

Weekly Initial Unemployment Claims Decrease to 227,000
by Calculated Risk on 7/10/2025 08:30:00 AM
The DOL reported:
In the week ending July 5, the advance figure for seasonally adjusted initial claims was 227,000, a decrease of 5,000 from the previous week's revised level. The previous week's level was revised down by 1,000 from 233,000 to 232,000. The 4-week moving average was 235,500, a decrease of 5,750 from the previous week's revised average. The previous week's average was revised down by 250 from 241,500 to 241,250.The following graph shows the 4-week moving average of weekly claims since 1971.
emphasis added
 Click on graph for larger image.
The dashed line on the graph is the current 4-week average. The four-week average of weekly unemployment claims decreased to 235,500.
The previous week was revised down.
Weekly claims were lower than the consensus forecast.
Wednesday, July 09, 2025
Thursday: Unemployment Claims
by Calculated Risk on 7/09/2025 08:17:00 PM
 Note: Mortgage rates are from MortgageNewsDaily.com and are for top tier scenarios.
Thursday:
• At 8:30 AM ET, The initial weekly unemployment claims report will be released. The consensus is for initial claims to increase to 235 thousand from 233 thousand last week.
FOMC Minutes: Rate Cut this year would "likely be appropriate"
by Calculated Risk on 7/09/2025 02:00:00 PM
Different views on possible rate cuts (see paragraph 2).
In considering the outlook for monetary policy, participants generally agreed that, with economic growth and the labor market still solid and current monetary policy moderately or modestly restrictive, the Committee was well positioned to wait for more clarity on the outlook for inflation and economic activity. Participants noted that monetary policy would be informed by a wide range of incoming data, the economic outlook, and the balance of risks. Most participants assessed that some reduction in the target range for the federal funds rate this year would likely be appropriate, noting that upward pressure on inflation from tariffs may be temporary or modest, that medium- and longer-term inflation expectations had remained well anchored, or that some weakening of economic activity and labor market conditions could occur. A couple of participants noted that, if the data evolve in line with their expectations, they would be open to considering a reduction in the target range for the policy rate as soon as at the next meeting. Some participants saw the most likely appropriate path of monetary policy as involving no reductions in the target range for the federal funds rate this year, noting that recent inflation readings had continued to exceed the Committee's 2 percent goal, that upside risks to inflation remained meaningful in light of factors such as elevated short-term inflation expectations of businesses and households, or that they expected that the economy would remain resilient. Several participants commented that the current target range for the federal funds rate may not be far above its neutral level.
Various participants discussed risks that, if realized, would have the potential to affect the appropriate path of monetary policy. Regarding upside risks to inflation, participants noted that, if the imposition of tariffs were to generate a larger-than-expected increase in inflation, if such an increase in inflation were to be more persistent than anticipated, or if a notable increase in medium- or longer-term inflation expectations were to occur, then it would be appropriate to maintain a more restrictive stance of monetary policy than would otherwise be the case, especially if labor market conditions and economic activity remained solid. By contrast, if labor market conditions or economic activity were to weaken materially, or if inflation were to continue to come down and inflation expectations remained well anchored, then it would be appropriate to establish a less restrictive stance of monetary policy than would otherwise be the case. Participants noted that the Committee might face difficult tradeoffs if elevated inflation proved to be more persistent while the outlook for employment weakened. If that were to occur, participants agreed that they would consider how far the economy is from each goal and the potentially different time horizons over which those respective gaps would be anticipated to close.
In considering the likelihood of various scenarios, participants agreed that the risks of higher inflation and weaker labor market conditions had diminished but remained elevated, citing a lower expected path of tariffs, encouraging recent readings on inflation and inflation expectations, resilience in consumer and business spending, or improvements in some measures of consumer or business sentiment. Some participants commented that they saw the risk of elevated inflation as remaining more prominent, or as having diminished by less, than risks to employment. A few participants saw risks to the labor market as having become predominant. They noted some recent signs of weakening in real activity or the labor market, or commented that conditions could weaken in the future, particularly if policy were to remain restrictive. Participants agreed that although uncertainty about inflation and the economic outlook had decreased, it remained appropriate to take a careful approach in adjusting monetary policy. Participants emphasized the importance of ensuring that longer-term inflation expectations remained well anchored and agreed that the current stance of monetary policy positioned the Committee well to respond in a timely way to potential economic developments.
emphasis added
TSA: Airline Travel Mostly Unchanged YoY
by Calculated Risk on 7/09/2025 01:22:00 PM
Here are the daily travel numbers from the TSA.
This data is as of July 8, 2025.
 Click on graph for larger image.
This data shows the 7-day average of daily total traveler throughput from the TSA for the last 6 years.
Air travel is essentially unchanged YoY (7-day average up about 1.8% YoY).
The red line is the seven-day average for 2025.
The red line is the seven-day average for 2025.
Air travel is mostly tracking last year (down slightly YTD).
Part 1: Current State of the Housing Market; Overview for mid-July 2025
by Calculated Risk on 7/09/2025 10:24:00 AM
Today, in the Calculated Risk Real Estate Newsletter: Part 1: Current State of the Housing Market; Overview for mid-July 2025
A brief excerpt:
This 2-part overview for mid-July provides a snapshot of the current housing market.There is much more in the article.
The key stories for existing homes are that inventory is increasing sharply, and sales are essentially flat compared to last year (and sales in 2024 were the lowest since 1995). That means prices are under pressure (although there will not be a huge wave of distressed sales).
And it has been a disappointing year for new homebuilders (but not horrible). Homebuilders have a growing number of completed homes for sales, a larger than normal number of unsold homes under construction and are reducing prices to compete with more existing home inventory. From the NAHB:[T]he latest HMI survey also revealed that 37% of builders reported cutting prices in June, the highest percentage since NAHB began tracking this figure on a monthly basis in 2022. This compares with 34% of builders who reported cutting prices in May and 29% in April. Meanwhile, the average price reduction was 5% in June, the same as it’s been every month since last November. The use of sales incentives was 62% in June, up one percentage point from May.
“Rising inventory levels and prospective home buyers who are on hold waiting for affordability conditions to improve are resulting in weakening price growth in most markets and generating price declines for resales in a growing number of markets,” said NAHB Chief Economist Robert Dietz. “Given current market conditions, NAHB is forecasting a decline in single-family starts for 2025.”Realtor.com reports in the June 2025 Monthly Housing Market Trends Report that new listings were up 6.2% year-over-year in June. And active listings were up 28.9% year-over-year.
Homebuyers found more options in June, as the number of actively listed homes rose 28.9% compared to the same time last year. This builds on May’s 30.1% increase and marks the 20th consecutive month of year-over-year inventory gains. The number of homes for sale topped 1 million (1.08 million) for the second consecutive month and exceeded 2020 levels for the third month in a row, a key pandemic recovery benchmark. Still, June inventory remains 12.9% below typical 2017–19 levels, down from 14.4% in May, indicating the market is closing the pre-pandemic inventory gap at an accelerating pace.


