 RSS Feed
 by Calculated Risk on 4/24/2025 10:00:00 AM
Thursday, April 24, 2025
NAR: Existing-Home Sales Decreased to 4.02 million SAAR in March; Down 2.4% YoY
From the NAR: Existing-Home Sales Receded 5.9% in March
Existing-home sales descended in March, according to the National Association of REALTORS®. Sales slid in all four major U.S. regions. Year-over-year, sales dropped in the Midwest and South, increased in the West and were unchanged in the Northeast.
Total existing-home sales – completed transactions that include single-family homes, townhomes, condominiums and co-ops – fell 5.9% from February to a seasonally adjusted annual rate of 4.02 million in March. Year-over-year, sales drew back 2.4% (down from 4.12 million in March 2024).
...
Total housing inventory registered at the end of March was 1.33 million units, up 8.1% from February and 19.8% from one year ago (1.11 million). Unsold inventory sits at a 4.0-month supply at the current sales pace, up from 3.5 months in February and 3.2 months in March 2024.
emphasis added
 Click on graph for larger image.
This graph shows existing home sales, on a Seasonally Adjusted Annual Rate (SAAR) basis since 1994.
Sales in March (4.02 million SAAR) were down 5.9% from the previous month and were 2.4% below the February 2024 sales rate. This was the 2nd consecutive month with a year--over-year decline, following four consecutive months with a year-over-year increases in sales.
The second graph shows nationwide inventory for existing homes.
 According to the NAR, inventory increased to 1.33 million in March from 1.23 million the previous month.
 According to the NAR, inventory increased to 1.33 million in March from 1.23 million the previous month.
Headline inventory is not seasonally adjusted, and inventory usually decreases to the seasonal lows in December and January, and peaks in mid-to-late summer.
The last graph shows the year-over-year (YoY) change in reported existing home inventory and months-of-supply. Since inventory is not seasonally adjusted, it really helps to look at the YoY change. Note: Months-of-supply is based on the seasonally adjusted sales and not seasonally adjusted inventory.
 Inventory was up 19.8% year-over-year (blue) in March compared to March 2024.
Months of supply (red) increased to 4.0 months in March from 3.5 months the previous month.
As expected, the sales rate was below the consensus forecast. I'll have more later.
The last graph shows the year-over-year (YoY) change in reported existing home inventory and months-of-supply. Since inventory is not seasonally adjusted, it really helps to look at the YoY change. Note: Months-of-supply is based on the seasonally adjusted sales and not seasonally adjusted inventory.
 Inventory was up 19.8% year-over-year (blue) in March compared to March 2024.
 Months of supply (red) increased to 4.0 months in March from 3.5 months the previous month.
As expected, the sales rate was below the consensus forecast. I'll have more later.
Weekly Initial Unemployment Claims Increase to 222,000
by Calculated Risk on 4/24/2025 08:30:00 AM
The DOL reported:
In the week ending April 19, the advance figure for seasonally adjusted initial claims was 222,000, an increase of 6,000 from the previous week's revised level. The previous week's level was revised up by 1,000 from 215,000 to 216,000. The 4-week moving average was 220,250, a decrease of 750 from the previous week's revised average. The previous week's average was revised up by 250 from 220,750 to 221,000.The following graph shows the 4-week moving average of weekly claims since 1971.
emphasis added
 Click on graph for larger image.
The dashed line on the graph is the current 4-week average. The four-week average of weekly unemployment claims decreased to 220,250.
The previous week was revised up.
Weekly claims were close to the consensus forecast.
Wednesday, April 23, 2025
Thursday: Unemployment Claims, Durable Goods, Existing Home Sales
by Calculated Risk on 4/23/2025 08:36:00 PM
 Note: Mortgage rates are from MortgageNewsDaily.com and are for top tier scenarios.
Thursday:
• At 8:30 AM ET, The initial weekly unemployment claims report will be released. Initial claims were at 215 thousand last week.
• Also at 8:30 AM, Durable Goods Orders for March from the Census Bureau. The consensus is for a 0.8% increase in durable goods orders.
• Also at 8:30 AM, Chicago Fed National Activity Index for March. This is a composite index of other data.
• At 10:00 AM, Existing Home Sales for March from the National Association of Realtors (NAR). The consensus is for 4.14 million SAAR, down from 4.26 million.
• At 11:00 AM, the Kansas City Fed manufacturing survey for April.
April Vehicle Forecast: Sales at 17.4 million SAAR, Up 8.6% YoY
by Calculated Risk on 4/23/2025 06:31:00 PM
From WardsAuto: Pre-Tariff U.S. Light-Vehicle Sales Surge Continues in April, Sapping Dealer Inventory (pay content). Brief excerpt:
If the forecast holds firm, inventory will fall below the year-ago month for the first time in nearly three years. Less inventory could take pressure off automakers and dealers to limit price hikes by absorbing some of the higher costs caused by tariffs, if they remain in place. Conversely, it also means a higher mix of pricier vehicles on dealer lots and lower sales volumes – and automakers, at least for now, are more inclined to emphasize production cuts, and not big discounts to consumers, to manage inventory in the face of weakening demand.
emphasis added
 Click on graph for larger image.
This graph shows actual sales from the BEA (Blue), and Wards forecast for April (Red).
On a seasonally adjusted annual rate basis, the Wards forecast of 17.4 million SAAR, would be down 2.1% from last month, and up 8.6% from a year ago.
Car buyers have rushed to buy over the last couple of months to beat the tariffs. There will be payback in coming months.
AIA: "Business conditions at architecture firms soften further"
by Calculated Risk on 4/23/2025 06:06:00 PM
Note: This index is a leading indicator primarily for new Commercial Real Estate (CRE) investment.
From the AIA: ABI March 2025: Business conditions at architecture firms soften further
The ABI/Deltek Architecture Billings Index dipped further from February to 44.1 in March, as even more firms reported a decline in billings from the previous month. Since the ABI first dropped below 50 in October 2022, following the post-pandemic boom, billings have declined 27 of the last 30 months. Unfortunately, this softness is likely to continue as indicators of future work remain weak. Inquiries into new work declined for the second month in March, while the value of newly signed design contracts fell for the thirteenth consecutive month. Clients are increasingly nervous about the uncertain economic outlook, and many remain wary of starting new projects at this time. However, backlogs at architecture firms remain reasonably healthy at 6.5 months, on average, which means that even though little new work is coming in currently, they still have a decent amount in the pipeline.• Northeast (40.5); Midwest (45.5); South (48.3); West (43.0)
Firm billings continued to decline in all regions of the country in March as well. Billings were softest at firms located in the Northeast for the sixth consecutive month but also weakened further at firms located in the West and Midwest. Firms located in the South reported the smallest decline in billings. Business conditions also remained weak at firms of all specializations, with firms with a multifamily residential specialization continuing to report the softest conditions. Billings were trending stronger at firms with an institutional specialization late last year but have softened significantly since then.
...
The ABI score is a leading economic indicator of construction activity, providing an approximately nine-to-twelve-month glimpse into the future of nonresidential construction spending activity. The score is derived from a monthly survey of architecture firms that measures the change in the number of services provided to clients.
emphasis added
• Sector index breakdown: commercial/industrial (46.9); institutional (46.4); multifamily residential (40.3)
 Click on graph for larger image.
This graph shows the Architecture Billings Index since 1996. The index was at 45.5 in February, down from 45.6 in January. Anything below 50 indicates a decrease in demand for architects' services.
This index has indicated contraction for 27 of the last 30 months.
Note: This includes commercial and industrial facilities like hotels and office buildings, multi-family residential, as well as schools, hospitals and other institutions.
This index usually leads CRE investment by 9 to 12 months, so this index suggests a slowdown in CRE investment throughout 2025 and into 2026.
Multi-family billings remained negative has been negative for the last 32 months. This suggests we will see continued weakness in multi-family starts.
U.S. Births Increased in 2024
by Calculated Risk on 4/23/2025 02:17:00 PM
From the National Center for Health Statistics: Births: Provisional Data for 2024. The NCHS reports:
The provisional number of births for the United States in 2024 was 3,622,673, up 1% from 2023. The general fertility rate was 54.6 births per 1,000 females ages 15–44, an increase of less than 1% from 2023. The total fertility rate was 1,626.5 births per 1,000 women in 2024, an increase of less than 1% from 2023. Birth rates declined for females in 5-year age groups 15–24, rose for women in age groups 25–44, and were unchanged for females ages 10–14 and for women ages 45–49 in 2024. The birth rate for teenagers ages 15–19 declined by 3% in 2024 to 12.7 births per 1,000 females; the rates for younger (15–17) and older (18–19) teenagers declined 4% and 3%, respectively.Here is a long-term graph of annual U.S. births through 2023.
emphasis added
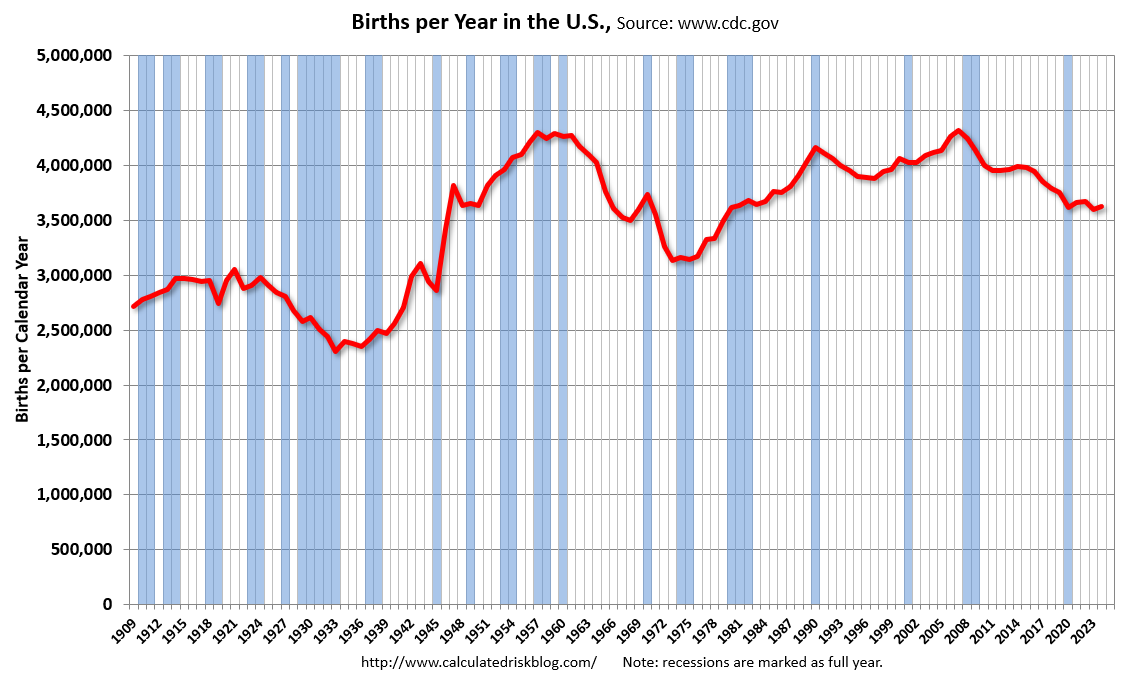 Click on graph for larger image.
Births peaked in 2007 and have generally declined since then.
Note the amazing decline in teenage births.
There is much more in the report.
Fed's Beige Book: "Economic outlook worsened considerably"
by Calculated Risk on 4/23/2025 02:03:00 PM
Economic activity was little changed since the previous report, but uncertainty around international trade policy was pervasive across reports. Just five Districts saw slight growth, three Districts noted activity was relatively unchanged, and the remaining four Districts reported slight to modest declines. Non-auto consumer spending was lower overall; however, most Districts saw moderate to robust sales of vehicles and of some nondurables, generally attributed to a rush to purchase ahead of tariff-related price increases. Both leisure and business travel were down, on balance, and several Districts noted a decline in international visitors. Home sales rose somewhat, and many Districts continued to note low inventory levels. Commercial real estate (CRE) activity expanded slightly as multifamily propped up the industrial and office sectors. Loan demand was flat to modestly higher, on net. Several Districts saw a deterioration in demand for non-financial services. Transportation activity expanded modestly, on balance. Manufacturing was mixed, but two-thirds of Districts said activity was little changed or had declined. The energy sector experienced modest growth. Agricultural conditions were fairly stable across multiple Districts. Cuts to federal grants and subsidies along with declines in philanthropic donations caused gaps in services provided by many community organizations. The outlook in several Districts worsened considerably as economic uncertainty, particularly surrounding tariffs, rose.
Labor Markets
Employment was little changed to up slightly in most Districts, with one District reporting a modest increase, four reporting a slight increase, four reporting no change, and three reporting a slight decline. This is a slight deterioration from the previous report with a few more Districts reporting declines. Hiring was generally slower for consumer-facing firms than for business-to-business firms. The most notable declines in headcount were in government roles or roles at organizations receiving government funding. Several Districts reported that firms were taking a wait-and-see approach to employment, pausing or slowing hiring until there is more clarity on economic conditions. In addition, there were scattered reports of firms preparing for layoffs. Most Districts and markets reported an improvement in overall labor availability, although there were some reports of constraints on labor supply resulting from shifting immigration policies in certain sectors and regions. Wages generally grew at a modest pace, as wage growth slowed from the previous report in multiple Districts.
Prices
Prices increased across Districts, with six characterizing price growth as modest and six characterizing it as moderate, similar to the previous report. Most Districts noted that firms expected elevated input cost growth resulting from tariffs. Many firms have already received notices from suppliers that costs would be increasing. Firms reported adding tariff surcharges or shortening pricing horizons to account for uncertain trade policy. Most businesses expected to pass through additional costs to customers. However, there were reports about margin compression amid increased costs, as demand remained tepid in some sectors, especially for consumer-facing firms.
emphasis added
Newsletter: New Home Sales Increase to 724,000 Annual Rate in March
by Calculated Risk on 4/23/2025 10:35:00 AM
Today, in the Calculated Risk Real Estate Newsletter: New Home Sales Increase to 724,000 Annual Rate in March
Brief excerpt:
The Census Bureau reported New Home Sales in March were at a seasonally adjusted annual rate (SAAR) of 724 thousand. The previous three months were revised down, combined.There is much more in the article.
...
The next graph shows new home sales for 2024 and 2025 by month (Seasonally Adjusted Annual Rate). Sales in March 2025 were up 6.0% from March 2024.
New home sales, seasonally adjusted, have increased year-over-year in 21 of the last 24 months. This is essentially the opposite of what happened with existing home sales that had been down year-over-year every month for 3+ years (existing home sales have been up year-over-year for the last 4 or the last 5 months).

New Home Sales Increase to 724,000 Annual Rate in March
by Calculated Risk on 4/23/2025 10:00:00 AM
The Census Bureau reports New Home Sales in March were at a seasonally adjusted annual rate (SAAR) of 724 thousand.
The previous three months were revised down, combined.
Sales of new single-family houses in March 2025 were at a seasonally-adjusted annual rate of 724,000, according to estimates released jointly today by the U.S. Census Bureau and the Department of Housing and Urban Development. This is 7.4 percent above the February 2025 rate of 674,000, and is 6.0 percent above the March 2024 rate of 683,000.
emphasis added
 Click on graph for larger image.
The first graph shows New Home Sales vs. recessions since 1963. The dashed line is the current sales rate.
New home sales were above pre-pandemic levels.
The second graph shows New Home Months of Supply.
 The months of supply decreased in March to 8.3 months from 8.9 months in February.
 The all-time record high was 12.2 months of supply in January 2009. The all-time record low was 3.3 months in August 2020.
This is well above the top of the normal range (about 4 to 6 months of supply is normal).
"The seasonally-adjusted estimate of new houses for sale at the end of March 2025 was 503,000. This is 0.6 percent above the February 2025 estimate of 500,000, and is 7.9 percent above the March 2024 estimate of 466,000.Sales were above expectations of 680 thousand SAAR, however sales for the three previous months were revised down, combined. I'll have more later today.
This represents a supply of 8.3 months at the current sales rate. The months' supply is 6.7 percent below the February 2025 estimate of 8.9 months, and is 1.2 percent above the March 2024 estimate of 8.2 months."
MBA: Mortgage Applications Decrease in Latest MBA Weekly Survey
by Calculated Risk on 4/23/2025 07:00:00 AM
From the MBA: Mortgage Applications Decrease in Latest MBA Weekly Survey
Mortgage applications decreased 12.7 percent from one week earlier, according to data from the Mortgage Bankers Association’s (MBA) Weekly Mortgage Applications Survey for the week ending April 18, 2025.
The Market Composite Index, a measure of mortgage loan application volume, decreased 12.7 percent on a seasonally adjusted basis from one week earlier. On an unadjusted basis, the Index decreased 11 percent compared with the previous week. The Refinance Index decreased 20 percent from the previous week and was 43 percent higher than the same week one year ago. The seasonally adjusted Purchase Index decreased 7 percent from one week earlier. The unadjusted Purchase Index decreased 6 percent compared with the previous week and was 6 percent higher than the same week one year ago.
“Overall mortgage application activity declined last week, as rates increased to their highest level in two months. The 30-year fixed rate rose for the second straight week to 6.9 percent, an almost 30-basis-point increase over two weeks,” said Joel Kan, MBA’s Vice President and Deputy Chief Economist. “These higher rates drove a 20 percent drop in refinance applications, especially for higher balance loans, with the average loan size falling substantially. The refinance share of applications at 37.3 percent was the lowest since January. Similar to the previous week, economic uncertainty and rate volatility impacted prospective homebuyers as we saw a 7 percent decline in purchase applications. Both conventional and government purchase activity fell relative to the week before, but the overall level of purchase applications was still 6 percent higher than a year ago.”
...
The average contract interest rate for 30-year fixed-rate mortgages with conforming loan balances ($806,500 or less) increased to 6.90 percent from 6.81 percent, with points increasing to 0.66 from 0.62 (including the origination fee) for 80 percent loan-to-value ratio (LTV) loans.
emphasis added
 Click on graph for larger image.
The first graph shows the MBA mortgage purchase index.
According to the MBA, purchase activity is up 6% year-over-year unadjusted.
Red is a four-week average (blue is weekly).
Purchase application activity is up about 22% from the lows in late October 2023 and is 2% above the lowest levels during the housing bust.

The second graph shows the refinance index since 1990.
The refinance index decreased.


