 RSS Feed
 by Calculated Risk on 3/03/2025 06:18:00 PM
Monday, March 03, 2025
Vehicles Sales Increase to 16.00 million SAAR in February
Wards Auto released their estimate of light vehicle sales for January: Despite Affordability Headwind, U.S. Light-Vehicle Sales Rise 3.4% in February (pay site).
Continuing January’s trend, market strength was at the two far ends of the affordability scale, as entry-price cars and lower-cost CUVs posted big gains, while the same was true in most premium-price segments. The range of vehicles generally thought of as the bread-and-butter of the market, non-luxury compact and midsize cars, CUVs and SUVs, all recorded big declines. However, even when including lower-price vehicles, sales of non-luxury sedans and compact/midsize CUVs and SUVs were down 3.8% in January-February, which really is indicating a continued affordability issue – at least compared with pre-2020 (pandemic) history.
 Click on graph for larger image.
This graph shows light vehicle sales since 2006 from the BEA (blue) and Wards' estimate for February (red).
Sales in February (16.00 million SAAR) were up 2.5% from January, and up 2.1% from February 2024.
Sales in February were slightly above the consensus forecast.
Sales in February were slightly above the consensus forecast.
The second graph shows light vehicle sales since the BEA started keeping data in 1967.

This was the best February since 2020.

A Comment on GDPNow
by Calculated Risk on 3/03/2025 01:59:00 PM
On Friday, I noted: Q1 GDP Tracking: Wide Range, GDPNow Goes Negative
GDPNow from the Atlanta Fed went strongly negative in the most recent reading: "The GDPNow model estimate for real GDP growth (seasonally adjusted annual rate) in the first quarter of 2025 is -1.5 percent on February 28".
GDPNow is an excellent tracking model, however, the January surge in imports - especially for gold - caused the model to move negative. As the Atlanta Fed noted: "the contribution of net exports to first-quarter real GDP growth fell from -0.41 percentage points to -3.70 percentage points".
Usually there would be an offsetting increase in inventories, but that is a lagging indicator. This is a short-term distortion and will balance out over the next month or so. I don't expect negative GDP in Q1.
Final Look at Local Housing Markets in January and a Look Ahead to February Sales
by Calculated Risk on 3/03/2025 11:10:00 AM
Today, in the Calculated Risk Real Estate Newsletter: Final Look at Local Housing Markets in January and a Look Ahead to February Sales
A brief excerpt:
After the National Association of Realtors® (NAR) releases the monthly existing home sales report, I pick up additional local market data that is reported after the NAR. This is the final look at local markets in January.There is much more in the article.
The big story for January was that existing home sales increased year-over-year (YoY) for the fourth consecutive month following year-over-year declines every month since July 2021. However, sales in January, at 4.08 million on a seasonally adjusted annual rate basis (SAAR) were down from December and still historically low. Sales averaged almost 5.5 million SAAR in the January 2017-2020 period. So, sales were still about 25% below pre-pandemic levels.
...
Here is a look at months-of-supply using NSA sales. Since this is NSA data, it is likely this is close to the seasonal low for months-of-supply.
Miami is off the charts!
...
More local data coming in March for activity in February!

Construction Spending Decreased 0.2% in January
by Calculated Risk on 3/03/2025 10:17:00 AM
From the Census Bureau reported that overall construction spending decreased:
Construction spending during January 2025 was estimated at a seasonally adjusted annual rate of $2,192.5 billion, 0.2 percent below the revised December estimate of $2,196.0 billion. The January figure is 3.3 percent above the January 2024 estimate of $2,122.2 billion.Private spending decreased and public spending increased:
emphasis added
Spending on private construction was at a seasonally adjusted annual rate of $1,686.0 billion, 0.2 percent below the revised December estimate of $1,690.1 billion. ...
In January, the estimated seasonally adjusted annual rate of public construction spending was $506.6 billion, 0.1 percent above the revised December estimate of $505.9 billion.
 Click on graph for larger image.
This graph shows private residential and nonresidential construction spending, and public spending, since 1993. Note: nominal dollars, not inflation adjusted.
Private residential (red) spending is 4.9% below the peak in 2022.
Private non-residential (blue) spending is at a new peak.
Public construction spending is 0.1% below the peak in November 2024.
 The second graph shows the year-over-year change in construction spending.
On a year-over-year basis, private residential construction spending is up 3.1%. Private non-residential spending is up 1.8% year-over-year. Public spending is up 5.9% year-over-year.
This was below consensus expectations; however, spending for the previous two months was revised up.
ISM® Manufacturing index Decreased to 50.3% in February
by Calculated Risk on 3/03/2025 10:00:00 AM
(Posted with permission). The ISM manufacturing index indicated expansion. The PMI® was at 50.3% in February, down from 50.9% in January. The employment index was at 47.6%, down from 50.3% the previous month, and the new orders index was at 48.6%, down from 52.1%.
From ISM: Manufacturing PMI® at 50.3%
February 2025 Manufacturing ISM® Report On Business®
Economic activity in the manufacturing sector expanded for the second month in a row in February after 26 consecutive months of contraction, say the nation's supply executives in the latest Manufacturing ISM® Report On Business®.This suggests manufacturing expanded in February. This was below the consensus forecast.
The report was issued today by Timothy R. Fiore, CPSM, C.P.M., Chair of the Institute for Supply Management® (ISM®) Manufacturing Business Survey Committee:
“The Manufacturing PMI® registered 50.3 percent in February, 0.6 percentage point lower compared to the 50.9 percent recorded in January. The overall economy continued in expansion for the 58th month after one month of contraction in April 2020. (A Manufacturing PMI® above 42.3 percent, over a period of time, generally indicates an expansion of the overall economy.) The New Orders Index dropped back into contraction territory after expanding for three months, registering 48.6 percent, 6.5 percentage points lower than the 55.1 percent recorded in January. The February reading of the Production Index (50.7 percent) is 1.8 percentage points lower than January’s figure of 52.5 percent. The index expanded for the second month in a row after eight months in contraction. The Prices Index surged further into expansion (or ‘increasing’) territory, registering 62.4 percent, up 7.5 percentage points compared to the reading of 54.9 percent in January. The Backlog of Orders Index registered 46.8 percent, up 1.9 percentage points compared to the 44.9 percent recorded in January. The Employment Index registered 47.6 percent, down 2.7 percentage points from January’s figure of 50.3 percent.
emphasis added
Housing March 3rd Weekly Update: Inventory down 0.1% Week-over-week, Up 28.3% Year-over-year
by Calculated Risk on 3/03/2025 08:11:00 AM
Altos reports that active single-family inventory was down 0.1% week-over-week.
Inventory is now up 2.4% from the seasonal bottom seven weeks ago in January and should start increasing seasonally in March.
The first graph shows the seasonal pattern for active single-family inventory since 2015.
 Click on graph for larger image.
The red line is for 2025. The black line is for 2019.
Inventory was up 28.3% compared to the same week in 2024 (last week it was up 28.7%), and down 21.8% compared to the same week in 2019 (last week it was down 21.9%).
Back in June 2023, inventory was down almost 54% compared to 2019, so the gap to more normal inventory levels has closed significantly!
 This second inventory graph is courtesy of Altos Research.
As of Feb 28th, inventory was at 639 thousand (7-day average), compared to 640 thousand the prior week.
Mike Simonsen discusses this data regularly on Youtube
Sunday, March 02, 2025
Monday: ISM Mfg, Construction Spending, Vehicle Sales
by Calculated Risk on 3/02/2025 06:22:00 PM
Weekend:
• Schedule for Week of March 2, 2025
Monday:
• At 10:00 AM ET, ISM Manufacturing Index for February. The consensus is for the ISM to be at 50.8, down from 50.9 in January.
• At 10:00 AM, Construction Spending for January. The consensus is for a 0.2% increase in construction spending.
• All day, Light vehicle sales for February. Sales were at 15.6 million in January (Seasonally Adjusted Annual Rate). The consensus is for an increase in sales to 15.9 million SAAR.
From CNBC: Pre-Market Data and Bloomberg futures S&P 500 are up 17 and DOW futures are up 55 (fair value).
Oil prices were down over the last week with WTI futures at $70.10 per barrel and Brent at $73.16 per barrel. A year ago, WTI was at $81, and Brent was at $85 - so WTI oil prices are down about 15% year-over-year.
Here is a graph from Gasbuddy.com for nationwide gasoline prices. Nationally prices are at $3.04 per gallon. A year ago, prices were at $3.33 per gallon, so gasoline prices are down $0.29 year-over-year.
Hotels: Occupancy Rate Decreased 2.7% Year-over-year
by Calculated Risk on 3/02/2025 09:19:00 AM
The U.S. hotel industry reported mixed year-over-year comparisons, according to CoStar’s latest data through 22 February. ...The following graph shows the seasonal pattern for the hotel occupancy rate using the four-week average.
16-22 February 2025 (percentage change from comparable week in 2024):
• Occupancy: 60.3% (-2.7%)
• Average daily rate (ADR): US$159.90 (+2.5%)
• Revenue per available room (RevPAR): US$96.49 (-0.3%)
emphasis added
 Click on graph for larger image.
The red line is for 2025, blue is the median, and dashed light blue is for 2024. Dashed purple is for 2018, the record year for hotel occupancy.
The 4-week average of the occupancy rate is tracking last year and is lower than the median rate for the period 2000 through 2024 (Blue).
Note: Y-axis doesn't start at zero to better show the seasonal change.
The 4-week average will increase seasonally for the next several weeks.
Saturday, March 01, 2025
Real Estate Newsletter Articles this Week: New Home Sales Decrease to 657,000 Annual Rate in January
by Calculated Risk on 3/01/2025 02:22:00 PM
At the Calculated Risk Real Estate Newsletter this week:
 Click on graph for larger image.
• New Home Sales Decrease to 657,000 Annual Rate in January
• Case-Shiller: National House Price Index Up 3.9% year-over-year in December
• Inflation Adjusted House Prices 1.0% Below 2022 Peak
• Freddie Mac House Price Index Increased in January; Up 3.9% Year-over-year
This is usually published 4 to 6 times a week and provides more in-depth analysis of the housing market.
Schedule for Week of March 2, 2025
by Calculated Risk on 3/01/2025 08:11:00 AM
The key report scheduled for this week is the February employment report.
Fed Chair Powell speaks on the economic outlook on Friday.
10:00 AM: ISM Manufacturing Index for February. The consensus is for the ISM to be at 50.8, down from 50.9 in January.
10:00 AM: Construction Spending for January. The consensus is for a 0.2% increase in construction spending.
 All day: Light vehicle sales for February. Sales were at 15.6 million in January (Seasonally Adjusted Annual Rate). The consensus is for an increase in sales to 15.9 million SAAR.
This graph shows light vehicle sales since the BEA started keeping data in 1967. The dashed line is the January sales rate.
No major economic releases scheduled.
7:00 AM ET: The Mortgage Bankers Association (MBA) will release the results for the mortgage purchase applications index.
8:15 AM: The ADP Employment Report for February. This report is for private payrolls only (no government). The consensus is for 140,000 payroll jobs added in February, down from 183,000 added in January.
10:00 AM: the ISM Services Index for February.
2:00 PM: the Federal Reserve Beige Book, an informal review by the Federal Reserve Banks of current economic conditions in their Districts.
8:30 AM: The initial weekly unemployment claims report will be released. The consensus is for 234 initial claims down from 242 thousand last week.
 8:30 AM: U.S. International Trade in Goods and Services for January from the Census Bureau.
 This graph shows the U.S. trade deficit, with and without petroleum, through the most recent report. The blue line is the total deficit, and the black line is the petroleum deficit, and the red line is the trade deficit ex-petroleum products.
TThe consensus is for a record U.S. trade deficit of $128.3 billion from $98.4 billion in December. Many importers were racing to beat potential tariffs.
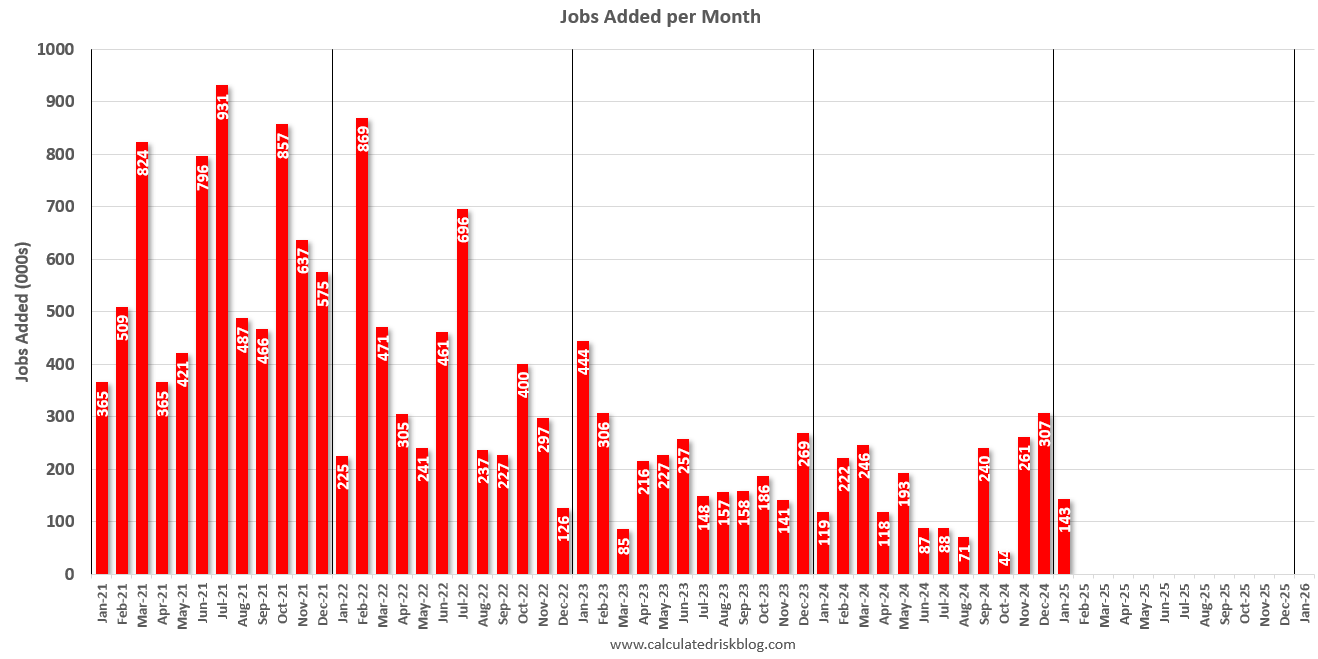 8:30 AM: Employment Report for February. The consensus is for 158,000 jobs added, and for the unemployment rate to be unchanged at 4.0%.
There were 143,000 jobs added in January, and the unemployment rate was at 4.0%.
This graph shows the jobs added per month since January 2021.
12:30 PM: Speech, Fed Chair Jerome Powell, Economic Outlook, At The University of Chicago Booth School of Business 2025 U.S. Monetary Policy Forum, New York, N.Y.


