 RSS Feed
 by Calculated Risk on 6/20/2017 08:20:00 PM
Tuesday, June 20, 2017
Wednesday: Existing Home Sales
From Matthew Graham at Mortgage News Daily: Rates Fall Slightly to Remain Near 8-Month Lows
Mortgage rates were steady to slightly lower today, with underlying bond markets essentially erasing the damage seen yesterday. This was neither here nor there for the mortgage world as most lenders didn't adjust rates much higher yesterday (despite bond weakness). Thus, they didn't have much to do today when bonds strengthened. In general "bond market strength" = lower rates and vice versa.Wednesday:
...
The absence of change continues to be a good thing given that rates remain very close to their lowest levels in more than 8 months. Only a handful of recent days have been any better. 4.0% is the most prevalently-quoted conventional 30yr fixed rate on top tier scenarios, though a few of the aggressive lenders remain at 3.875%.
• At 7:00 AM ET: The Mortgage Bankers Association (MBA) will release the results for the mortgage purchase applications index.
• At 10:00 AM, Existing Home Sales for May from the National Association of Realtors (NAR). The consensus is for 5.55 million SAAR, down from 5.57 million in April. Housing economist Tom Lawler expects the NAR to report sales of 5.65 million SAAR in May.
• During the day: The AIA's Architecture Billings Index for May (a leading indicator for commercial real estate).
Phoenix Real Estate in May: Sales up 9%, Inventory down 9% YoY
by Calculated Risk on 6/20/2017 05:29:00 PM
This is a key housing market to follow since Phoenix saw a large bubble and bust, followed by strong investor buying.
The Arizona Regional Multiple Listing Service (ARMLS) reports (table below):
1) Overall sales in May were up 9.3% year-over-year.
2) Active inventory is now down 9.5% year-over-year.
More inventory (a theme in most of 2014) - and less investor buying - suggested price increases would slow sharply in 2014. And prices increases did slow in 2014, only increasing 2.4% according to Case-Shiller.
In 2015, with falling inventory, prices increased a little faster. Prices were up 6.3% in 2015 according to Case-Shiller.
With flat inventory in 2016, prices were up 4.8%.
This is the seventh consecutive month with a YoY decrease in inventory, and prices are up 1.7% through March (7.1% annual rate).
| May Residential Sales and Inventory, Greater Phoenix Area, ARMLS | ||||||
|---|---|---|---|---|---|---|
| Sales | YoY Change Sales | Cash Sales | Percent Cash | Inventory | YoY Change Inventory | |
| May-08 | 5,6371 | --- | 1,062 | 18.8% | 54,1611 | --- |
| May-09 | 9,284 | 64.7% | 3,592 | 38.7% | 39,902 | -26.3% |
| May-10 | 9,067 | -2.3% | 3,341 | 36.8% | 41,326 | 3.6% |
| May-11 | 9,811 | 8.2% | 4,523 | 46.1% | 31,661 | -23.4% |
| May-12 | 8,445 | 13.5% | 3,907 | 46.3% | 20,162 | -36.3% |
| May-13 | 9,440 | 11.8% | 3,669 | 38.9% | 19,734 | -2.1% |
| May-14 | 7,442 | -21.2% | 2,193 | 29.5% | 29,091 | 47.4% |
| May-15 | 8,293 | 11.4% | 1,988 | 24.0% | 24,616 | -15.4% |
| May-16 | 8,820 | 6.4% | 1,931 | 21.9% | 25,980 | 5.5% |
| May-17 | 9,641 | 9.3% | NA | NA | 23,520 | -9.5% |
| 1 May 2008 does not include manufactured homes, ~100 more | ||||||
Chemical Activity Barometer "flat" in June
by Calculated Risk on 6/20/2017 11:52:00 AM
Note: This appears to be a leading indicator for industrial production.
From the American Chemistry Council: Chemical Activity Barometer Remains Steady
The Chemical Activity Barometer (CAB), a leading economic indicator created by the American Chemistry Council (ACC), was flat in June following a 0.2 percent gain in May, and a 0.3 percent gain in April. This marks a slowing from the average 0.5 percent first quarter monthly gain. Compared to a year earlier, the CAB is up 4.3 percent year-over-year, a modest yet continued slowing. All data is measured on a three-month moving average (3MMA).
...
Applying the CAB back to 1912, it has been shown to provide a lead of two to fourteen months, with an average lead of eight months at cycle peaks as determined by the National Bureau of Economic Research. The median lead was also eight months. At business cycle troughs, the CAB leads by one to seven months, with an average lead of four months. The median lead was three months. The CAB is rebased to the average lead (in months) of an average 100 in the base year (the year 2012 was used) of a reference time series. The latter is the Federal Reserve’s Industrial Production Index.
emphasis added
 Click on graph for larger image.
This graph shows the year-over-year change in the 3-month moving average for the Chemical Activity Barometer compared to Industrial Production. It does appear that CAB (red) generally leads Industrial Production (blue).
CAB increased solidly in early 2017 suggesting an increase in Industrial Production, however, the year-over-year increase in the CAB has slowed recently.
Oil Prices Lower, Down Year-over-year
by Calculated Risk on 6/20/2017 09:57:00 AM
From CNBC: Oil prices are tumbling more than 2% to $43 a barrel right now
U.S. West Texas Intermediate crude oil futures were last down $1.19, or 2.7 percent, at $43.01.
 Click on graph for larger image
The first graph shows WTI and Brent spot oil prices from the EIA. (Prices today added).
According to Bloomberg, WTI is at $42.87 per barrel today, and Brent is at $45.69.
Prices really collapsed at the end of 2014 - and then rebounded a little - and then collapsed again at the end of 2015 and in early 2016.
Prices then rebounded to over $50 per barrel, but have been falling recently.
 The second graph shows the year-over-year change in WTI based on data from the EIA.
Six times since 1987, oil prices have increased 100% or more YoY. And several times prices have almost fallen in half YoY.
Currently WTI is down about 12% year-over-year.
Monday, June 19, 2017
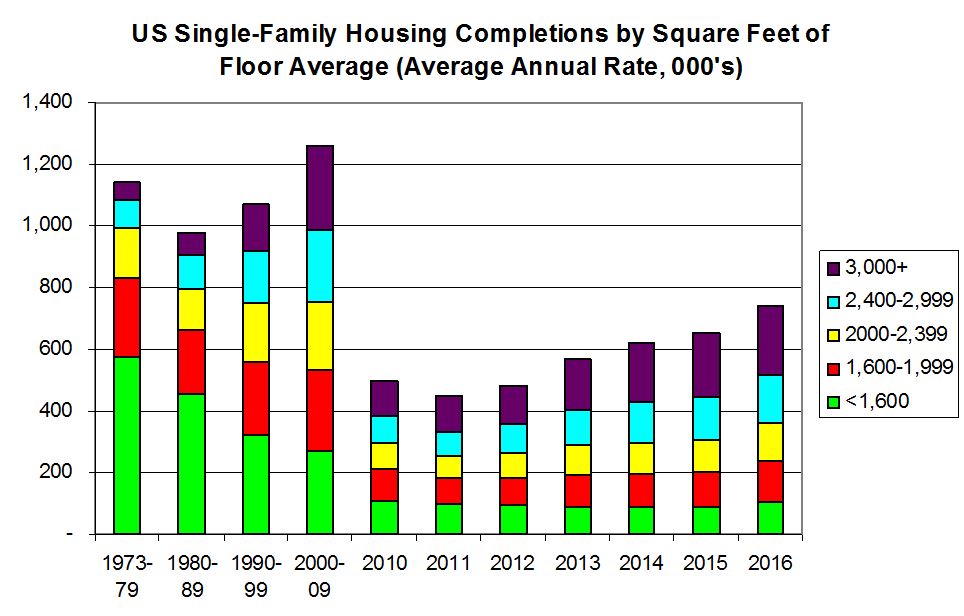
Lawler: Single-Family Housing Production ‘Shortfall” All In Modestly Sized, Modestly Price Segment
by Calculated Risk on 6/19/2017 07:59:00 PM
A short note from housing economist Tom Lawler: Single-Family Housing Production ‘Shortfall” All In Modestly Sized, Modestly Price Segment
The number of US single-family homes completed last year that had at least 3,000 square feet of floor area (222,000). was higher than any year in the 20th Century save for the year 2000, when 224,000 of such really large homes were completed.
LEHC Estimates Based on Latest and Historical Census “Annual Characteristics of Housing”
Lawler: Early Read on Existing Home Sales in May
by Calculated Risk on 6/19/2017 01:58:00 PM
From housing economist Tom Lawler:
Based on publicly-available local realtor/MLS reports from across the country released through today, I project that US existing home sales as estimated by the National Association of Realtors ran at a seasonally adjusted annual rate of 5.65 million in May, up 1.4% from April’s preliminary pace and up 3.3% from last May’s seasonally adjusted pace. Unadjusted sales last month should show a larger YOY gain than seasonally adjusted sales. Local realtor/MLS data also suggest that existing home sales this May show a larger monthly increase than last May, and I project that the NAR’s estimate of the inventory of existing homes for sale in May will be 1.98 million, up 2.6% from April’s estimate and down 7.5% from last May. Finally, local realtor/MLS data suggest that the NAR’s estimate of the median existing single-family home sales price in May will be up by about 6.5% from last May.
CR Note: The NAR is scheduled to release existing home sales for May on Wednesday, June 21st. The consensus forecast is for sales of 5.55 million SAAR (take the over).
Hotels: Hotel Occupancy down Year-over-Year
by Calculated Risk on 6/19/2017 11:27:00 AM
From HotelNewsNow.com: STR: US hotel results for week ending 10 June
The U.S. hotel industry reported mixed year-over-year results in the three key performance metrics during the week of 4-10 June 2017, according to data from STR.The following graph shows the seasonal pattern for the hotel occupancy rate using the four week average.
In comparison with the week of 5-11 June 2016, the industry recorded the following:
• Occupancy: -0.8% to 73.0%
• Average daily rate (ADR): +1.5% to US$128.37
• Revenue per available room (RevPAR): +0.7% to US$93.73
emphasis added
 The red line is for 2017, dashed is 2015 (best year on record), blue is the median, and black is for 2009 (the worst year since the Great Depression for hotels).
Currently the occupancy rate is tracking close to last year, and just behind the record year in 2015.
For hotels, occupancy will increase further during the summer travel season.
Data Source: STR, Courtesy of HotelNewsNow.com
Q2 GDP Forecasts being Revised Down
by Calculated Risk on 6/19/2017 09:34:00 AM
From Merrill Lynch:
Housing starts were a big disappointment in May, plunging 5.5% to 1,092k saar from 1,156k in April. ... Feeding the data into our tracking model sliced 0.1pp from our 2Q estimate, leaving us at 2.2% qoq saar.From the Altanta Fed: GDPNow
The GDPNow model forecast for real GDP growth (seasonally adjusted annual rate) in the second quarter of 2017 is 2.9 percent on June 16, down from 3.2 percent on June 14. The forecast for second-quarter real residential investment growth decreased from 1.8 percent to 0.4 percent after this morning's housing starts release from the U.S. Census Bureau.From the NY Fed Nowcasting Report
emphasis added
The New York Fed Staff Nowcast stands at 1.9% for 2017:Q2 and 1.5% for 2017:Q3.
Sunday, June 18, 2017
Sunday Night Futures
by Calculated Risk on 6/18/2017 09:16:00 PM
Weekend:
• Schedule for Week of June 18, 2017
From CNBC: Pre-Market Data and Bloomberg futures: S&P futures are up 6 and DOW futures are up 40 (fair value).
Oil prices were down over the last week with WTI futures at $44.84 per barrel and Brent at $47.13 per barrel. A year ago, WTI was at $49, and Brent was at $50 - so oil prices are DOWN year-over-year.
Here is a graph from Gasbuddy.com for nationwide gasoline prices. Nationally prices are at $2.28 per gallon - a year ago prices were at $2.35 per gallon - so gasoline prices are down year-over-year.
Saturday, June 17, 2017
Schedule for Week of June 18, 2017
by Calculated Risk on 6/17/2017 08:09:00 AM
The key economic reports this week are New and Existing Home sales for May.
No major economic releases scheduled.
No major economic releases scheduled.
7:00 AM ET: The Mortgage Bankers Association (MBA) will release the results for the mortgage purchase applications index.
 10:00 AM: Existing Home Sales for May from the National Association of Realtors (NAR). The consensus is for 5.55 million SAAR, down from 5.57 million in April.
The graph shows existing home sales from 1994 through the report last month.
During the day: The AIA's Architecture Billings Index for May (a leading indicator for commercial real estate).
8:30 AM ET: The initial weekly unemployment claims report will be released. The consensus is for 240 thousand initial claims, up from 237 thousand the previous week.
9:00 AM: FHFA House Price Index for April 2017. This was originally a GSE only repeat sales, however there is also an expanded index.
11:00 AM: the Kansas City Fed manufacturing survey for June.
 10:00 AM ET: New Home Sales for May from the Census Bureau.
 This graph shows New Home Sales since 1963. The dashed line is the March sales rate.
The consensus is for an increase in sales to 590 thousand Seasonally Adjusted Annual Rate (SAAR) in May from 569 thousand in April.


