 RSS Feed
 by Calculated Risk on 7/20/2025 06:21:00 PM
Sunday, July 20, 2025
Sunday Night Futures
Weekend:
• Schedule for Week of July 20, 2025
Monday:
• No major economic releases scheduled.
From CNBC: Pre-Market Data and Bloomberg futures S&P 500 are down 2 and DOW futures are down 33 (fair value).
Oil prices were down over the last week with WTI futures at $67.34 per barrel and Brent at $69.28 per barrel. A year ago, WTI was at $81, and Brent was at $85 - so WTI oil prices are down about 17% year-over-year.
Here is a graph from Gasbuddy.com for nationwide gasoline prices. Nationally prices are at $3.09 per gallon. A year ago, prices were at $3.47 per gallon, so gasoline prices are down $0.38 year-over-year.
Realtor.com Reports Most Active "For Sale" Inventory since November 2019
by Calculated Risk on 7/20/2025 08:21:00 AM
What this means: On a weekly basis, Realtor.com reports the year-over-year change in active inventory and new listings. On a monthly basis, they report total inventory. For June, Realtor.com reported inventory was up 28.9% YoY, but still down 12.9% compared to the 2017 to 2019 same month levels.
Here is their weekly report: Weekly Housing Trends: Latest Data as of July 12
• Active inventory climbed 25.1% year over year
The number of homes active on the market climbed 25.1% year over year, slowing slightly from the previous week. This represents the 88th consecutive week of annual gains in inventory. There were more than 1 million homes for sale again last week, marking the 10th week in a row over the threshold and the highest inventory level since November 2019.
• New listings—a measure of sellers putting homes up for sale—rose 1.3% year over year
New listings rose again last week on an annual basis by just 1.3% compared with the same period last year.
• The median list price was up 0.2% year over year
The median list price climbed again this week, but is still down 0.3% year to date. The median list price per square foot—which adjusts for changes in home size—rose 0.5% year over year. With inventory on the rise and more than 1 in 5 sellers cutting prices, the market continues to soften and shift toward more buyer favorability.
Saturday, July 19, 2025
Real Estate Newsletter Articles this Week: Housing Starts Down 0.5% YoY in June
by Calculated Risk on 7/19/2025 02:11:00 PM
At the Calculated Risk Real Estate Newsletter this week:
 Click on graph for larger image.
• Housing Starts Increased to 1.321 million Annual Rate in June
• Lawler: Early Read on Existing Home Sales in June
• 3rd Look at Local Housing Markets in June
• Will House Prices Decline Nationally in 2025?
This is usually published 4 to 6 times a week and provides more in-depth analysis of the housing market.
Schedule for Week of July 20, 2025
by Calculated Risk on 7/19/2025 08:11:00 AM
The key reports this week are June New and Existing Home Sales.
For manufacturing, the July Richmond and Kansas City Fed manufacturing surveys will be released.
No major economic releases scheduled.
8:30 AM: Speech Fed Chair Jerome Powell, Opening Remarks, At the Integrated Review of the Capital Framework for Large Banks Conference, Washington, D.C.
10:00 AM: Richmond Fed Survey of Manufacturing Activity for July.
7:00 AM ET: The Mortgage Bankers Association (MBA) will release the results for the mortgage purchase applications index.
 10:00 AM: Existing Home Sales for June from the National Association of Realtors (NAR). The consensus is for 4.00 million SAAR, down from 4.03 million last month.
The graph shows existing home sales from 1994 through the report last month.
Housing economist Tom Lawler expects the NAR to report sales of 3.92 million SAAR for June.
During the day: The AIA's Architecture Billings Index for June (a leading indicator for commercial and multi-family real estate).
----- Thursday, July 24th -----
8:30 AM: The initial weekly unemployment claims report will be released. The consensus is for initial claims to increase to 230 thousand from 221 thousand last week.
8:30 AM ET: Chicago Fed National Activity Index for June. This is a composite index of other data.
 10:00 AM: New Home Sales for June from the Census Bureau.
This graph shows New Home Sales since 1963. The dashed line is the sales rate for last month.
The consensus is for 650 thousand SAAR, up from 623 thousand in May.
11:00 AM: Kansas City Fed Survey of Manufacturing Activity for July.
----- Friday, July 25th -----
8:30 AM: Durable Goods Orders for June from the Census Bureau. The consensus is for a 10.0% decrease in durable goods orders.
During the day: The AIA's Architecture Billings Index for June (a leading indicator for commercial and multi-family real estate).
8:30 AM: The initial weekly unemployment claims report will be released. The consensus is for initial claims to increase to 230 thousand from 221 thousand last week.
8:30 AM ET: Chicago Fed National Activity Index for June. This is a composite index of other data.
 10:00 AM: New Home Sales for June from the Census Bureau.
 This graph shows New Home Sales since 1963. The dashed line is the sales rate for last month.
The consensus is for 650 thousand SAAR, up from 623 thousand in May.
11:00 AM: Kansas City Fed Survey of Manufacturing Activity for July.
8:30 AM: Durable Goods Orders for June from the Census Bureau. The consensus is for a 10.0% decrease in durable goods orders.
Friday, July 18, 2025
Q2 GDP Tracking: Mid-2s
by Calculated Risk on 7/18/2025 02:44:00 PM
From BofA:
Since our last weekly publication, our 2Q GDP tracking is down one-tenth to 2.2% q/q saar. [July 18th estimate]From Goldman:
emphasis added
June single-family housing starts were weaker than our previous GDP tracking assumptions. We lowered our Q2 GDP tracking estimate by 0.1pp to +2.8% (quarter-over-quarter annualized). Our Q2 domestic final sales estimate stands at +0.9%. [July 18th estimate]And from the Atlanta Fed: GDPNow

The GDPNow model estimate for real GDP growth (seasonally adjusted annual rate) in the second quarter of 2025 is 2.4 percent on July 18, unchanged from July 17 after rounding. After this morning’s housing starts release from the US Census Bureau, the nowcast of second-quarter real residential investment growth decreased from -6.4 percent to -7.0 percent. [July 18th estimate]
Lawler: Early Read on Existing Home Sales in June
by Calculated Risk on 7/18/2025 12:10:00 PM
From housing economist Tom Lawler:
Based on publicly-available local realtor/MLS reports released across the country through today, I project that existing home sales as estimated by the National Association of Realtors ran at a seasonally adjusted annual rate of 3.92 million in June, down 2.7% from May’s preliminary pace and down 0.3% from last June’s seasonally adjusted pace. Unadjusted sales should show a modest YOY increase, with the SA/NSA difference reflecting the higher business day count this June compared to last June.
Local realtor/MLS reports suggest that the median existing single-family home sales price last month was up by about 1.9% from a year earlier.
CR Note: The NAR is scheduled to release June Existing Home sales on Wednesday, July 23rd at 10:00 AM. The consensus is for 4.00 million SAAR, down from 4.03 million last month. Last year, the NAR reported sales in June 2024 at 3.93 million SAAR.
Newsletter: Housing Starts Increased to 1.321 million Annual Rate in June
by Calculated Risk on 7/18/2025 09:11:00 AM
Today, in the Calculated Risk Real Estate Newsletter: Housing Starts Increased to 1.321 million Annual Rate in June
A brief excerpt:
Total housing starts in June were above expectations (due to volatile multi-family sector) and starts in April and May were revised up.There is much more in the article.
The third graph shows the month-to-month comparison for total starts between 2024 (blue) and 2025 (red).
Total starts were down 0.5% in June compared to June 2024. Year-to-date (YTD) starts are down 1.0% compared to the same period in 2024. Single family starts are down 6.9% YTD and multi-family up 15.7% YTD.
Housing Starts Increased to 1.321 million Annual Rate in June
by Calculated Risk on 7/18/2025 08:30:00 AM
From the Census Bureau: Permits, Starts and Completions
Housing Starts:
Privately-owned housing starts in June were at a seasonally adjusted annual rate of 1,321,000. This is 4.6 percent above the revised May estimate of 1,263,000, but is 0.5 percent below the June 2024 rate of 1,327,000. Single-family housing starts in June were at a rate of 883,000; this is 4.6 percent below the revised May figure of 926,000. The June rate for units in buildings with five units or more was 414,000.
Building Permits:
Privately-owned housing units authorized by building permits in June were at a seasonally adjusted annual rate of 1,397,000. This is 0.2 percent above the revised May rate of 1,394,000, but is 4.4 percent below the June 2024 rate of 1,461,000. Single-family authorizations in June were at a rate of 866,000; this is 3.7 percent below the revised May figure of 899,000. Authorizations of units in buildings with five units or more were at a rate of 478,000 in June.
emphasis added
 Click on graph for larger image.
The first graph shows single and multi-family housing starts since 2000.
Multi-family starts (blue, 2+ units) increased sharply month-over-month in June. Multi-family starts were up 26.6% year-over-year.
Single-family starts (red) decreased in June and were down 10.0% year-over-year.
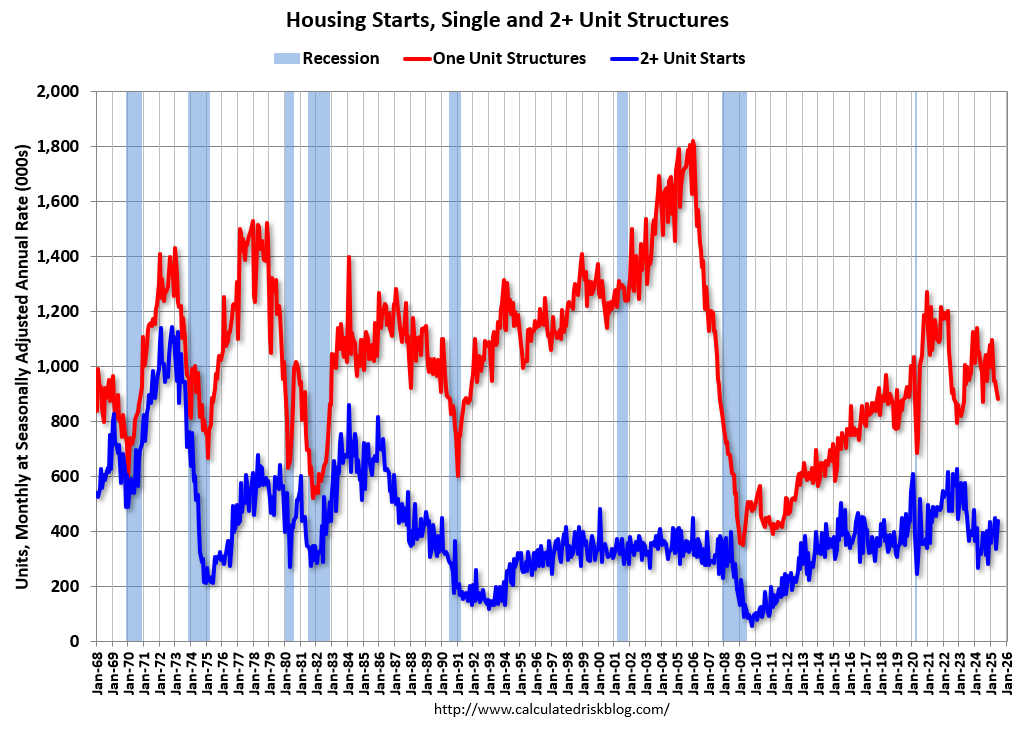 The second graph shows single and multi-family housing starts since 1968.
 Total housing starts in June were above expectations and starts in April and May were revised up.
I'll have more later …
Thursday, July 17, 2025
Friday: Housing Starts
by Calculated Risk on 7/17/2025 07:57:00 PM
 Note: Mortgage rates are from MortgageNewsDaily.com and are for top tier scenarios.
Friday:
• At 8:30 AM ET, Housing Starts for June. The consensus is for 1.300 million SAAR, up from 1.256 million SAAR in May.
• At 10:00 AM, University of Michigan's Consumer sentiment index (Preliminary for July).
• Also at 10:00 AM, State Employment and Unemployment (Monthly) for June 2025
LA Ports: Traffic Down 3% YoY in June
by Calculated Risk on 7/17/2025 03:16:00 PM
Container traffic gives us an idea about the volume of goods being exported and imported - and usually some hints about the trade report since LA area ports handle about 40% of the nation's container port traffic.
The following graphs are for inbound and outbound traffic at the ports of Los Angeles and Long Beach in TEUs (TEUs: 20-foot equivalent units or 20-foot-long cargo container).
The first graph is the monthly data (with a strong seasonal pattern for imports).
 Click on graph for larger image.
Usually imports peak in the July to October period as retailers import goods for the Christmas holiday and then decline sharply and bottom in the Winter depending on the timing of the Chinese New Year.
To remove the strong seasonal component for inbound traffic, the second graph shows the rolling 12-month average.
 On a rolling 12-month basis, inbound traffic decreased 0.3% in June compared to the rolling 12 months ending the previous month. Outbound traffic decreased 0.3% compared to the rolling 12 months ending the previous month.
 Click on graph for larger image.
Usually imports peak in the July to October period as retailers import goods for the Christmas holiday and then decline sharply and bottom in the Winter depending on the timing of the Chinese New Year.
Imports were down 3% YoY in June and exports were also down 3% YoY.
To remove the strong seasonal component for inbound traffic, the second graph shows the rolling 12-month average.
 On a rolling 12-month basis, inbound traffic decreased 0.3% in June compared to the rolling 12 months ending the previous month. Outbound traffic decreased 0.3% compared to the rolling 12 months ending the previous month.
Early this year, importers rushed to beat the tariffs.


