 RSS Feed
 by Calculated Risk on 7/17/2025 08:30:00 AM
Thursday, July 17, 2025
Weekly Initial Unemployment Claims Decrease to 221,000
The DOL reported:
In the week ending July 12, the advance figure for seasonally adjusted initial claims was 221,000, a decrease of 7,000 from the previous week's revised level. The previous week's level was revised up by 1,000 from 227,000 to 228,000. The 4-week moving average was 229,500, a decrease of 6,250 from the previous week's revised average. The previous week's average was revised up by 250 from 235,500 to 235,750.The following graph shows the 4-week moving average of weekly claims since 1971.
emphasis added
 Click on graph for larger image.
The dashed line on the graph is the current 4-week average. The four-week average of weekly unemployment claims decreased to 229,500.
The previous week was revised up.
Weekly claims were lower than the consensus forecast.
Wednesday, July 16, 2025
Thursday: Retail Sales, Unemployment Claims, Philly Fed Mfg, Homebuilder Survey
by Calculated Risk on 7/16/2025 07:02:00 PM
 Note: Mortgage rates are from MortgageNewsDaily.com and are for top tier scenarios.
Thursday:
• At 8:30 AM ET, The initial weekly unemployment claims report will be released. The consensus is for initial claims to increase to 235 thousand from 233 thousand last week.
• Also at 8:30 AM, Retail sales for June is scheduled to be released. The consensus is for a 0.2% increase in retail sales.
• Also at 8:30 AM, the Philly Fed manufacturing survey for July. The consensus is for a reading of -0.5, up from -4.0.
• At 10:00 AM, The July NAHB homebuilder survey. The consensus is for a reading of 33, up from 32. Any number below 50 indicates that more builders view sales conditions as poor than good.
• At 10:00 AM, Speech, Fed Governor Adriana Kugler, A View of the Housing Market and U.S. Economic Outlook, At the Housing Partnership Network Symposium, Washington, D.C.
3rd Look at Local Housing Markets in June
by Calculated Risk on 7/16/2025 02:34:00 PM
Today, in the Calculated Risk Real Estate Newsletter: 3rd Look at Local Housing Markets in June
A brief excerpt:
This is the third look at local markets in June. I’m tracking over 40 local housing markets in the US. Some of the 40 markets are states, and some are metropolitan areas. I’ll update these tables throughout the month as additional data is released.There is much more in the article.
Closed sales in June were mostly for contracts signed in April and May, and mortgage rates, according to the Freddie Mac PMMS, averaged 6.73% in April and 6.82% in May (slightly higher than for closed sales in May).
...
In June, sales in these markets were up 4.7% YoY. Last month, in May, these same markets were down 3.8% year-over-year Not Seasonally Adjusted (NSA).
Important: There were more working days in June 2025 (20) as in June 2024 (19). So, the year-over-year change in the headline SA data will be lower than for the NSA data.
...
More local markets to come!

Fed's Beige Book: "Economic activity increased slightly"
by Calculated Risk on 7/16/2025 02:00:00 PM
Economic activity increased slightly from late May through early July. Five Districts reported slight or modest gains, five had flat activity, and the remaining two Districts noted modest declines in activity. That represented an improvement over the previous report, in which half of Districts reported at least slight declines in activity. Uncertainty remained elevated, contributing to ongoing caution by businesses. Nonauto consumer spending declined in most Districts, softening slightly overall. Auto sales receded modestly on average, after consumers had rushed to buy vehicles earlier this year to avoid tariffs. Tourism activity was mixed, manufacturing activity edged lower, and nonfinancial services activity was little changed on average but varied across Districts. Loan volume increased slightly in most Districts. Construction activity slowed somewhat, constrained by rising costs in some Districts. Home sales were flat or little changed in most Districts, and nonresidential real estate activity was also mostly steady. Activity in the agriculture sector remained weak. Energy sector activity declined slightly, and transportation activity was mixed. The outlook was neutral to slightly pessimistic, as only two Districts expected activity to increase, and others foresaw flat or slightly weaker activity.
Labor Markets
Employment increased very slightly overall, with one District noting modest increases, six reporting slight increases, three no change, and two noting slight declines. Hiring remained generally cautious, which many contacts attributed to ongoing economic and policy uncertainty. Labor availability improved for many employers, with further reductions in turnover rates and increased job applications. A growing number of Districts cited labor shortages in the skilled trades. Several Districts also mentioned reduced availability of foreign-born workers, attributed to changes in immigration policy. Employers in a few Districts ramped up investments in automation and AI aimed at reducing the need for additional hiring. Wages increased modestly overall, extending recent trends, with reports that ranged from flat wages to moderate growth. Although reports of layoffs were limited in all industries, they were somewhat more common among manufacturers. Looking ahead, many contacts expected to postpone major hiring and layoff decisions until uncertainty diminished.
Prices
Prices increased across Districts, with seven characterizing price growth as moderate and five characterizing it as modest, mostly similar to the previous report. In all twelve Districts, businesses reported experiencing modest to pronounced input cost pressures related to tariffs, especially for raw materials used in manufacturing and construction. Rising insurance costs represented another widespread source of pricing pressure. Many firms passed on at least a portion of cost increases to consumers through price hikes or surcharges, although some held off raising prices because of customers' growing price sensitivity, resulting in compressed profit margins. Contacts in a wide range of industries expected cost pressures to remain elevated in the coming months, increasing the likelihood that consumer prices will start to rise more rapidly by late summer.
emphasis added
Industrial Production Increased 0.3% in June
by Calculated Risk on 7/16/2025 09:15:00 AM
From the Fed: Industrial Production and Capacity Utilization
Industrial production (IP) increased 0.3 percent in June after remaining unchanged in April and May; for the second quarter as a whole, IP increased at an annual rate of 1.1 percent. In June, manufacturing output ticked up 0.1 percent, and the index for mining decreased 0.3 percent. The index for utilities rose 2.8 percent. At 104.0 percent of its 2017 average, total IP in June was 0.7 percent above its year-earlier level. Capacity utilization moved up to 77.6 percent, a rate that is 2.0 percentage points below its long-run (1972–2024) average.
emphasis added
 Click on graph for larger image.
This graph shows Capacity Utilization. This series is up from the record low set in April 2020, and close to the level in February 2020 (pre-pandemic).
Capacity utilization at 77.6% is 2.0% below the average from 1972 to 2023. This was above consensus expectations.
Note: y-axis doesn't start at zero to better show the change.
 The second graph shows industrial production since 1967.
Industrial production decreased to 104.0. This is above the pre-pandemic level.
Industrial production was above consensus expectations.
MBA: Mortgage Applications Decrease in Latest MBA Weekly Survey
by Calculated Risk on 7/16/2025 07:00:00 AM
From the MBA: Mortgage Applications Decrease in Latest MBA Weekly Survey
Mortgage applications decreased 10.0 percent from one week earlier, according to data from the Mortgage Bankers Association’s (MBA) Weekly Mortgage Applications Survey for the week ending July 11, 2025. Last week’s results included an adjustment for the Fourth of July holiday.
The Market Composite Index, a measure of mortgage loan application volume, decreased 10.0 percent on a seasonally adjusted basis from one week earlier. On an unadjusted basis, the Index increased 13 percent compared with the previous week. The Refinance Index decreased 7 percent from the previous week and was 25 percent higher than the same week one year ago. The seasonally adjusted Purchase Index decreased 12 percent from one week earlier. The unadjusted Purchase Index increased 11 percent compared with the previous week and was 13 percent higher than the same week one year ago.
“Treasury yields finished higher last week on average despite an intra-week drop, driven partly by renewed concerns of the impact of tariffs on the economy. As a result, mortgage rates rose after two weeks of declines, which contributed to slower application activity,” said Joel Kan, MBA’s Vice President and Deputy Chief Economist. “Jumbo rates were lower than conventional rates for the third straight week, as some depositories may be positioning themselves for growth in balance sheet lending.”
Added Kan, “Purchase applications remained sensitive to both the uncertain economic outlook and the volatility in rates and declined to the slowest pace since May. Refinance applications also dipped because of higher rates, with refinance applications falling, led by VA refinances partially reversing their previous week’s gain, dropping 22 percent.”
...
The average contract interest rate for 30-year fixed-rate mortgages with conforming loan balances ($806,500 or less) increased to 6.82 percent from 6.77 percent, with points remaining unchanged at 0.62 (including the origination fee) for 80 percent loan-to-value ratio (LTV) loans.
emphasis added
 Click on graph for larger image.
The first graph shows the MBA mortgage purchase index.
According to the MBA, purchase activity is up 13% year-over-year unadjusted.
Red is a four-week average (blue is weekly).
Purchase application activity is still depressed, but above the lows of October 2023 and slightly above the lowest levels during the housing bust.

The second graph shows the refinance index since 1990.
The refinance index decreased and remains very low.
Tuesday, July 15, 2025
Wednesday: PPI, Industrial Production, Beige Book
by Calculated Risk on 7/15/2025 07:14:00 PM
 Note: Mortgage rates are from MortgageNewsDaily.com and are for top tier scenarios.
Wednesday:
• At 7:00 AM ET, The Mortgage Bankers Association (MBA) will release the results for the mortgage purchase applications index.
• At 8:30 AM, The Producer Price Index for June from the BLS. The consensus is for a 0.2% increase in PPI, and a 0.2% increase in core PPI.
• At 9:15 AM, The Fed will release Industrial Production and Capacity Utilization for June. The consensus is for a 0.1% increase in Industrial Production, and for Capacity Utilization to be unchanged at 77.4%.
• At 2:00 PM, the Federal Reserve Beige Book, an informal review by the Federal Reserve Banks of current economic conditions in their Districts.
An Early Look at 2026 Cost-Of-Living Adjustments and Maximum Contribution Base
by Calculated Risk on 7/15/2025 04:06:00 PM
The BLS reported earlier today:
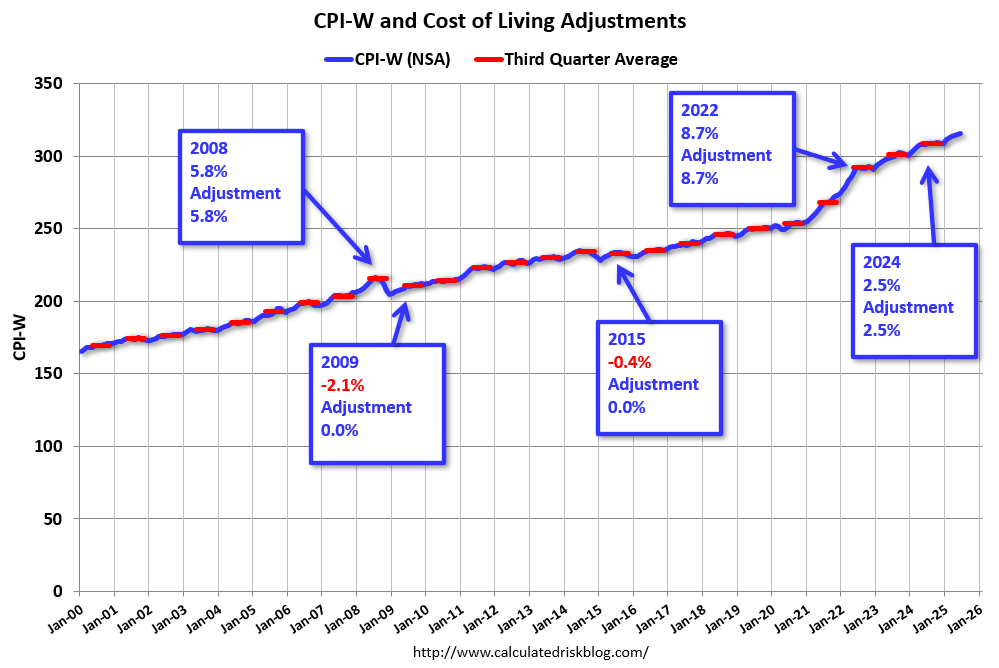
The Consumer Price Index for Urban Wage Earners and Clerical Workers (CPI-W) increased 2.6 percent over the last 12 months to an index level of 315.945 (1982-84=100). For the month, the index increased 0.4 percent prior to seasonal adjustment.CPI-W is the index that is used to calculate the Cost-Of-Living Adjustments (COLA). The calculation dates have changed over time (see Cost-of-Living Adjustments), but the current calculation uses the average CPI-W for the three months in Q3 (July, August, September) and compares to the average for the highest previous average of Q3 months. Note: this is not the headline CPI-U and is not seasonally adjusted (NSA).
• In 2024, the Q3 average of CPI-W was 308.729.
The 2024 Q3 average was the highest Q3 average, so we only have to compare Q3 this year to last year.
 Click on graph for larger image.
This graph shows CPI-W since January 2000. The red lines are the Q3 average of CPI-W for each year.
Note: The year labeled is for the calculation, and the adjustment is effective for December of that year (received by beneficiaries in January of the following year).
CPI-W was up 2.6% year-over-year in June (up from 2.2% YoY in May), and although this is very early - we need the data for July, August and September - my early guess is COLA will probably be in 3% range this year, up from 2.5% in 2025.
Contribution and Benefit Base
The contribution base will be adjusted using the National Average Wage Index. This is based on a one-year lag. The National Average Wage Index is not available for 2024 yet, although we know wages increased solidly in 2024. If wages increased 5% in 2024, then the contribution base next year will increase to around $185,000 in 2026, from the current $176,100.
Remember - this is a very early look. What matters is average CPI-W, NSA, for all three months in Q3 (July, August and September).
Cleveland Fed: Median CPI increased 0.2% and Trimmed-mean CPI increased 0.3% in June
by Calculated Risk on 7/15/2025 11:14:00 AM
The Cleveland Fed released the median CPI and the trimmed-mean CPI.
According to the Federal Reserve Bank of Cleveland, the median Consumer Price Index rose 0.2% in May. The 16% trimmed-mean Consumer Price Index increased 0.3%. "The median CPI and 16% trimmed-mean CPI are measures of core inflation calculated by the Federal Reserve Bank of Cleveland based on data released in the Bureau of Labor Statistics’ (BLS) monthly CPI report".
 Click on graph for larger image.
This graph shows the year-over-year change for these four key measures of inflation.
On a year-over-year basis, the median CPI rose 3.6% (up from 3.5% YoY in May), the trimmed-mean CPI rose 3.2% (up from 3.0%), and the CPI less food and energy rose 2.9% (up from 2.8%).
Core PCE is for May was up 2.7% YoY, up from 2.5% in April.
YoY Measures of Inflation: Services, Goods and Shelter
by Calculated Risk on 7/15/2025 08:49:00 AM
Here are a few measures of inflation:
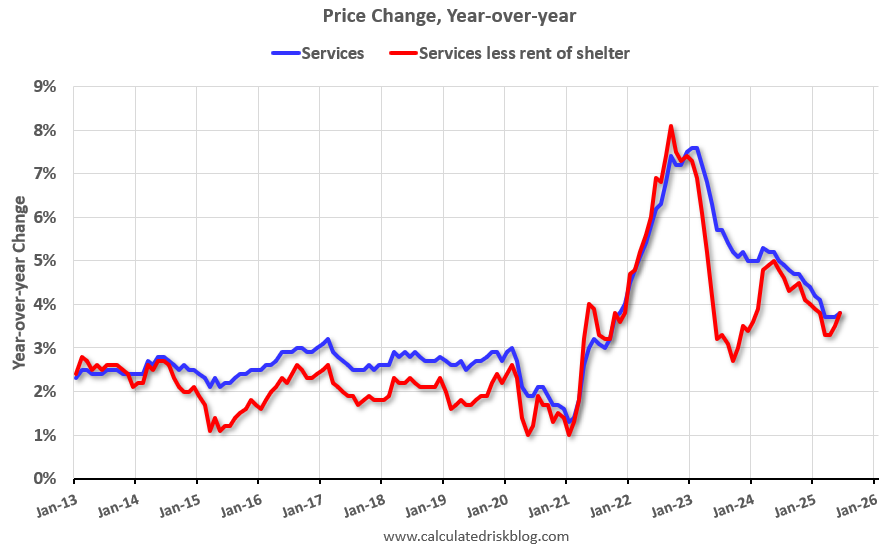
The first graph is the one Fed Chair Powell had mentioned two years ago when services less rent of shelter was up around 8% year-over-year. This declined and is now up 3.8% YoY.
 Click on graph for larger image.
This graph shows the YoY price change for Services and Services less rent of shelter through June 2025.
Services were up 3.8% YoY as of June 2025, up from 3.7% YoY in May.
Services less rent of shelter was up 3.8% YoY in June, up from 3.5% YoY in April.
Services less rent of shelter was up 3.8% YoY in June, up from 3.5% YoY in April.
 The second graph shows that goods prices started to increase year-over-year (YoY) in 2020 and accelerated in 2021 due to both strong demand and supply chain disruptions.
Durables were up 0.6% YoY as of June 2025, up from unchanged YoY in May.
Commodities less food and energy commodities were at 0.6% YoY in June, up from 0.3% YoY in May.
Commodities less food and energy commodities were at 0.6% YoY in June, up from 0.3% YoY in May.
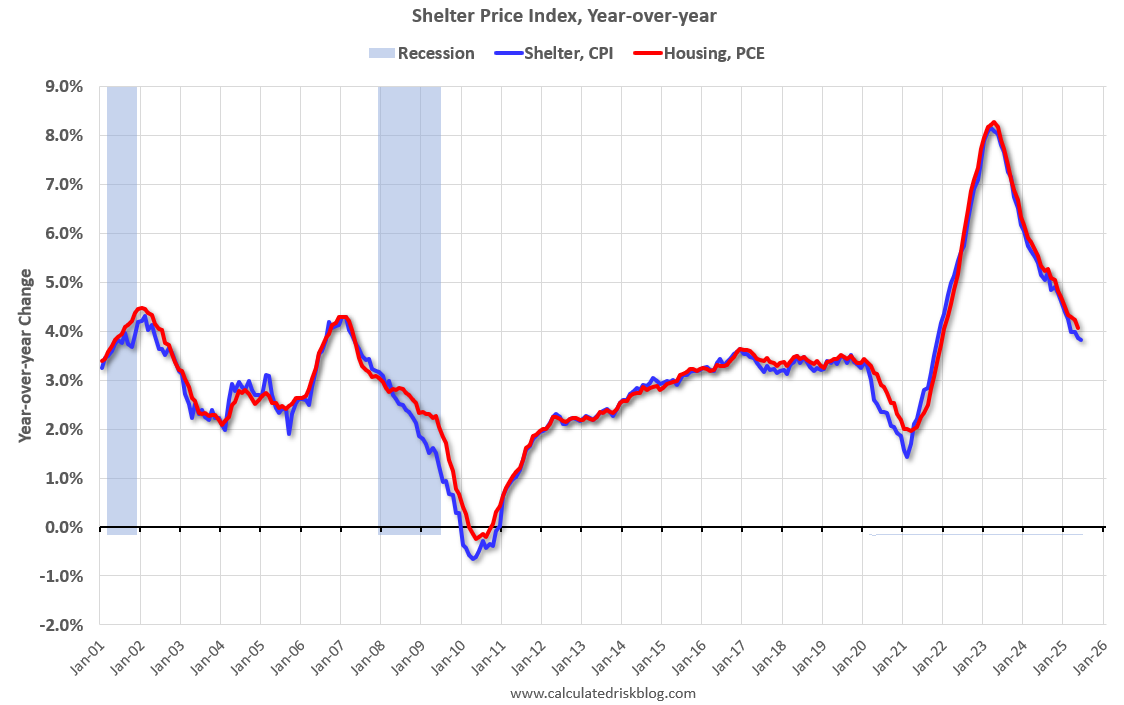 Here is a graph of the year-over-year change in shelter from the CPI report (through June) and housing from the PCE report (through May)
Shelter was up 3.8% year-over-year in June, down from 3.9% in May. Housing (PCE) was up 4.1% YoY in June, down from 4.2% in May.
This is still catching up with private new lease data (this includes renewals whereas private data is mostly for new leases).
Core CPI ex-shelter was up 2.1% YoY in June, up from 1.9% in May.


