 RSS Feed
 by Calculated Risk on 6/24/2025 07:45:00 PM
Tuesday, June 24, 2025
Wednesday: New Home Sales, Fed Chair Powell Testimony
 Note: Mortgage rates are from MortgageNewsDaily.com and are for top tier scenarios.
Wednesday:
• At 7:00 AM ET, The Mortgage Bankers Association (MBA) will release the results for the mortgage purchase applications index.
• At 10:00 AM, New Home Sales for May from the Census Bureau. The consensus is for 710 thousand SAAR, down from 743 thousand in April.
• Also at 10:00 AM, Testimony, Fed Chair Jerome Powell, Semiannual Monetary Policy Report to Congress, Before the U.S. Senate Committee on Banking, Housing, and Urban Affairs
ICE First Look at May Mortgage Performance: "Delinquencies Hold Steady and Foreclosure Sales Rise to Highest Level Since Early 2023"
by Calculated Risk on 6/24/2025 04:06:00 PM
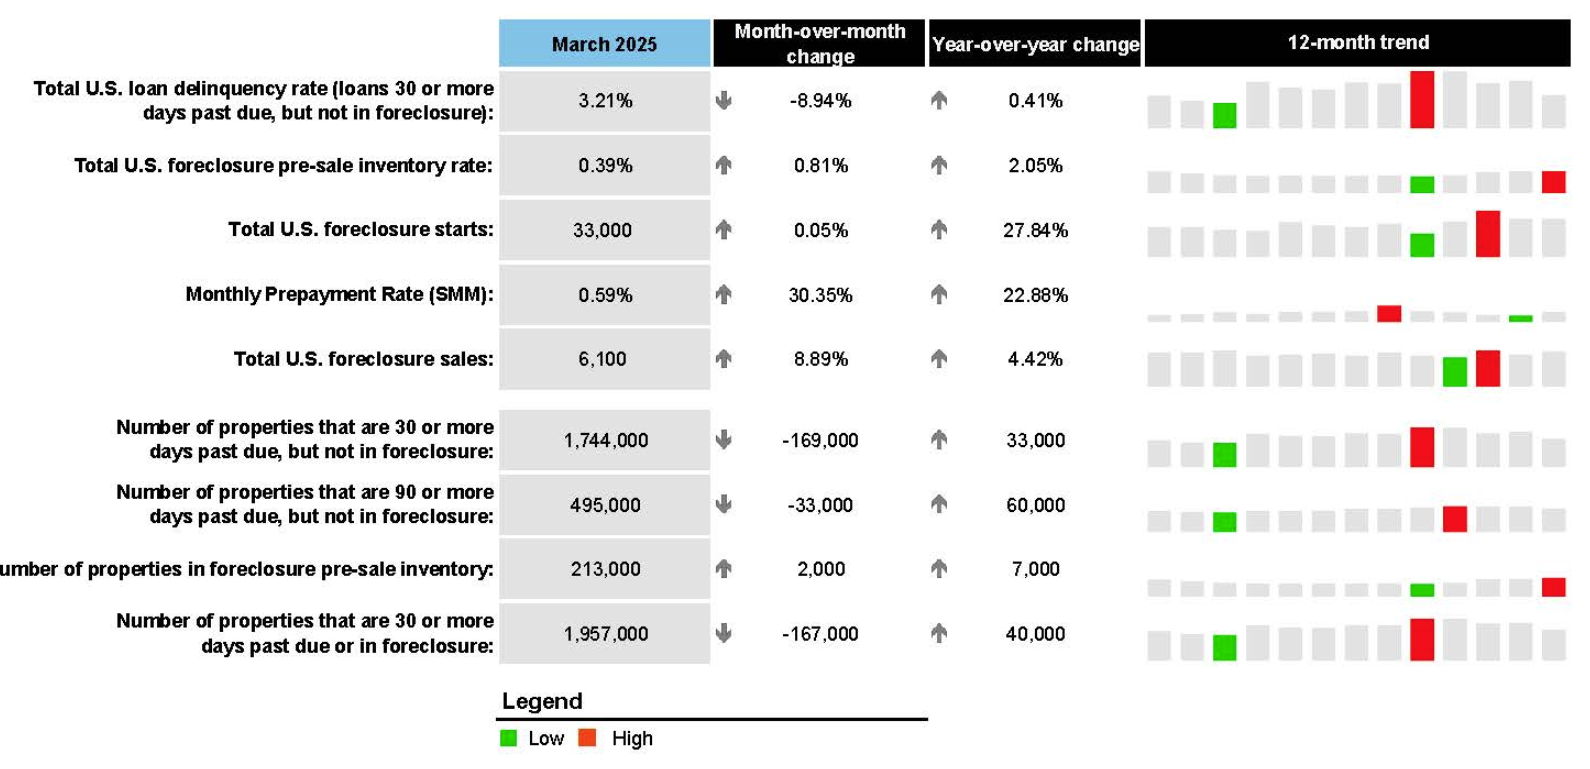
From Intercontinental Exchange: ICE First Look at Mortgage Performance: Delinquencies Hold Steady and Foreclosure Sales Rise to Highest Level Since Early 2023
Intercontinental Exchange, Inc. (NYSE:ICE) ... today released its May 2025 ICE First Look, which shows that delinquencies and foreclosure activity continues to trend slightly higher on an annual basis despite some seasonal and disaster recovery related improvement.
The ICE First Look reports on month-end delinquency, foreclosure and prepayment statistics sourced from its loan-level database, which covers a majority of the U.S. mortgage market. Key takeaways from this month’s findings include:
• The national delinquency rate ticked down 2 basis points (bps) to 3.20% in May, though it is up 5.2% (16 bps) year over year (YoY).
• Serious delinquencies – loans 90+ days past due but not in foreclosure – improved seasonally for the fifth consecutive month, but are still up 56K (14%) from the same time last year.
• Disaster-related delinquencies also improved, with those related to the 2024 hurricane season falling by nearly 5K (26%) month over month (MoM) and Los Angeles wildfire-related delinquencies falling by a more modest 9% MoM.
• Foreclosure starts and active foreclosure inventories climbed YoY, with May’s 7K foreclosure sales marking the largest single-month volume in more than two years.
• Prepayment activity, as measured by single month mortality, inched up to 0.71%, the highest level since October 2024, driven by a seasonal rise in home sale-related prepayments. Prepayments were up 23.4% YoY.
emphasis added
 Click on graph for larger image.
Here is a table from ICE.
Hotels: Occupancy Rate Decreased 2.4% Year-over-year
by Calculated Risk on 6/24/2025 01:16:00 PM
The U.S. hotel industry reported mostly negative year-over-year comparisons, according to CoStar’s latest data through 14 June. ...The following graph shows the seasonal pattern for the hotel occupancy rate using the four-week average.
8-14 June 2025 (percentage change from comparable week in 2024):
• Occupancy: 68.6% (-2.4%)
• Average daily rate (ADR): US$163.43 (+0.6%)
• Revenue per available room (RevPAR): US$112.11 (-1.8%)
emphasis added
 Click on graph for larger image.
The red line is for 2025, blue is the median, and dashed light blue is for 2024. Dashed purple is for 2018, the record year for hotel occupancy.
The 4-week average of the occupancy rate is tracking behind both last year and the median rate for the period 2000 through 2024 (Blue).
Note: Y-axis doesn't start at zero to better show the seasonal change.
The 4-week average will increase during the summer travel season; however, we will likely see a hit to occupancy during the summer months due to less international tourism.
Newsletter: Case-Shiller: National House Price Index Up 2.7% year-over-year in April
by Calculated Risk on 6/24/2025 09:39:00 AM
Today, in the Calculated Risk Real Estate Newsletter: Case-Shiller: National House Price Index Up 2.7% year-over-year in April
Excerpt:
S&P/Case-Shiller released the monthly Home Price Indices for April ("April" is a 3-month average of February, March and April closing prices). February closing prices include some contracts signed in December, so there is a significant lag to this data. Here is a graph of the month-over-month (MoM) change in the Case-Shiller National Index Seasonally Adjusted (SA).
The MoM decrease in the seasonally adjusted (SA) Case-Shiller National Index was at -0.51% (a -4.8% annual rate). This was the second consecutive MoM decrease.
On a seasonally adjusted basis, prices increased month-to-month in just 5 of the 20 Case-Shiller cities. San Francisco has fallen 6.4% from the recent peak, Tampa is down 2.7% from the peak, and Denver down 2.0%.

Case-Shiller: National House Price Index Up 2.7% year-over-year in April
by Calculated Risk on 6/24/2025 09:00:00 AM
S&P/Case-Shiller released the monthly Home Price Indices for April ("April" is a 3-month average of February, March and April closing prices).
This release includes prices for 20 individual cities, two composite indices (for 10 cities and 20 cities) and the monthly National index.
From S&P S&P CoreLogic Case-Shiller Index Records 2.7% Annual Gain in April 2025
The S&P CoreLogic Case-Shiller U.S. National Home Price NSA Index, covering all nine U.S. census divisions, reported a 2.7% annual return for April, down from a 3.4% annual gain in the previous month. The 10-City Composite saw an annual increase of 4.1%, down from a 4.8% annual increase in the previous month. The 20-City Composite posted a year-over-year increase of 3.4%, down from a 4.1% increase in the previous month. New York again reported the highest annual gain among the 20 cities with a 7.9% increase in April, followed by Chicago and Detroit with annual increases of 6.0% and 5.5%, respectively. Tampa posted the lowest return, falling 2.2%.
...
The pre-seasonally adjusted U.S. National Index saw slight upward trends in April, posting gains of 0.6%. The 10-City Composite and 20-City Composite Indices both reported gains of 0.7%.
After seasonal adjustment, the U.S. National Index posted a decrease of -0.4%. Both the 10-City Composite and the 20-City Composite Indices saw a -0.3% decrease.
“The housing market continued its gradual deceleration in April, with annual price gains slowing to their most modest pace in nearly two years,” said Nicholas Godec, CFA, CAIA, CIPM, Head of Fixed Income Tradables & Commodities at S&P Dow Jones Indices. “What's particularly striking is how this cycle has reshuffled regional leadership—markets that were pandemic darlings are now lagging, while historically steady performers in the Midwest and Northeast are setting the pace. This rotation signals a maturing market that's increasingly driven by fundamentals rather than speculative fervor.
“The National Composite Index posted a 2.7% annual gain in April, marking its slowest year-over-year appreciation since mid-2023. This deceleration was broad-based, with the 20-City Composite advancing 3.4% and the 10-City Composite up 4.1%—both substantially below their recent peaks. The composition of these gains tells an important story: Approximately 1.7 percentage points of April's annual increase occurred over the past six months, indicating that price momentum has been concentrated in the recent spring selling season rather than sustained throughout the year. "
emphasis added
 Click on graph for larger image.
 The first graph shows the nominal seasonally adjusted Composite 10, Composite 20 and National indices (the Composite 20 was started in January 2000).
The Composite 10 index was down 0.3% in April (SA). The Composite 20 index was down 0.3% (SA) in April.
The National index was down 0.4% (SA) in April.
 The second graph shows the year-over-year change in all three indices.
The Composite 10 NSA was up 4.1% year-over-year. The Composite 20 NSA was up 3.4% year-over-year.
The National index NSA was up 2.7% year-over-year.
Annual price changes were lower than expectations. I'll have more later.
Monday, June 23, 2025
Tuesday: Case-Shiller House Prices, Fed Chair Powell Testimony
by Calculated Risk on 6/23/2025 08:11:00 PM
 From Matthew Graham at Mortgage News Daily: Mortgage Rates Lowest Since May 1st
Mortgage rates ended the previous week roughly in line with the best levels since May 1st. Today's modest improvement made it official.Tuesday:
Mortgage rates are primarily a function of trading levels in the bond market and bonds have had a few reasons to move at the start of the new week.
There's a small case to be made that U.S. involvement in the conflict between Israel and Iran contributed to bond market strength and, thus, lower mortgage rates today. [30 year fixed 6.84%]
emphasis added
• At 9:00 AM ET, S&P/Case-Shiller House Price Index for April. The National index was up 3.4% year-over-year in March.
• Also at 9:00 AM, FHFA House Price Index for April. This was originally a GSE only repeat sales, however there is also an expanded index.
• At 10:00 AM, Richmond Fed Survey of Manufacturing Activity for June.
• Also at 10:00 AM, State Employment and Unemployment (Monthly) for May 2024.
• Also at 10:00 AM, Testimony, Fed Chair Jerome Powell, Semiannual Monetary Policy Report to Congress, Before the U.S. House Financial Services Committee
A Very Early Look at 2026 Cost-Of-Living Adjustments and Maximum Contribution Base
by Calculated Risk on 6/23/2025 02:27:00 PM
The BLS reported earlier this month:
The Consumer Price Index for Urban Wage Earners and Clerical Workers (CPI-W) increased 2.2 percent over the last 12 months to an index level of 314.839 (1982-84=100). For the month, the index increased 0.2 percent prior to seasonal adjustment.CPI-W is the index that is used to calculate the Cost-Of-Living Adjustments (COLA). The calculation dates have changed over time (see Cost-of-Living Adjustments), but the current calculation uses the average CPI-W for the three months in Q3 (July, August, September) and compares to the average for the highest previous average of Q3 months. Note: this is not the headline CPI-U and is not seasonally adjusted (NSA).
• In 2024, the Q3 average of CPI-W was 308.729.
The 2024 Q3 average was the highest Q3 average, so we only have to compare Q3 this year to last year.
 Click on graph for larger image.
This graph shows CPI-W since January 2000. The red lines are the Q3 average of CPI-W for each year.
Note: The year labeled is for the calculation, and the adjustment is effective for December of that year (received by beneficiaries in January of the following year).
CPI-W was up 2.2% year-over-year in May, and although this is very early - we need the data for July, August and September - my very early guess is COLA will probably be in the 2% to 3% range again this year, possibly the smallest increase since 1.3% in 2021 (the increase was 2.5% for 2025).
Contribution and Benefit Base
The contribution base will be adjusted using the National Average Wage Index. This is based on a one-year lag. The National Average Wage Index is not available for 2024 yet, although we know wages increased solidly in 2024. If wages increased 5% in 2024, then the contribution base next year will increase to around $185,000 in 2026, from the current $176,100.
Remember - this is a very early look. What matters is average CPI-W, NSA, for all three months in Q3 (July, August and September).
Newsletter: NAR: Existing-Home Sales Increased to 4.03 million SAAR in May; Down 0.7% YoY
by Calculated Risk on 6/23/2025 10:50:00 AM
Today, in the CalculatedRisk Real Estate Newsletter: NAR: Existing-Home Sales Increased to 4.03 million SAAR in May; Down 0.7% YoY
Excerpt:
Sales in May (4.03 million SAAR) were up 0.8% from the previous month and were 0.7% below the May 2024 sales rate. This was the 4th consecutive month with a year-over-year decline in sales. ... The sales rate was above the consensus forecast (but right at housing economist Tom Lawler’s estimate).There is much more in the article.
...
Sales Year-over-Year and Not Seasonally Adjusted (NSA)
The fourth graph shows existing home sales by month for 2024 and 2025.
Sales decreased 0.7% year-over-year compared to May 2024. This was the 4th consecutive month with a year-over-year decline. The next four months will have the easiest year-over-year comparisons.
...
On an NSA basis for the month of May, this was 3% above the low for housing bust for the month of May that happened in May 2009. Year-to-date, sales are down 2.8% NSA.

NAR: Existing-Home Sales Increased to 4.03 million SAAR in May; Down 0.7% YoY
by Calculated Risk on 6/23/2025 10:00:00 AM
From the NAR: NAR Existing-Home Sales Report Shows 0.8% Increase in May
Existing-home sales rose in May, according to the National Association of REALTORS®. Sales elevated in the Northeast, Midwest and South, but retreated in the West. Year-over-year, sales progressed in the Northeast and Midwest but contracted in the South and West. ...
• 0.8% increase in total existing-home sales month-over-month to a seasonally adjusted annual rate of 4.03 million.
• 0.7% decrease year-over-year, sales declined 0.7% (down from 4.06 million in May 2024).
• 1.54 million units: Total housing inventory, up 6.2% from April and 20.3% from May 2024 (1.28 million).
• 4.6-month supply of unsold inventory, up from 4.4 months in April and 3.8 months in May 2024.
emphasis added
 Click on graph for larger image.
This graph shows existing home sales, on a Seasonally Adjusted Annual Rate (SAAR) basis since 1994.
Sales in May (4.03 million SAAR) were up 0.8% from the previous month and were 0.7% below the May 2024 sales rate. This was the 4th consecutive month with a year--over-year decline in sales.
The second graph shows nationwide inventory for existing homes.
 According to the NAR, inventory increased to 1.54 million in May from 1.45 million the previous month.
 According to the NAR, inventory increased to 1.54 million in May from 1.45 million the previous month.
Headline inventory is not seasonally adjusted, and inventory usually decreases to the seasonal lows in December and January, and peaks in mid-to-late summer.
The last graph shows the year-over-year (YoY) change in reported existing home inventory and months-of-supply. Since inventory is not seasonally adjusted, it really helps to look at the YoY change. Note: Months-of-supply is based on the seasonally adjusted sales and not seasonally adjusted inventory.
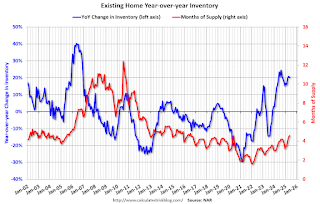 Inventory was up 20.3% year-over-year (blue) in May compared to May 2024.
Months of supply (red) increased to 4.6 months in May from 4.4 months the previous month.
As expected, the sales rate was above the consensus forecast. I'll have more later.
The last graph shows the year-over-year (YoY) change in reported existing home inventory and months-of-supply. Since inventory is not seasonally adjusted, it really helps to look at the YoY change. Note: Months-of-supply is based on the seasonally adjusted sales and not seasonally adjusted inventory.
 Inventory was up 20.3% year-over-year (blue) in May compared to May 2024.
 Months of supply (red) increased to 4.6 months in May from 4.4 months the previous month.
As expected, the sales rate was above the consensus forecast. I'll have more later.
Housing June 23rd Weekly Update: Inventory up 0.4% Week-over-week, Up 30.7% Year-over-year
by Calculated Risk on 6/23/2025 08:11:00 AM
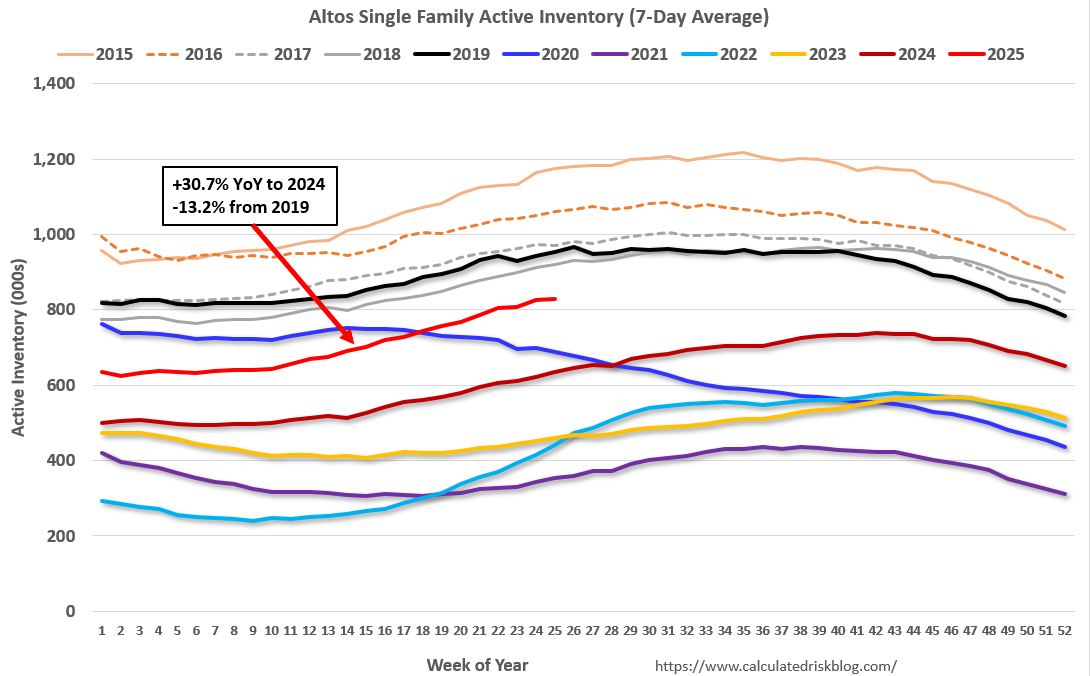
Altos reports that active single-family inventory was up 0.4% week-over-week.
Inventory is now up 32.7% from the seasonal bottom in January and is increasing.
Usually, inventory is up about 18% to 19% from the seasonal low by this week in the year. So, 2025 is seeing a larger than normal pickup in inventory.
The first graph shows the seasonal pattern for active single-family inventory since 2015.
 Click on graph for larger image.
The red line is for 2025. The black line is for 2019.
Inventory was up 30.7% compared to the same week in 2024 (last week it was up 33.1%), and down 13.2% compared to the same week in 2019 (last week it was down 12.4%).
This is the highest level since 2019.
It now appears inventory will be close to 2019 levels towards the end of 2025.
 This second inventory graph is courtesy of Altos Research.
As of June 20th, inventory was at 829 thousand (7-day average), compared to 826 thousand the prior week.
Mike Simonsen discusses this data regularly on Youtube


