 RSS Feed
 by Calculated Risk on 6/17/2025 07:56:00 PM
Tuesday, June 17, 2025
Wednesday: Housing Starts, Unemployment Claims, FOMC Statement
 Note: Mortgage rates are from MortgageNewsDaily.com and are for top tier scenarios.
Wednesday:
• At 7:00 AM ET, The Mortgage Bankers Association (MBA) will release the results for the mortgage purchase applications index.
• At 8:30 AM, The initial weekly unemployment claims report will be released. The consensus is for initial claims of 250 thousand, up from 248 thousand last week.
• Also at 8:30 AM ET, Housing Starts for May. The consensus is for 1.370 million SAAR, up from 1.361 million SAAR in April.
• During the day, The AIA's Architecture Billings Index for April (a leading indicator for commercial real estate).
• At 2:00 PM, FOMC Statement. The FOMC is expected to leave the Fed Funds rate unchanged at this meeting.
• Also at 2:00 PM, FOMC Projections This will include the Federal Open Market Committee (FOMC) participants' projections of the appropriate target federal funds rate along with the quarterly economic projections.
• At 2:30 PM, Fed Chair Jerome Powell holds a press briefing following the FOMC announcement.
LA Ports: Traffic Down Sharply in May
by Calculated Risk on 6/17/2025 05:31:00 PM
Container traffic gives us an idea about the volume of goods being exported and imported - and usually some hints about the trade report since LA area ports handle about 40% of the nation's container port traffic.
The following graphs are for inbound and outbound traffic at the ports of Los Angeles and Long Beach in TEUs (TEUs: 20-foot equivalent units or 20-foot-long cargo container).
The first graph is the monthly data (with a strong seasonal pattern for imports).
 Click on graph for larger image.
Usually imports peak in the July to October period as retailers import goods for the Christmas holiday and then decline sharply and bottom in the Winter depending on the timing of the Chinese New Year.
To remove the strong seasonal component for inbound traffic, the second graph shows the rolling 12-month average.
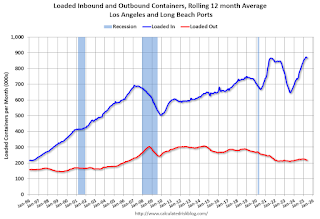 On a rolling 12-month basis, inbound traffic decreased 0.8% in May compared to the rolling 12 months ending the previous month. Outbound traffic decreased 0.9% compared to the rolling 12 months ending the previous month.
 Click on graph for larger image.
Usually imports peak in the July to October period as retailers import goods for the Christmas holiday and then decline sharply and bottom in the Winter depending on the timing of the Chinese New Year.
Imports were down 11% YoY in May and exports were also down 11% YoY.
To remove the strong seasonal component for inbound traffic, the second graph shows the rolling 12-month average.
 On a rolling 12-month basis, inbound traffic decreased 0.8% in May compared to the rolling 12 months ending the previous month. Outbound traffic decreased 0.9% compared to the rolling 12 months ending the previous month.
Earlier this year, importers rushed to beat the tariffs. Port traffic will likely be much slower for the remainder of this year.
Housing Market Index and Single Family Starts
by Calculated Risk on 6/17/2025 12:18:00 PM
Today, in the Calculated Risk Real Estate Newsletter: Housing Market Index and Single Family Starts
A brief excerpt:
This morning, the National Association of Home Builders (NAHB) released their monthly housing market index: Builder Sentiment at Third Lowest Reading Since 2012There is much more in the article.
...
There are several negatives for new home builders now. The NAHB lists the following: rising inventory levels (this is true for both new homes and existing homes that compete with new homes), price declines for existing home sales in a “growing number of markets”, buyer hesitancy due to “elevated mortgage rates and tariff and economic uncertainty”.
In addition, margins are being squeezed by rising costs (both material and labor), and price cuts. This will be a difficult period for homebuilders.
The following graph shows the NAHB HMI and single family starts since 1985.

NAHB: "Builder Sentiment at Third Lowest Reading Since 2012" in June
by Calculated Risk on 6/17/2025 10:00:00 AM
The National Association of Home Builders (NAHB) reported the housing market index (HMI) was at 32, down from 34 last month. Any number below 50 indicates that more builders view sales conditions as poor than good.
From the NAHB: Builder Sentiment at Third Lowest Reading Since 2012
In a further sign of declining builder sentiment, the use of price incentives increased sharply in June as the housing market continues to soften.
Builder confidence in the market for newly built single-family homes was 32 in June, down two points from May, according to the National Association of Home Builders (NAHB)/Wells Fargo Housing Market Index (HMI) released today. The index has only posted a lower reading twice since 2012 – in December 2022 when it hit 31 and in April 2020 at the start of the pandemic when it plunged more than 40 points to 30.
“Buyers are increasingly moving to the sidelines due to elevated mortgage rates and tariff and economic uncertainty,” said NAHB Chairman Buddy Hughes, a home builder and developer from Lexington, N.C. “To help address affordability concerns and bring hesitant buyers off the fence, a growing number of builders are moving to cut prices.”
Indeed, the latest HMI survey also revealed that 37% of builders reported cutting prices in June, the highest percentage since NAHB began tracking this figure on a monthly basis in 2022. This compares with 34% of builders who reported cutting prices in May and 29% in April. Meanwhile, the average price reduction was 5% in June, the same as it’s been every month since last November. The use of sales incentives was 62% in June, up one percentage point from May.
“Rising inventory levels and prospective home buyers who are on hold waiting for affordability conditions to improve are resulting in weakening price growth in most markets and generating price declines for resales in a growing number of markets,” said NAHB Chief Economist Robert Dietz. “Given current market conditions, NAHB is forecasting a decline in single-family starts for 2025.”
...
All three of the major HMI indices posted losses in June. The HMI index gauging current sales conditions fell two points in June to a level of 35, the component measuring sales expectations in the next six months dropped two points lower to 40 while the gauge charting traffic of prospective buyers posted a two-point decline to 21, the lowest reading since November 2023.
Looking at the three-month moving averages for regional HMI scores, the Northeast fell one point to 43, the Midwest moved one point higher to 41, the South dropped three points to 33 and the West declined four points to 28.
emphasis added
 Click on graph for larger image.
This graph shows the NAHB index since Jan 1985.
This was well below the consensus forecast.
Industrial Production Decreased 0.2% in May
by Calculated Risk on 6/17/2025 09:15:00 AM
From the Fed: Industrial Production and Capacity Utilization
Industrial production (IP) fell 0.2 percent in May after increasing 0.1 percent in April. Manufacturing output ticked up 0.1 percent in May, driven by a gain of 4.9 percent in the index for motor vehicles and parts; the index for manufacturing excluding motor vehicles and parts fell 0.3 percent. The index for mining increased 0.1 percent, and the index for utilities decreased 2.9 percent. At 103.6 percent of its 2017 average, total IP in May was 0.6 percent above its year-earlier level. Capacity utilization moved down to 77.4 percent, a rate that is 2.2 percentage points below its long-run (1972–2024) average.
emphasis added
 Click on graph for larger image.
This graph shows Capacity Utilization. This series is up from the record low set in April 2020, and close to the level in February 2020 (pre-pandemic).
Capacity utilization at 77.4% is 2.2% below the average from 1972 to 2023. This was below consensus expectations.
Note: y-axis doesn't start at zero to better show the change.
 The second graph shows industrial production since 1967.
Industrial production decreased to 103.6. This is above the pre-pandemic level.
Industrial production was below consensus expectations and the previous months were revised down.
Retail Sales Decreased 0.9% in May
by Calculated Risk on 6/17/2025 08:30:00 AM
On a monthly basis, retail sales decreased 0.9% from April to May (seasonally adjusted), and sales were up 3.3 percent from May 2024.
From the Census Bureau report:
Advance estimates of U.S. retail and food services sales for May 2025, adjusted for seasonal variation and holiday and trading-day differences, but not for price changes, were $715.4 billion, down 0.9 percent from the previous month, and up 3.3 percent rom May 2024. ... The March 2025 to April 2025 percent change was revised from up 0.1 percent to down 0.1 percent.
emphasis added
 Click on graph for larger image.
This graph shows retail sales since 1992. This is monthly retail sales and food service, seasonally adjusted (total and ex-gasoline).
Retail sales ex-gasoline was down 0.8% in May.
The second graph shows the year-over-year change in retail sales and food service (ex-gasoline) since 1993.
Retail and Food service sales, ex-gasoline, increased by 4.4% on a YoY basis.
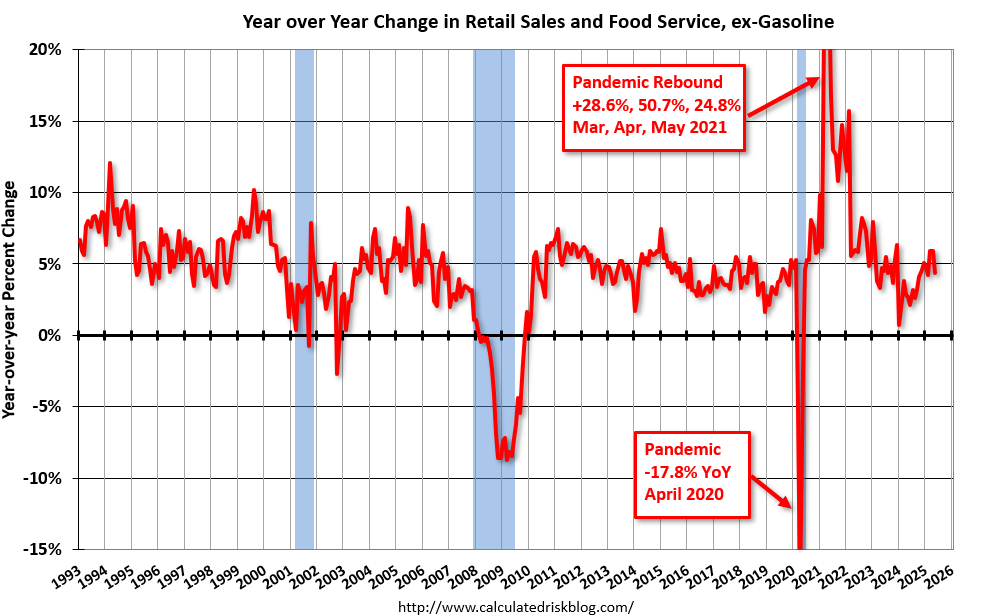 The change in sales in May were below expectations and the previous two months were revised down.
A weak report.
Monday, June 16, 2025
Tuesday: Retail Sales, Industrial Production, Homebuilder Survey
by Calculated Risk on 6/16/2025 07:11:00 PM
 From Matthew Graham at Mortgage News Daily: Mortgage Rates Drift Slightly Higher to Start The Week
While there's been no shortage of political and geopolitical headlines over the past 2 business days, there hasn't been much by way of inspiration for the bond market. Bonds (and, thus, rates) have moved nonetheless.Tuesday:
...
Tomorrow's Retail Sales data is capable of causing volatility in either direction, depending on the outcome. Then on Wednesday, we'll hear from the Fed. While they will not be cutting rates at this meeting, they will be updating their rate outlook--something that frequently gets the market's attention. [30 year fixed 6.91%]
emphasis added
• At 8:30 AM ET, Retail sales for May is scheduled to be released. The consensus is for a 0.5% decrease in retail sales.
• At 9:15 AM, The Fed will release Industrial Production and Capacity Utilization for May. The consensus is for a 0.1% increase in Industrial Production, and for Capacity Utilization to be unchanged at 77.7%.
• At 10:00 AM, The June NAHB homebuilder survey. The consensus is for a reading of 36, up from 34 last month. Any number below 50 indicates that more builders view sales conditions as poor than good.
3rd Look at Local Housing Markets in May
by Calculated Risk on 6/16/2025 10:49:00 AM
Today, in the Calculated Risk Real Estate Newsletter: 3rd Look at Local Housing Markets in May
A brief excerpt:
The NAR is scheduled to release May existing home sales on Monday, June 23rd at 10:00 AM. Housing economist Tom Lawler expects the NAR to report sales at a seasonally adjusted annual rate (SAAR) of 4.03 million for May, up slightly from April and down slightly year-over-year.There is much more in the article.
...
In May, sales in these markets were down 4.3% YoY. Last month, in April, these same markets were down 3.4% year-over-year Not Seasonally Adjusted (NSA).
Important: There were fewer working days in May 2025 (21) as in May 2024 (22). So, the year-over-year change in the headline SA data will be higher than for the NSA data.
...
More local markets to come!

Housing June 16th Weekly Update: Inventory up 2.1% Week-over-week, Up 33.1% Year-over-year
by Calculated Risk on 6/16/2025 08:11:00 AM
Altos reports that active single-family inventory was up 2.1% week-over-week.
Inventory is now up 32.2% from the seasonal bottom in January and is increasing.
Usually, inventory is up about 18% from the seasonal low by this week in the year. So, 2025 is seeing a larger than normal pickup in inventory.
The first graph shows the seasonal pattern for active single-family inventory since 2015.
 Click on graph for larger image.
The red line is for 2025. The black line is for 2019.
Inventory was up 33.1% compared to the same week in 2024 (last week it was up 32.2%), and down 12.4% compared to the same week in 2019 (last week it was down 13.0%).
This is the highest level since 2019.
It now appears inventory will be close to 2019 levels towards the end of 2025.
 This second inventory graph is courtesy of Altos Research.
As of June 13th, inventory was at 826 thousand (7-day average), compared to 809 thousand the prior week.
Mike Simonsen discusses this data regularly on Youtube
Sunday, June 15, 2025
Sunday Night Futures
by Calculated Risk on 6/15/2025 06:24:00 PM
Weekend:
• Schedule for Week of June 15, 2025
Monday:
• At 8:30 AM ET, The New York Fed Empire State manufacturing survey for June. The consensus is for a reading of -6.0, up from -9.2.
From CNBC: Pre-Market Data and Bloomberg futures S&P 500 are down 17 and DOW futures are down 134 (fair value).
Oil prices were up over the last week with WTI futures at $75.49 per barrel and Brent at $76.72 per barrel. A year ago, WTI was at $79, and Brent was at $81 - so WTI oil prices are down about 4% year-over-year.
Here is a graph from Gasbuddy.com for nationwide gasoline prices. Nationally prices are at $3.09 per gallon. A year ago, prices were at $3.43 per gallon, so gasoline prices are down $0.34 year-over-year.


