 RSS Feed
 by Calculated Risk on 4/15/2025 07:55:00 PM
Tuesday, April 15, 2025
Wednesday: Retail Sales, Industrial Production, Homebuilder Survey, Fed Chair Powell
 Note: Mortgage rates are from MortgageNewsDaily.com and are for top tier scenarios.
Wednesday:
• At 7:00 AM ET, The Mortgage Bankers Association (MBA) will release the results for the mortgage purchase applications index.
• At 8:30 AM, Retail sales for March is scheduled to be released. The consensus is for a 1.3% increase in retail sales.
• At 9:15 AM, The Fed will release Industrial Production and Capacity Utilization for March. The consensus is for a 0.3% decrease in Industrial Production, and for Capacity Utilization to decrease to 77.9%.
• At 10:00 AM, The April NAHB homebuilder survey. The consensus is for a reading of 38, down from 39. Any number below 50 indicates that more builders view sales conditions as poor than good.
• At 1:30 PM, Speech, Fed Chair Jerome Powell, Economic Outlook, At the Economic Club of Chicago, Chicago, Ill.
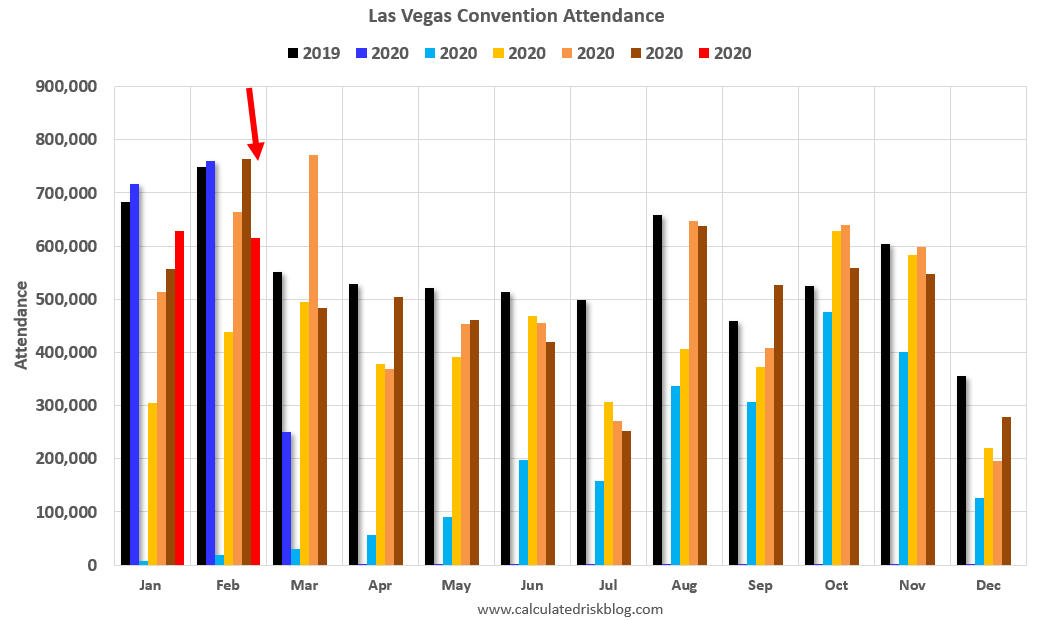
Las Vegas in February: Visitor Traffic Down 11.9% YoY; Convention Traffic Down 19.5% YoY
by Calculated Risk on 4/15/2025 02:38:00 PM
From the Las Vegas Visitor Authority: February 2025 Las Vegas Visitor Statistics
With the combined factors of a tough comparison to last year when Super Bowl LVIII was held in the destination, a net decrease in the convention segment tied to rotation cycles, and one fewer day on the calendar compared to the 2024 leap year, visitation fell below 3.0M for the month, down ‐11.9% YoY.
Las Vegas convention attendance reached roughly 615k in February, down ‐19.5% YoY, reflecting in part the calendar impact of World Market Center's Winter show (38k attendees) and Total Product Expo (8k attendees) ending in Jan this year vs. Feb last year, plus show rotations of Int'l Roofing Expo (15k attendees) and National Automobile Dealers Assn (22k attendees) which were held elsewhere this year.
Occupancy reached 80.5%, down ‐3.4 pts with Weekend occupancy of 86.4% (down ‐3.9 pts) and Midweek occupancy of 77.7% (down ‐3.3 pts.) ADR for the month reached $186 (‐25% YoY) with RevPAR of $150 (‐28% YoY).
emphasis added
 Click on graph for larger image.
 The first graph shows visitor traffic for 2019 (Black), 2020 (dark blue), 2021 (light blue), 2022 (light orange), 2023 (orange), 2024 (dark orange) and 2025 (red).
Visitor traffic was down 11.9% compared to last February. Visitor traffic was down 6.8% compared to February 2019.
The second graph shows convention traffic.
3rd Look at Local Housing Markets in March
by Calculated Risk on 4/15/2025 11:34:00 AM
Today, in the Calculated Risk Real Estate Newsletter: 3rd Look at Local Housing Markets in March
A brief excerpt:
This is the third look at several early reporting local markets in March. I’m tracking over 40 local housing markets in the US. Some of the 40 markets are states, and some are metropolitan areas. I’ll update these tables throughout the month as additional data is released.There is much more in the article.
Closed sales in March were mostly for contracts signed in January and February when 30-year mortgage rates averaged 6.96% and 6.84%, respectively (Freddie Mac PMMS). This was an increase from the average rate for homes that closed in February. This was before the recent surge in economic uncertainty and stock market volatility that might impact existing home sales.
...
Here is a look at months-of-supply using NSA sales. Since this is NSA data, it is likely months-of-supply will increase into the Summer.
Months in red are areas that are seeing 5+ months of supply now and might see price pressures later this summer.
...
Many more local markets to come!

U.S. Demographics: Largest 5-year cohorts, and Ten most Common Ages in 2024
by Calculated Risk on 4/15/2025 08:11:00 AM
Eleven years ago, I wrote: Census Bureau: Largest 5-year Population Cohort is now the "20 to 24" Age Group. Those people are now in the 30 to 34 cohort.
This month the Census Bureau released the population estimates for July 2024 by age, and I've updated the table from the previous posts.
The table below shows the top 10 cohorts by size for 2010, 2024 (just released), and the most recent Census Bureau projections for 2030.
In 2024, the top 6 cohorts were under 45 (the Boomers are fading away), and by 2030 the top 7 cohorts will be under 50. Note: This is using the 2023 projections main series.
There will be plenty of "gray hairs" walking around in 2030, but the key for the economy is the large cohorts in the prime working age.
As I noted in 2014, demographics were positive for apartments, and more recently positive for homeownership.
| Population: Largest 5-Year Cohorts by Year | ||||
|---|---|---|---|---|
| Largest Cohorts | 2010 | 2024 | 2030 | |
| 1 | 45 to 49 years | 30 to 34 years | 35 to 39 years | |
| 2 | 50 to 54 years | 35 to 39 years | 30 to 34 years | |
| 3 | 15 to 19 years | 25 to 29 years | 25 to 29 years | |
| 4 | 20 to 24 years | 20 to 24 years | 40 to 44 years | |
| 5 | 25 to 29 years | 15 to 19 years | 20 to 24 years | |
| 6 | 40 to 44 years | 40 to 44 years | 45 to 49 years | |
| 7 | 10 to 14 years | 60 to 64 years | 15 to 19 years | |
| 8 | 5 to 9 years | 10 to 14 years | 50 to 54 years | |
| 9 | Under 5 years | 50 to 54 years | 65 to 69 years | |
| 10 | 35 to 39 years | 55 to 59 years | 10 to 14 years | |

Click on graph for larger image.
This graph, based on the 2024 population estimate, shows the U.S. population by age in July 2024 according to the Census Bureau.
Note that the largest age group is in the early-to-mid 30s. There are still a number of younger Boomers in their early-to-mid 60s.
Monday, April 14, 2025
Tuesday: NY Fed Mfg
by Calculated Risk on 4/14/2025 07:54:00 PM
 From Matthew Graham at Mortgage News Daily: Mortgage Rates Fall Back Below 7%
Last Friday was notable in that it was the first day since February 19th where the average top tier 30yr fixed mortgage rate ended the day over 7%. Last week was also notable for ranking among the more abrupt weeks for rising rates over the past few years.Tuesday:
Things are getting off to a friendlier start in the present week with the 30yr fixed rate index edging back below 7%--roughly in line with levels seen last Wed/Thu. [30 year fixed 6.98%]
emphasis added
• At 8:30 AM ET, The New York Fed Empire State manufacturing survey for April. The consensus is for a reading of -10.0, up from -20.0.
Lawler: Update on Mortgage/MBS Rates and Spreads
by Calculated Risk on 4/14/2025 02:49:00 PM
From housing economist Tom Lawler: Update on Mortgage/MBS Rates and Spreads
On April 4th, the day after Trump’s “Liberation Day” tariff announcement, the so-called 30-year “current-coupon” MBS yield closed at 5.34%, its lowest level since the middle of last October. Last week’s bond market debacle, however, hit the MBS market especially hard, and the current-coupon MBS yield closed the week at 5.93%, its highest level since the middle of January.
 Obviously a major catalyst for the surge in MBS yields was the sharp increase in intermediate- and long-term Treasury rates. Putting additional upward pressure on MBS yields was the surge in market-implied interest-rate volatility. For example, the ICE BofAML MOVE Index, which is a measure of implied interest rate volatility derived from options on Treasury securities across the yield curve, jumped to 137.26 last Friday, its highest level since May 2023 and up sharply from 101.35 at the end of March.
 Finally, a widely-followed measure of the CCMBS option-adjusted spread to Treasuries from Yield Book increased by about 12 bp last week.
Watch Inventory and Why Measures of Existing Home Inventory appear Different
by Calculated Risk on 4/14/2025 11:16:00 AM
Today, in the Calculated Risk Real Estate Newsletter: Watch Inventory and Why Measures of Existing Home Inventory appear Different
A brief excerpt:
We are in a period of significant policy uncertainty and there isn’t a good historical analog for the current period. However, for housing, the key will be to watch inventory.There is much more in the article.
Existing home inventory will provide clues on house prices, and a combination of existing and new home inventory will indicate what will happen with housing starts.
Watch Inventory
Here are a few examples of when inventory helped me call some turning points for house prices (this section is an update to a previous article):
Starting in January 2005, I was very bearish on housing, but I wasn’t sure when the market would turn. Speculative bubbles can go on and on. However, the increase in inventory in late 2005 (see red arrow on graph below) helped me call the top for house prices in 2006.
Several years later, in early 2012, when many people were still bearish on housing, the plunge in inventory in 2011 (blue arrow on graph below) helped me call the bottom for house prices in early 2012 (see The Housing Bottom is Here).

Housing April 14th Weekly Update: Inventory up 1.6% Week-over-week, Up 33.4% Year-over-year
by Calculated Risk on 4/14/2025 08:21:00 AM
Altos reports that active single-family inventory was up 2.3% week-over-week.
Inventory is now up 12.5% from the seasonal bottom in January and is increasing.
Usually, inventory is up about 5% or 6% from the seasonal low by this week in the year. So, 2025 is seeing a larger than normal pickup in inventory.
The first graph shows the seasonal pattern for active single-family inventory since 2015.
 Click on graph for larger image.
The red line is for 2025. The black line is for 2019.
Inventory was up 33.4% compared to the same week in 2024 (last week it was up 34.7%), and down 17.5% compared to the same week in 2019 (last week it was down 17.4%).
Inventory will pass 2020 levels soon, and it now appears inventory will be close to 2019 levels towards the end of 2025.
 This second inventory graph is courtesy of Altos Research.
As of April 11th, inventory was at 702 thousand (7-day average), compared to 691 thousand the prior week.
Mike Simonsen discusses this data regularly on Youtube
Sunday, April 13, 2025
Sunday Night Futures
by Calculated Risk on 4/13/2025 06:22:00 PM
Weekend:
• Schedule for Week of April 13, 2025
Monday:
• No major economic releases scheduled.
From CNBC: Pre-Market Data and Bloomberg futures S&P 500 are up 48 and DOW futures are up 250 (fair value).
Oil prices were down over the last week with WTI futures at $61.50 per barrel and Brent at $64.76 per barrel. A year ago, WTI was at $86, and Brent was at $93 - so WTI oil prices are down about 28% year-over-year.
Here is a graph from Gasbuddy.com for nationwide gasoline prices. Nationally prices are at $3.15 per gallon. A year ago, prices were at $3.60 per gallon, so gasoline prices are down $0.45 year-over-year.
PCE Inflation expected to be Soft in March
by Calculated Risk on 4/13/2025 08:31:00 AM
The Personal Consumption Expenditures (PCE) price index for March will be released on April 30th. The data released so far suggests the PCE inflation will be soft in March.
From Goldman Sachs economists:
The producer price index (PPI), the PPI excluding food and energy, and the PPI excluding food, energy, and trade were all below consensus expectations in March. The components relevant for core PCE were soft. Based on the details in the PPI and CPI reports, we estimate that the core PCE price index rose 0.08% in March (vs. our expectation of 0.13% before today's PPI report), corresponding to a year-over-year rate of +2.52%.And from BofA:
[W]e are tracking core PCE to rise by 0.1% m/m (0.08% unrounded) in March. This would be a notable deceleration from the first two months of the year. However, February is likely to be revised up significantly to 0.5% m/m due to a very large upward revision to portfolio management. As a result, we expect y/y core PCE to fall to 2.6% from an upwardly revised 2.9%.This is further improvement progress on inflation. If policy had remained unchanged, we'd probably be celebrating a "soft landing". However, the tariffs will likely impact prices in May (the data will be released in June).


