 RSS Feed
 by Calculated Risk on 3/07/2025 10:35:00 AM
Friday, March 07, 2025
Q1 GDP Tracking: Mid-to-High 1% Range
Special Note: There was a surge in gold imports in January. There is a time lag for when the imported gold will show up in inventories. GDPNow will correct for this once the gold is included as an increase in inventories, but currently GDPNow just included the import side. That is why GDPNow's tracking estimate of GDP is likely way too low.
From BofA:
Our 1Q GDP tracking is down from 2.3% q/q saar to 1.9% q/q saar since our last weekly publication. Also, after the second estimate of 4Q GDP, our 4Q tracking is up one-tenth to 2.4% q/q saar. [Mar 7th]From Goldman:
emphasis added
The details of the trade balance report indeed indicated that elevated gold imports contributed the bulk of increase in imports in January. Goods exports were softer than suggested by the Advance Economic Indicators report, while wholesale inventories were slightly firmer. Taken together, we lowered our Q1 GDP tracking estimate by 0.3pp to +1.3% (quarter-over-quarter annualized). [Mar 6th estimate]
 And from the Atlanta Fed: GDPNow
The GDPNow model estimate for real GDP growth (seasonally adjusted annual rate) in the first quarter of 2025 is -2.4 percent on March 6, up from -2.8 percent on March 3. After recent releases from the Institute for Supply Management, the US Bureau of Economic Analysis, and the US Census Bureau, the nowcasts of first-quarter real personal consumption expenditures growth and real gross private domestic investment growth increased from 0.0 percent and 2.5 percent, respectively, to 0.4 percent and 4.8 percent, while the nowcast of the contribution of net exports to first-quarter real GDP growth fell from -3.57 percentage points to -3.84 percentage points. [Mar 6th estimate]
Comments on February Employment Report
by Calculated Risk on 3/07/2025 09:05:00 AM
The headline jobs number in the February employment report was slightly below expectations, and December and January payrolls were revised down by 2,000 combined. The participation rate and the employment population ratio decreased, and the unemployment rate increased to 4.1%.
Prime (25 to 54 Years Old) Participation
 Since the overall participation rate is impacted by both cyclical (recession) and demographic (aging population, younger people staying in school) reasons, here is the employment-population ratio for the key working age group: 25 to 54 years old.
The 25 to 54 years old participation rate was unchanged in February at 83.5% from 83.5% in January.
The 25 to 54 employment population ratio decreased to 80.5% from 80.7% the previous month.
Both are down from the recent peaks, but still near the highest level this millennium.
Average Hourly Wages
 The graph shows the nominal year-over-year change in "Average Hourly Earnings" for all private employees from the Current Employment Statistics (CES).
Average Hourly Wages
 The graph shows the nominal year-over-year change in "Average Hourly Earnings" for all private employees from the Current Employment Statistics (CES).
 There was a huge increase at the beginning of the pandemic as lower paid employees were let go, and then the pandemic related spike reversed a year later.
Wage growth has trended down after peaking at 5.9% YoY in March 2022 and was at 4.0% YoY in February.
Wage growth has trended down after peaking at 5.9% YoY in March 2022 and was at 4.0% YoY in February.
Part Time for Economic Reasons
 From the BLS report:
"The number of people employed part time for economic reasons increased by 460,000 to 4.9 million in February. These individuals would have preferred full-time employment but were working part time because their hours had been reduced or they were unable to find full-time jobs."The number of persons working part time for economic reasons increased in February to 4.94 million from 4.48 million in January. This is above the pre-pandemic levels.
These workers are included in the alternate measure of labor underutilization (U-6) that increased to 8.0% from 7.5% in the previous month. This is down from the record high in April 2020 of 22.9% and up from the lowest level on record (seasonally adjusted) in December 2022 (6.6%). (This series started in 1994). This measure is above the 7.0% level in February 2020 (pre-pandemic).
Unemployed over 26 Weeks
 This graph shows the number of workers unemployed for 27 weeks or more.
 According to the BLS, there are 1.46 million workers who have been unemployed for more than 26 weeks and still want a job, up from 1.44 million the previous month.
This is down from post-pandemic high of 4.171 million, and up from the recent low of 1.056 million.
This is above pre-pandemic levels.
Job Streak
Summary:
The headline jobs number in the February employment report was slightly below expectations, and December and January payrolls were revised down by 2,000 combined. The participation rate and the employment population ratio decreased, and the unemployment rate increased to 4.1%.
This is above pre-pandemic levels.
Job Streak
Through February 2025, the employment report indicated positive job growth for 50 consecutive months, putting the current streak in 2nd place of the longest job streaks in US history (since 1939).
| Headline Jobs, Top 10 Streaks | ||
|---|---|---|
| Year Ended | Streak, Months | |
| 1 | 2020 | 113 |
| 2 | N/A | 501 |
| 3 | 1990 | 48 |
| 4 | 2007 | 46 |
| 5 | 1979 | 45 |
| 6 tie | 1943 | 33 |
| 6 tie | 1986 | 33 |
| 6 tie | 2000 | 33 |
| 9 | 1967 | 29 |
| 10 | 1995 | 25 |
| 1Currrent Streak | ||
Summary:
The headline jobs number in the February employment report was slightly below expectations, and December and January payrolls were revised down by 2,000 combined. The participation rate and the employment population ratio decreased, and the unemployment rate increased to 4.1%.
The headline number was decent.
February Employment Report: 151 thousand Jobs, 4.1% Unemployment Rate
by Calculated Risk on 3/07/2025 08:30:00 AM
From the BLS: Employment Situation
Total nonfarm payroll employment rose by 151,000 in February, and the unemployment rate changed little at 4.1 percent, the U.S. Bureau of Labor Statistics reported today. Employment trended up in health care, financial activities, transportation and warehousing, and social assistance. Federal government employment declined.
...
The change in total nonfarm payroll employment for December was revised up by 16,000, from +307,000 to +323,000, and the change for January was revised down by 18,000, from +143,000 to +125,000. With these revisions, employment in December and January combined is 2,000 lower than previously reported.
emphasis added
 Click on graph for larger image.
The first graph shows the jobs added per month since January 2021.
Total payrolls increased by 151 thousand in February. Private payrolls increased by 141 thousand, and public payrolls increased 11 thousand.
Payrolls for December and January were revised down 2 thousand, combined.
Payrolls for December and January were revised down 2 thousand, combined.
 The second graph shows the year-over-year change in total non-farm employment since 1968.
In February, the year-over-year change was 1.95 million jobs. Employment was up solidly year-over-year.
The third graph shows the employment population ratio and the participation rate.
 The Labor Force Participation Rate decreased to 62.4% in February, from 62.6% in January. This is the percentage of the working age population in the labor force.
 The Employment-Population ratio decreased to 59.9% from 60.1% in January (blue line).
I'll post the 25 to 54 age group employment-population ratio graph later.
 The fourth graph shows the unemployment rate.
 The unemployment rate increased to 4.1% in February from 4.0% in January.
This was slightly below consensus expectations, and December and January payrolls were revised down by 2,000 combined.
Thursday, March 06, 2025
Friday: Employment Report, Fed Chair Powell Speaks
by Calculated Risk on 3/06/2025 07:10:00 PM
 Note: Mortgage rates are from MortgageNewsDaily.com and are for top tier scenarios.
Friday:
• At 8:30 AM ET, Employment Report for February. The consensus is for 158,000 jobs added, and for the unemployment rate to be unchanged at 4.0%.
• At 12:30 PM: Speech, Fed Chair Jerome Powell, Economic Outlook, At The University of Chicago Booth School of Business 2025 U.S. Monetary Policy Forum, New York, N.Y.
February Employment Preview
by Calculated Risk on 3/06/2025 02:34:00 PM
On Friday at 8:30 AM ET, the BLS will release the employment report for February. The consensus is for 158,000 jobs added, and for the unemployment rate to be unchanged at 4.0%.
From Goldman Sachs:
We estimate nonfarm payrolls rose by 170k in February, slightly above consensus of +160k but below the three-month average of +237k. Alternative measures of employment growth indicated a firm pace of job creation, and we expect continued, albeit moderating, contributions from catch-up hiring and the recent surge in immigration. ... We estimate that the unemployment rate was unchanged on a rounded basis at 4.0%From BofA:
emphasis added
Feb non-farm payrolls are likely to print at a robust 185k. Government jobs are expected to come in at a slightly smaller than average 25k due to the federal hiring freeze. Given the muted claims data in the survey week, we do not expect DOGE driven job cuts to be a sizable drag on Feb data. Although, the colder than average weather could pose some downside risks. We expect the u-rate to remain at 4.0%.• ADP Report: The ADP employment report showed 77,000 private sector jobs were added in February. This was well below consensus forecasts and suggests job gains below consensus expectations, however, in general, ADP hasn't been very useful in forecasting the BLS report.
• ISM Surveys: Note that the ISM indexes are diffusion indexes based on the number of firms hiring (not the number of hires). The ISM® manufacturing employment index decreased to 47.6%, down from 50.3% the previous month. This would suggest about 30,000 jobs lost in manufacturing. The ADP report indicated 18,000 manufacturing jobs added in February.
The ISM® services employment index increased to 53.9%, from 52.3%. This would suggest 180,000 jobs added in the service sector. Combined this suggests 150,000 jobs added, close to consensus expectations. (Note: The ISM surveys have been way off recently)
• Unemployment Claims: The weekly claims report showed about the same initial unemployment claims during the reference week at 215,000 in February compared to 213,500 in January. This suggests layoffs in February were about the same as in January.
• Conclusion: Over the last year, employment gains averaged 168 thousand per month - and that is probably the current trend. With some bounce back from the cold weather in January, my guess is headline employment gains will be above consensus in February.
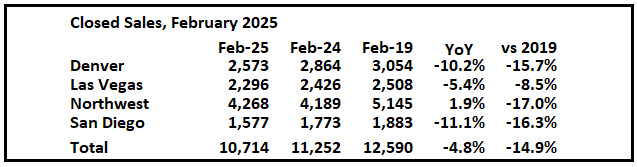
1st Look at Local Housing Markets in February
by Calculated Risk on 3/06/2025 11:50:00 AM
Today, in the Calculated Risk Real Estate Newsletter: 1st Look at Local Housing Markets in February
A brief excerpt:
NOTE: The tables for active listings, new listings and closed sales all include a comparison to February 2019 for each local market (some 2019 data is not available).There is much more in the article.
This is the first look at a few early reporting local markets in February. I’m tracking over 40 local housing markets in the US. Some of the 40 markets are states, and some are metropolitan areas. I’ll update these tables throughout the month as additional data is released.
Closed sales in February were mostly for contracts signed in December and January when 30-year mortgage rates averaged 6.72% and 6.96%, respectively (Freddie Mac PMMS). This was an increase from the average rate for homes that closed in January, and up slightly from the average rate of 6.7% in December 2023 and January 2024.
...
In February, sales in these markets were down 4.8% YoY. Last month, in January, these same markets were up 7.2% year-over-year Not Seasonally Adjusted (NSA).
Note that most of these early reporting markets have shown stronger year-over-year sales than most other markets for the last several months.
Important: There was one fewer working day in February 2025 (19) as compared to February 2024 (20). So, the year-over-year change in the headline SA data will be above the change in the NSA data (there are other seasonal factors).
...
This was just a few early reporting markets. Many more local markets to come!
Trade Deficit increased to $131.4 Billion in January
by Calculated Risk on 3/06/2025 08:52:00 AM
The Census Bureau and the Bureau of Economic Analysis reported:
The U.S. Census Bureau and the U.S. Bureau of Economic Analysis announced today that the goods and services deficit was $131.4 billion in January, up $33.3 billion from $98.1 billion in December, revised.
January exports were $269.8 billion, $3.3 billion more than December exports. January imports were $401.2 billion, $36.6 billion more than December imports.
emphasis added
 Click on graph for larger image.
Both exports and imports increased in January.
Exports were up 4.1% year-over-year; imports were up 23.1% year-over-year.
Both imports and exports have generally increased recently.
The second graph shows the U.S. trade deficit, with and without petroleum.
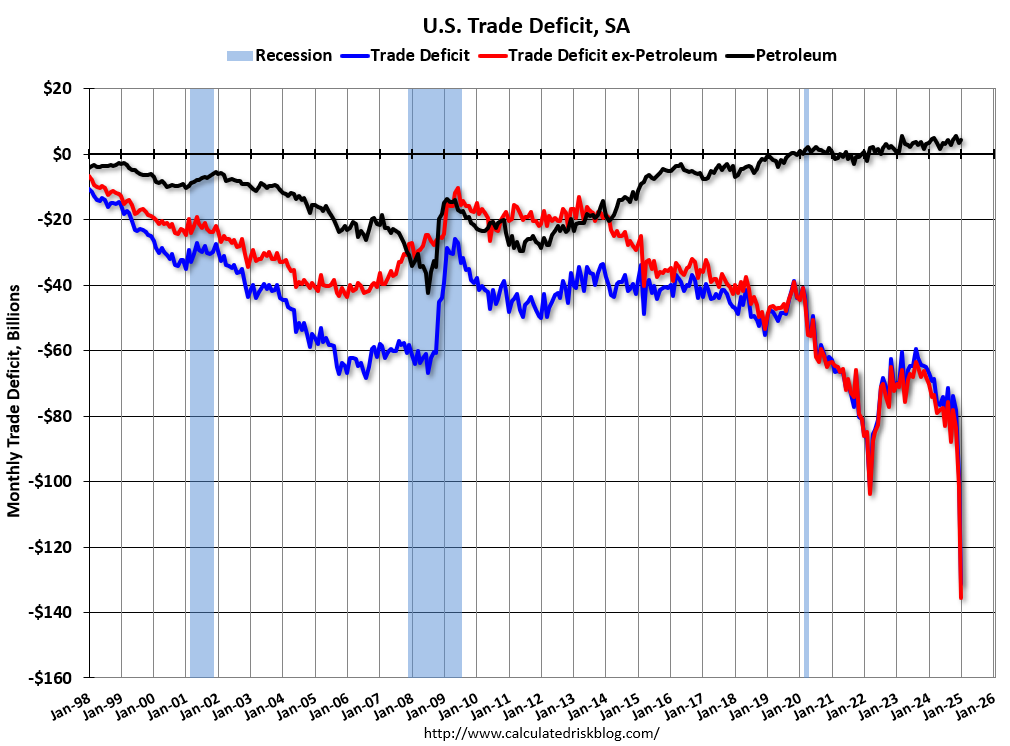 The blue line is the total deficit, and the black line is the petroleum deficit, and the red line is the trade deficit ex-petroleum products.
Note that net, exports of petroleum products are positive and have been increasing.
The trade deficit with China increased to $31.7 billion from $23.7 billion a year ago.
The surge in imports in January happened as some importers were avoiding the coming tariffs.
Weekly Initial Unemployment Claims Decrease to 221,000
by Calculated Risk on 3/06/2025 08:30:00 AM
The DOL reported:
In the week ending March 1, the advance figure for seasonally adjusted initial claims was 221,000, a decrease of 21,000 from the previous week's unrevised level of 242,000. The 4-week moving average was 224,250, an increase of 250 from the previous week's unrevised average of 224,000.The following graph shows the 4-week moving average of weekly claims since 1971.
emphasis added
 Click on graph for larger image.
The dashed line on the graph is the current 4-week average. The four-week average of weekly unemployment claims increased to 224,250.
The previous week was unrevised.
Weekly claims were lower than the consensus forecast.
Wednesday, March 05, 2025
Thursday: Unemployment Claims, Trade Deficit
by Calculated Risk on 3/05/2025 07:45:00 PM
 Note: Mortgage rates are from MortgageNewsDaily.com and are for top tier scenarios.
Thursday:
• At 8:30 AM ET, The initial weekly unemployment claims report will be released. The consensus is for 234 initial claims down from 242 thousand last week.
• Also, at 8:30 AM, U.S. International Trade in Goods and Services for January from the Census Bureau. The consensus is for a record U.S. trade deficit of $128.3 billion from $98.4 billion in December. Many importers were racing to beat potential tariffs.
CoreLogic: Home Prices Increased 3.3% Year-over-year in January
by Calculated Risk on 3/05/2025 03:25:00 PM
Notes: This CoreLogic House Price Index report is for January. The recent Case-Shiller index release was for December. The CoreLogic HPI is a three-month weighted average and is not seasonally adjusted (NSA).
From CoreLogic: CoreLogic: Home Price Growth Largely Flat in January
U.S. home price growth in January 2025 was largely flat at 3.3% year over year. Although prices are expected to eek out gains in the coming year, with our economists predicting a 3.6% increase from January 2025 to January 2026, there are stark differences between regions.This was the smaller YoY increase as reported for December.
The Northeast continues to buck overall national trends, remaining unbothered by slower job growth, elevated interest rates, and ongoing affordability concerns. Meanwhile, in the Mountain West, prices are the furthest from their record highs. In Hawaii, prices declined by 4.4%.
Despite this, national single-family home prices are forecast to reach a new peak in March 2025. Currently, the median sales price for all single-family homes in the U.S. is $375,000.
“Flattening home price changes over the last six months suggest further price deceleration is ahead,” said Dr. Selma Hepp, CoreLogic Chief Economist. “More importantly, compressed monthly changes highlight the general lack of home-buying demand that continues to characterize the current housing market. While this year's cold winter and large natural disasters play a role in dampening demand, falling consumer sentiment suggests potential homebuyers are wary of the short-term economic outlook and future inflation. Nevertheless, with the spring home buying season upon us, the recent improvements in mortgage rates may help invite homebuyers back into the market.”
emphasis added
This map is from the report.

• CoreLogic analysis suggests that Florida markets are continuing to fall out of favor while western New York is gaining popularity.
• Our economists anticipate further price deceleration in 2025, although recent improvements in mortgage rates may spur homebuying this spring.
• National home price growth is flat on a monthly basis. Annual home price growth is tracking just above inflation.
• Florida and Arizona top the charts for markets where the risk of price decline is very high.


