 RSS Feed
 by Calculated Risk on 12/13/2024 07:55:00 AM
Friday, December 13, 2024
Q4 GDP Tracking: 2.1% to 3.3% Range
From BofA:
Since our last weekly publication, our 3Q GDP tracking estimate has moved up a tenth to 3.0% q/q saar. Additionally, our 4Q US GDP tracker was unchanged at 2.1% q/q saar. [Dec 13th estimate]From Goldman:
emphasis added
We left our Q4 GDP tracking and domestic final sales estimates unchanged at +2.4% and +2.0%, respectively. [Dec 5th estimate]And from the Atlanta Fed: GDPNow
The GDPNow model estimate for real GDP growth (seasonally adjusted annual rate) in the fourth quarter of 2024 is 3.3 percent on December 5, up from 3.2 percent on December 2. After recent releases from the US Census Bureau, the Institute for Supply Management, and the US Bureau of Economic Analysis, the nowcast of fourth-quarter real gross private domestic investment growth increased from 1.2 percent to 1.8 percent. [Dec 5th estimate]
Thursday, December 12, 2024
Friday: No major economic releases scheduled
by Calculated Risk on 12/12/2024 09:52:00 PM
 Note: Mortgage rates are from MortgageNewsDaily.com and are for top tier scenarios.
Friday:
• No major economic releases scheduled.
Realtor.com Reports Active Inventory Up 23.5% YoY
by Calculated Risk on 12/12/2024 05:10:00 PM
What this means: On a weekly basis, Realtor.com reports the year-over-year change in active inventory and new listings. On a monthly basis, they report total inventory. For November, Realtor.com reported inventory was up 26.2% YoY, but still down 21.5% compared to the 2017 to 2019 same month levels.
Now - on a weekly basis - inventory is up 23.5% YoY.
Realtor.com has monthly and weekly data on the existing home market. Here is their weekly report: Weekly Housing Trends View—Data for Week Ending Dec. 7, 2024 Here is a graph of the year-over-year change in inventory according to realtor.com.
Inventory was up year-over-year for the 57th consecutive week.
Realtor.com has monthly and weekly data on the existing home market. Here is their weekly report: Weekly Housing Trends View—Data for Week Ending Dec. 7, 2024
• Active inventory increased, with for-sale homes 23.5% above year-ago levels
For the 57th consecutive week, the number of homes for sale has increased compared with the same time last year. However, this week’s growth was the slowest since March 2024. As the mortgage rates remain close to 7%, the combination of sluggish listing activity and muted buyer demand has led to a slowdown in inventory growth. The pace of growth suggests a more cautious environment where sellers are holding back, and buyers are taking their time—creating a more balanced but tentative housing landscape.
• New listings—a measure of sellers putting homes up for sale—increased 16.5% post-Thanksgiving, and adjusted to 2.6% after accounting for holiday timing
The number of newly listed homes has returned to its pre-Thanksgiving level, resulting in a large year-over-year growth as Thanksgiving falls later in 2024 compared with 2023. After adjusting for the holiday timing factor, the year-over-year increase in new listings is 2.6%.
 Here is a graph of the year-over-year change in inventory according to realtor.com.
 Inventory was up year-over-year for the 57th consecutive week.
However, inventory is still historically low.
New listings remain below typical pre-pandemic levels.
The "Home ATM" Mostly Closed in Q3
by Calculated Risk on 12/12/2024 01:05:00 PM
Today, in the Calculated Risk Real Estate Newsletter: The "Home ATM" Mostly Closed in Q3
A brief excerpt:
During the housing bubble, many homeowners borrowed heavily against their perceived home equity - jokingly calling it the “Home ATM” - and this contributed to the subsequent housing bust, since so many homeowners had negative equity in their homes when house prices declined.
...
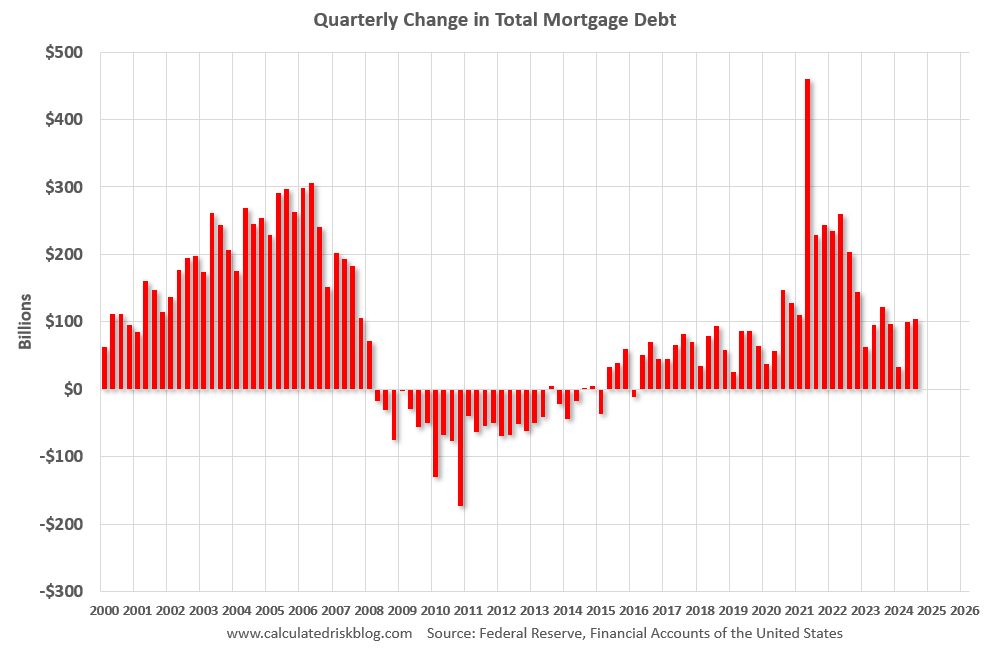
Here is the quarterly increase in mortgage debt from the Federal Reserve’s Financial Accounts of the United States - Z.1 (sometimes called the Flow of Funds report) released today. In the mid ‘00s, there was a large increase in mortgage debt associated with the housing bubble.
In Q3 2024, mortgage debt increased $105 billion, up from $99 billion in Q2, and down from the cycle peak of $467 billion in Q2 2021. Note the almost 7 years of declining mortgage debt as distressed sales (foreclosures and short sales) wiped out a significant amount of debt.
However, some of this debt is being used to increase the housing stock (purchase new homes), so this isn’t all Mortgage Equity Withdrawal (MEW).
Fed's Flow of Funds: Household Net Worth Increased $4.8 Trillion in Q3
by Calculated Risk on 12/12/2024 12:26:00 PM
The Federal Reserve released the Q3 2024 Flow of Funds report today: Financial Accounts of the United States.
The net worth of households and nonprofits rose to $168.8 trillion during the third quarter of 2024. The value of directly and indirectly held corporate equities increased $3.8 trillion and the value of real estate decreased $0.2 trillion..
...
Household debt increased 3 percent at an annual rate in the third quarter of 2024. Consumer credit grew at an annual rate of 2.5 percent, while mortgage debt (excluding charge-offs) grew at an annual rate of 3.1 percent.
 Click on graph for larger image.
The first graph shows Households and Nonprofit net worth as a percent of GDP.
Net worth increased $4.8 trillion in Q3 to an all-time high. As a percent of GDP, net worth increased in Q3 but is below the peak in 2021.
This includes real estate and financial assets (stocks, bonds, pension reserves, deposits, etc.) net of liabilities (mostly mortgages). Note that this does NOT include public debt obligations.
 The second graph shows homeowner percent equity since 1952.
Household percent equity (as measured by the Fed) collapsed when house prices fell sharply in 2007 and 2008.
In Q3 2024, household percent equity (of household real estate) was at 74.7% - down from 75.0% in Q2, 2024. This is close to the highest percent equity since the 1960s.
Note: This includes households with no mortgage debt.
 The third graph shows household real estate assets and mortgage debt as a percent of GDP.
Mortgage debt increased by $105 billion in Q3.
Mortgage debt is up $2.58 trillion from the peak during the housing bubble, but, as a percent of GDP is at 45.2% - down from Q2 - and down from a peak of 73.3% of GDP during the housing bust.
The value of real estate, as a percent of GDP, decreased in Q3 and is below the peak in Q2 2022, but is well above the median of the last 30 years.
 The second graph shows homeowner percent equity since 1952.
 Household percent equity (as measured by the Fed) collapsed when house prices fell sharply in 2007 and 2008.
In Q3 2024, household percent equity (of household real estate) was at 74.7% - down from 75.0% in Q2, 2024. This is close to the highest percent equity since the 1960s.
Note: This includes households with no mortgage debt.
 The third graph shows household real estate assets and mortgage debt as a percent of GDP.
 Mortgage debt increased by $105 billion in Q3.
Mortgage debt is up $2.58 trillion from the peak during the housing bubble, but, as a percent of GDP is at 45.2% - down from Q2 - and down from a peak of 73.3% of GDP during the housing bust.
The value of real estate, as a percent of GDP, decreased in Q3 and is below the peak in Q2 2022, but is well above the median of the last 30 years.
FDIC: Number of Problem Banks Increased Slightly in Q3 2024
by Calculated Risk on 12/12/2024 10:14:00 AM
The FDIC released the Quarterly Banking Profile for Q3 2024:
The Industry’s Net Income Decreased From the Prior Quarter, Driven by One-Time Items
Third quarter net income for the 4,517 FDIC-insured commercial banks and savings institutions decreased $6.2 billion (8.6 percent) from the prior quarter to $65.4 billion. The quarterly decrease in net income was largely driven by the absence of about $10 billion in one-time gains on equity security transactions reported in the previous quarter. The absence of these nonrecurring gains was partially offset by strong net interest income in the third quarter.
...
Asset Quality Metrics Remained Generally Favorable, Though Weakness in Certain Portfolios Persists
The past-due and nonaccrual (PDNA) loan ratio increased 6 basis points from the prior quarter to 1.54 percent. This ratio was 18 basis points higher than the year-earlier quarter but below the pre-pandemic average of 1.94 percent.2 Quarterly, banks reported an increase in the PDNA ratio in credit card loan portfolios (up 20 basis points to 3.36 percent), nonfarm nonresidential commercial real estate (CRE) loan portfolios (up 7 basis points to 1.69 percent), 1–4 family residential loan portfolios (up 3 basis points to 1.83 percent), and auto loan portfolios (up 5 basis points to 3.13 percent). Annually, the industry reported the largest PDNA increases in nonfarm nonresidential CRE loan portfolios (up 43 basis points to 1.69 percent), credit card loan portfolios (up 27 basis points to 3.36 percent), and commercial and industrial loan portfolios (up 20 basis points to 1.17 percent).
The industry’s net charge-off ratio decreased 1 basis point to 0.67 percent from the prior quarter but was 16 basis points higher than the year-earlier quarter. This ratio was also 19 basis points above the pre-pandemic average and remained the highest quarterly ratio reported by the industry since second quarter 2013. Credit card and nonfarm nonresidential CRE loan charge-offs drove the quarterly decrease in the net charge-off ratio, which was partially offset by an increase in commercial and industrial loan charge-offs. The credit card net charge-off ratio was 4.48 percent in the third quarter, down 34 basis points quarter over quarter but still 100 basis points higher than the pre-pandemic average. The net charge-off ratio for nonfarm nonresidential CRE loans decreased 9 basis points quarter over quarter to 0.29 percent but was 25 basis points higher than the pre-pandemic average.
emphasis added
 Click on graph for larger image.
From the FDIC:
The Number of Problem Banks IncreasedThis graph from the FDIC shows the number of problem banks.
The number of banks on the FDIC’s “Problem Bank List” increased from 66 to 68. Total assets held by problem banks rose $3.9 billion to $87.3 billion. Problem banks represent 1.5 percent of total banks, which is within the normal range of 1 to 2 percent of all banks during non-crisis periods.
Weekly Initial Unemployment Claims Increase to 242,000
by Calculated Risk on 12/12/2024 08:30:00 AM
The DOL reported:
In the week ending December 7, the advance figure for seasonally adjusted initial claims was 242,000, an increase of 17,000 from the previous week's revised level. The previous week's level was revised up by 1,000 from 224,000 to 225,000. The 4-week moving average was 224,250, an increase of 5,750 from the previous week's revised average. The previous week's average was revised up by 250 from 218,250 to 218,500.The following graph shows the 4-week moving average of weekly claims since 1971.
emphasis added
 Click on graph for larger image.
The dashed line on the graph is the current 4-week average. The four-week average of weekly unemployment claims increased to 224,250.
The previous week was revised up.
Weekly claims were above the consensus forecast.
Wednesday, December 11, 2024
Thursday: Unemployment Claims, PPI, Q3 Flow of Funds
by Calculated Risk on 12/11/2024 07:51:00 PM
 Note: Mortgage rates are from MortgageNewsDaily.com and are for top tier scenarios.
Thursday:
• At 8:30 AM ET, The initial weekly unemployment claims report will be released. The consensus is for 220 thousand initial claims, up from 213 thousand last week.
• Also at 8:30 AM, The Producer Price Index for November from the BLS. The consensus is for a 0.3% increase in PPI, and a 0.2% increase in core PPI.
• At 12:00 PM, Q3 Flow of Funds Accounts of the United States from the Federal Reserve.
2nd Look at Local Housing Markets in November
by Calculated Risk on 12/11/2024 01:49:00 PM
Today, in the Calculated Risk Real Estate Newsletter: 2nd Look at Local Housing Markets in November
A brief excerpt:
NOTE: The tables for active listings, new listings and closed sales all include a comparison to November 2019 for each local market (some 2019 data is not available).There is much more in the article.
This is the second look at local markets in November. I’m tracking over 40 local housing markets in the US. Some of the 40 markets are states, and some are metropolitan areas. I’ll update these tables throughout the month as additional data is released.
Closed sales in November were mostly for contracts signed in September and October when 30-year mortgage rates averaged 6.18% and 6.43%, respectively (Freddie Mac PMMS). These were the lowest mortgage rates in 2 years!
...
Here is a look at months-of-supply using NSA sales. Note the regional differences, especially in Florida and Texas (although November statistics in Florida were likely still impacted by Hurricane Milton).
...
Many more local markets to come!

Cleveland Fed: Median CPI increased 0.2% and Trimmed-mean CPI increased 0.3% in November
by Calculated Risk on 12/11/2024 11:30:00 AM
The Cleveland Fed released the median CPI and the trimmed-mean CPI.
According to the Federal Reserve Bank of Cleveland, the median Consumer Price Index rose 0.2% in November. The 16% trimmed-mean Consumer Price Index increased 0.3%. "The median CPI and 16% trimmed-mean CPI are measures of core inflation calculated by the Federal Reserve Bank of Cleveland based on data released in the Bureau of Labor Statistics’ (BLS) monthly CPI report".
 Click on graph for larger image.
This graph shows the year-over-year change for these four key measures of inflation.
On a year-over-year basis, the median CPI rose 3.9% (down from 4.1% in October), the trimmed-mean CPI rose 3.2% (unchanged from 3.2%), and the CPI less food and energy rose 3.3% (unchanged from 3.3%).
Core PCE is for October was up 2.8% YoY, up from 2.7% in September.


