 RSS Feed
 by Calculated Risk on 5/22/2024 01:13:00 PM
Wednesday, May 22, 2024
NAR: Existing-Home Sales Decreased to 4.14 million SAAR in April; Median House Prices Increased 5.7% Year-over-Year
Today, in the CalculatedRisk Real Estate Newsletter: NAR: Existing-Home Sales Decreased to 4.14 million SAAR in April
Excerpt:
Sales Year-over-Year and Not Seasonally Adjusted (NSA)There is much more in the article.
The fourth graph shows existing home sales by month for 2023 and 2024.
Sales declined 1.9% year-over-year compared to March 2023. This was the thirty-second consecutive month with sales down year-over-year.

NAR: Existing-Home Sales Decreased to 4.14 million SAAR in April
by Calculated Risk on 5/22/2024 10:00:00 AM
From the NAR: Existing-Home Sales Retreated 1.9% in April
Existing-home sales receded in April, according to the National Association of REALTORS®. All four major U.S. regions posted month-over-month declines. Year-over-year, sales decreased in the Northeast, Midwest and South but increased in the West.
Total existing-home sales – completed transactions that include single-family homes, townhomes, condominiums and co-ops – slid 1.9% from March to a seasonally adjusted annual rate of 4.14 million in April. Year-over-year, sales fell 1.9% (down from 4.22 million in April 2023).
...
Total housing inventory registered at the end of April was 1.21 million units, up 9% from March and 16.3% from one year ago (1.04 million). Unsold inventory sits at a 3.5-month supply at the current sales pace, up from 3.2 months in March and 3.0 months in April 2023.
emphasis added
 Click on graph for larger image.
This graph shows existing home sales, on a Seasonally Adjusted Annual Rate (SAAR) basis since 1994.
Sales in April (4.14 million SAAR) were down 1.9% from the previous month and were 1.9% below the April 2023 sales rate.
The second graph shows nationwide inventory for existing homes.
 According to the NAR, inventory increased to 1.21 million in April from 1.11 million the previous month.
 According to the NAR, inventory increased to 1.21 million in April from 1.11 million the previous month.
Headline inventory is not seasonally adjusted, and inventory usually decreases to the seasonal lows in December and January, and peaks in mid-to-late summer.
The last graph shows the year-over-year (YoY) change in reported existing home inventory and months-of-supply. Since inventory is not seasonally adjusted, it really helps to look at the YoY change. Note: Months-of-supply is based on the seasonally adjusted sales and not seasonally adjusted inventory.
 Inventory was up 16.3% year-over-year (blue) in April compared to April 2023.
Months of supply (red) increased to 3.5 months in April from 3.2 months the previous month.
This was below the consensus forecast. I'll have more later.
The last graph shows the year-over-year (YoY) change in reported existing home inventory and months-of-supply. Since inventory is not seasonally adjusted, it really helps to look at the YoY change. Note: Months-of-supply is based on the seasonally adjusted sales and not seasonally adjusted inventory.
 Inventory was up 16.3% year-over-year (blue) in April compared to April 2023.
 Months of supply (red) increased to 3.5 months in April from 3.2 months the previous month.
This was below the consensus forecast. I'll have more later.
MBA: Mortgage Applications Increased in Weekly Survey
by Calculated Risk on 5/22/2024 07:00:00 AM
From the MBA: Mortgage Applications Increase in Latest MBA Weekly Survey
Mortgage applications increased 1.9 percent from one week earlier, according to data from the Mortgage Bankers Association’s (MBA) Weekly Mortgage Applications Survey for the week ending May 17, 2024.
The Market Composite Index, a measure of mortgage loan application volume, increased 1.9 percent on a seasonally adjusted basis from one week earlier. On an unadjusted basis, the Index increased 1.1 percent compared with the previous week. The Refinance Index increased 7 percent from the previous week and was 21 percent higher than the same week one year ago. The seasonally adjusted Purchase Index decreased 1 percent from one week earlier. The unadjusted Purchase Index decreased 2 percent compared with the previous week and was 11 percent lower than the same week one year ago.
“The 30-year fixed mortgage rate declined for the third straight week, dropping to 7.01 percent – the lowest level in seven weeks,” said Joel Kan, MBA’s Vice President and Deputy Chief Economist. “Rates coming down from recent highs spurred some borrowers to act, with increases across both conventional and government refinance applications. VA refinances had a double-digit increase for the third consecutive week, although the current level of refinancing is still well below its historical average. Purchase activity continues to lag despite this recent decline in rates, down 11 percent from a year ago, as potential buyers still face limited for-sale inventory and high list prices.”
...
The average contract interest rate for 30-year fixed-rate mortgages with conforming loan balances ($766,550 or less) decreased to 7.01 percent from 7.08 percent, with points decreasing to 0.60 from 0.63 (including the origination fee) for 80 percent loan-to-value ratio (LTV) loans.
emphasis added
 Click on graph for larger image.
The first graph shows the MBA mortgage purchase index.
According to the MBA, purchase activity is down 11% year-over-year unadjusted.
Red is a four-week average (blue is weekly).
Purchase application activity is up slightly from the lows in late October 2023, and below the lowest levels during the housing bust.

The second graph shows the refinance index since 1990.
With higher mortgage rates, the refinance index declined sharply in 2022, and mostly flat lined since then with a slight increase recently.
Tuesday, May 21, 2024
Wednesday: Existing Home Sales, FOMC Minutes, Architecture Billings Index
by Calculated Risk on 5/21/2024 07:22:00 PM
 Note: Mortgage rates are from MortgageNewsDaily.com and are for top tier scenarios.
Wednesday:
• At 7:00 AM ET, The Mortgage Bankers Association (MBA) will release the results for the mortgage purchase applications index.
• At 10:00 AM, Existing Home Sales for April from the National Association of Realtors (NAR). The consensus is for 4.18 million SAAR, down from 4.19 million. Housing economist Tom Lawler expects the NAR to report sales of 4.23 million SAAR.
• During the day, The AIA's Architecture Billings Index for April (a leading indicator for commercial real estate).
• At 2:00 PM, FOMC Minutes, Minutes Meeting of April 30-May 1, 2024
LA Port Traffic Increased Year-over-year in April
by Calculated Risk on 5/21/2024 01:00:00 PM
Container traffic gives us an idea about the volume of goods being exported and imported - and usually some hints about the trade report since LA area ports handle about 40% of the nation's container port traffic.
The following graphs are for inbound and outbound traffic at the ports of Los Angeles and Long Beach in TEUs (TEUs: 20-foot equivalent units or 20-foot-long cargo container).
To remove the strong seasonal component for inbound traffic, the first graph shows the rolling 12-month average.
 Click on graph for larger image.
On a rolling 12-month basis, inbound traffic increased 1.4% in April compared to the rolling 12 months ending in March. Outbound traffic increased 0.8% compared to the rolling 12 months ending the previous month.
The 2nd graph is the monthly data (with a strong seasonal pattern for imports).
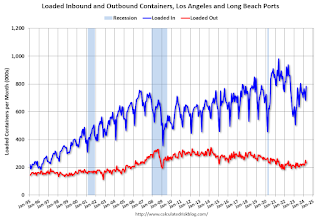 Usually imports peak in the July to October period as retailers import goods for the Christmas holiday, and then decline sharply and bottom in the Winter depending on the timing of the Chinese New Year.
 Usually imports peak in the July to October period as retailers import goods for the Christmas holiday, and then decline sharply and bottom in the Winter depending on the timing of the Chinese New Year.
 Imports were up 16% YoY in April, and exports were up 10% YoY.
In general, it appears port traffic is returning to the pre-pandemic patterns.
Single Family Built-for-Rent Up 20% Year-over-year in Q1
by Calculated Risk on 5/21/2024 09:45:00 AM
Today, in the Calculated Risk Real Estate Newsletter: Single Family Built-for-Rent Up 20% Year-over-year in Q1
A brief excerpt:
Along with the monthly housing starts report for April released last week, the Census Bureau also released Housing Units Started by Purpose and Design through Q1 2024.There is much more in the article.
The first graph shows the number of single family and multi-family units started with the intent to rent. This data is quarterly and Not Seasonally Adjusted (NSA). Although the majority of units built-for-rent’ are still multi-family (blue), there has been a significant pickup in single family units started built-for-rent (red).
In 2020, there were 44,000 single family units started with the intent to rent. In 2023, that number almost doubled to 85,000 units. There were 18,000 single family units started in Q1 2024 built-for-rent, up 20% from 15,000 in Q1 2023.
For multi-family, there were 56,000 units started to rent in Q1 2024, down almost 50% from 108,000 in Q1 2023.

What Happened to "Paying off the National Debt"?
by Calculated Risk on 5/21/2024 08:20:00 AM
We are seeing scary articles about the debt again. It is worth remembering that at the turn of the millennium, the concern was that the US was paying off the debt too quickly!
Here are a few excerpts from a speech by then Fed Chair Alan Greenspan in April 2001: The paydown of federal debt
"Today I want to address a subject in which your group and the Federal Reserve share a keen interest--the paydown of the federal debt and its implications for the economy and financial markets. While the magnitudes of future federal unified budget surpluses are uncertain, they are highly likely to remain sizable for some time. ...What went wrong over the last 20+ years?
[C]urrent forecasts suggest that under a reasonably wide variety of possible tax and spending policies, the resulting surpluses will allow the Treasury debt held by the public to be paid off. Moreover, well before the debt is eliminated--indeed, possibly within a relatively few years--it may become difficult to further reduce outstanding debt to the public because the remaining obligations will mostly consist of savings bonds, well-entrenched holdings of long-term marketable debt, and perhaps other types of debt that could prove difficult to reduce."
Here is a list of events and policy choices that significantly increased the debt after 2000:
1) The 2000 projections were overly optimistic.
2) The 2001 recession.
3) The 2001 and 2003 Bush Tax Cuts.
4) 9/11, Homeland Security Spending and the War in Afghanistan
5) The War in Iraq
6) The Finacial Crisis and Great Recession
7) The Trump Tax Cuts
8) The Pandemic.
Here is a brief discussion ... (books have been written on each of these topics):
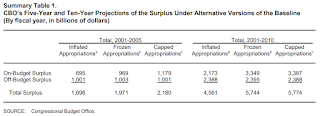
1) Overly Optimistic Projections: Here are the CBO projections from July 2000: The Budget and Economic Outlook: An Update
 Click on graph for larger image.
The CBO projections showed an almost $6 Trillion in debt reduction in the 2001 through 2010 period.
I argued in 2000 that these projections ignored possible negative events such as an investment led recession due to the bursting of stock bubble. These projections were clearly overly optimistic.
2) The 2001 Recession: Although Greenspan mentioned "the current slowdown in economic activity" in his April 2001 speech, he didn't realize the economy was already in a recession. From the May 2000 FOMC minutes:
3) Bush Tax Cuts: These tax cuts were sold as slowing the growth of the surpluses (using Greenspan's speech for cover)! Instead, the tax cuts (mostly for the wealthy) turned the surpluses into deficits and reduced revenue by $1.5 trillion or more over the 2001 - 2010 period.
 There were various Inspector General reports that the Fed and FDIC field examiners were expressing significant concerns in 2003 and 2004, but Greenspan was blocking all efforts to tighten standards - and the Bush Administratio was loosening bank regulations!
This photo shows John Reich (then Vice Chairman of the FDIC and later at the OTS) and James Gilleran of the Office of Thrift Supervision (with the chainsaw) and representatives of three banker trade associations: James McLaughlin of the American Bankers Association, Harry Doherty of America's Community Bankers, and Ken Guenther of the Independent Community Bankers of America.
1) Overly Optimistic Projections: Here are the CBO projections from July 2000: The Budget and Economic Outlook: An Update
 Click on graph for larger image.
The CBO projections showed an almost $6 Trillion in debt reduction in the 2001 through 2010 period.
I argued in 2000 that these projections ignored possible negative events such as an investment led recession due to the bursting of stock bubble. These projections were clearly overly optimistic.
2) The 2001 Recession: Although Greenspan mentioned "the current slowdown in economic activity" in his April 2001 speech, he didn't realize the economy was already in a recession. From the May 2000 FOMC minutes:
"The information reviewed at this meeting suggested that economic growth had remained rapid through early spring."The economy was already in a recession!
3) Bush Tax Cuts: These tax cuts were sold as slowing the growth of the surpluses (using Greenspan's speech for cover)! Instead, the tax cuts (mostly for the wealthy) turned the surpluses into deficits and reduced revenue by $1.5 trillion or more over the 2001 - 2010 period.
4) 9/11, Homeland Security Spending and the War in Afghanistan: The 9/11/2001 attacks led to a sharp increase in homeland security spending and the War in Afghanistan.
5) The War in Iraq: The Bush administration argued the war would cost around $80 billion. VP Dick Cheney said on Meet the Press: "every analysis said this war itself would cost about $80 billion". Instead, the war cost well over $1 trillion (and countless lives were lost). Note: Years ago, I mentioned on this blog that "I opposed the Iraq war and was shouted down and called names like "Saddam lover" for questioning the veracity of the information."
6) The Financial Crisis and Great Recession. This was the worst US recession since the Great Depression. This led to the first $1 trillion annual budget deficit in US history and dramatically increased the national debt. The causes of the bubble were rapid changes in the mortgage lending industry, rating agencies that didn't account for those changes, combined with a lack of regulatory oversight. I was talking with field regulators in 2005 and 2006, and they were all terrified. I was told the appointees at the top of the agencies were blocking any effort to tighten standards.
 There were various Inspector General reports that the Fed and FDIC field examiners were expressing significant concerns in 2003 and 2004, but Greenspan was blocking all efforts to tighten standards - and the Bush Administratio was loosening bank regulations!
This photo shows John Reich (then Vice Chairman of the FDIC and later at the OTS) and James Gilleran of the Office of Thrift Supervision (with the chainsaw) and representatives of three banker trade associations: James McLaughlin of the American Bankers Association, Harry Doherty of America's Community Bankers, and Ken Guenther of the Independent Community Bankers of America.
7) The Trump Tax Cuts: These tax cuts - mostly for the wealthy - were sold with several promises - all failed. See: The Failed Promises of the 2017 Tax Cuts and Jobs Act (TCJA). A couple of quotes:
8) The Pandemic: Deficit spending increased sharply due to the pandemic.
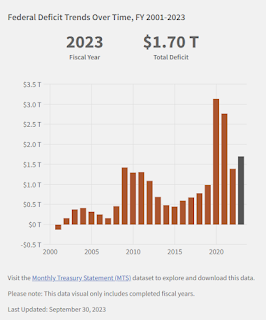 Here is a graph of the actual annual deficits since 2000.
Note: This is not adjusted for the growth of the economy.
So, what happened to "paying off the debt"? A series of adverse events (9/11, pandemic), and poor policy choices.
Note that all the "poor policy choices" were by Republicans including tax cuts, the Iraq War, and failure to properly regulate prior to the great recession.
“Not only will this tax plan pay for itself, but it will pay down debt,” Treasury Secretary Steve Mnuchin, Sept 2017Complete nonsense.
“I think this tax bill is going to reduce the size of our deficits going forward,” Sen. Pat Toomey (R-PA), November 2017
8) The Pandemic: Deficit spending increased sharply due to the pandemic.
 Here is a graph of the actual annual deficits since 2000.
Note: This is not adjusted for the growth of the economy.
So, what happened to "paying off the debt"? A series of adverse events (9/11, pandemic), and poor policy choices.
Note that all the "poor policy choices" were by Republicans including tax cuts, the Iraq War, and failure to properly regulate prior to the great recession.
We cannot always avoid adverse events like 9/11 and the pandemic, but I opposed each of these poor policy choices as they happened - so these are clearly avoidable.
Those scary stories? They seem to ignore history.
Monday, May 20, 2024
"Mortgage Rates Close Enough to Unchanged Over The Weekend"
by Calculated Risk on 5/20/2024 08:05:00 PM
 From Matthew Graham at Mortgage News Daily: Mortgage Rates Close Enough to Unchanged Over The Weekend
Technically, today's average mortgage rates are higher for a third straight business day, but most prospective borrowers won't even notice. For many lenders, the changes are so small that the average borrower won't see any change from scenarios quoted on Friday afternoon. In cases where there is a difference, that difference would be very small. [30 year fixed 7.10%]Tuesday:
emphasis added
• No major economic releases scheduled.
MBA Survey: Share of Mortgage Loans in Forbearance Remains at 0.22% in April
by Calculated Risk on 5/20/2024 04:17:00 PM
From the MBA: Share of Mortgage Loans in Forbearance Remains at 0.22% in April
he Mortgage Bankers Association’s (MBA) monthly Loan Monitoring Survey revealed that the total number of loans now in forbearance remained unchanged at 0.22% as of April 30, 2024. According to MBA’s estimate, 110,000 homeowners are in forbearance plans. Mortgage servicers have provided forbearance to approximately 8.1 million borrowers since March 2020.At the end of April, there were about 110,000 homeowners in forbearance plans.
In April 2024, the share of Fannie Mae and Freddie Mac loans in forbearance declined 1 basis point to 0.11%. Ginnie Mae loans in forbearance dropped 1 basis point to 0.39%, and the forbearance share for portfolio loans and private-label securities (PLS) stayed the same at 0.31%.
“The number of loans in forbearance has remained stagnant for the first four months of 2024,” said Marina Walsh, CMB, MBA’s Vice President of Industry Analysis. “While forbearance is still a viable option for homeowners needing temporary mortgage payment relief, its usage has diminished without a major natural disaster or labor market downturn. Moreover, the performance of servicing portfolios and post-forbearance workouts remains strong, despite some fluctuations from month-to-month.”
emphasis added
4th Look at Local Housing Markets in April; California Home Sales Up 4.4% YoY in April
by Calculated Risk on 5/20/2024 12:00:00 PM
Today, in the Calculated Risk Real Estate Newsletter: 4th Look at Local Housing Markets in April; California Home Sales Up 4.4% YoY in April
A brief excerpt:
The NAR is scheduled to release April existing home sales on Wednesday, May 22nd. The consensus is for 4.18 million SAAR, down from 4.19 million in March.There is much more in the article.
Housing economist Tom Lawler expects the NAR to report sales of 4.23 million SAAR for April.
The NAR reported sales of 4.22 million SAAR in April 2023. If sales increased YoY in April, this will be the first YoY increase since August 2021, following 31 consecutive months with a YoY decline in sales.
...
And a table of March sales.
In April, sales in these markets were up 7.1% YoY. In March, these same markets were down 9.7% year-over-year Not Seasonally Adjusted (NSA).
Sales in most of these markets are down compared to January 2019. Sales in Grand Rapids and Nashville are up compared to 2019.
This is a year-over-year increase NSA for these markets. However, there were two more working days in April 2024 compared to April 2023, so sales Seasonally Adjusted will be lower year-over-year than Not Seasonally Adjusted sales.
More local markets will release data after the NAR release on Wednesday!


