 RSS Feed
 by Calculated Risk on 12/29/2022 08:44:00 PM
Thursday, December 29, 2022
Hotels: Occupancy Rate Down 9.7% Compared to Same Week in 2019
U.S. hotel performance came in lower than the previous week and showed weakened comparisons to 2019 on the unfavorable side of a holiday calendar shift, according to STR‘s latest data through Dec. 24. At the same time, occupancy on the 24th was the highest for any Christmas Eve on record.The following graph shows the seasonal pattern for the hotel occupancy rate using the four-week average.
Dec. 18-24, 2022 (percentage change from comparable week in 2019*):
• Occupancy: 43.9% (-9.7%)
• Average daily rate (ADR): $132.29 (+2.3%)
• Revenue per available room (RevPAR): $58.04 (-7.6%)
*Due to the pandemic impact, STR is measuring recovery against comparable time periods from 2019.
emphasis added
 Click on graph for larger image.
The red line is for 2022, black is 2020, blue is the median, and dashed light blue is for 2021. Dashed purple is 2019 (STR is comparing to a strong year for hotels).
The 4-week average of the occupancy rate is above the median rate for the previous 20 years (Blue) and close to 2019 levels.
Note: Y-axis doesn't start at zero to better show the seasonal change.
The 4-week average of the occupancy rate will start increasing early in 2023.
Las Vegas November 2022: Visitor Traffic Down 7.0% Compared to 2019; Convention Traffic Down 3.4%
by Calculated Risk on 12/29/2022 02:00:00 PM
Note: I like using Las Vegas as a measure of recovery for both leisure (visitors) and business (conventions).
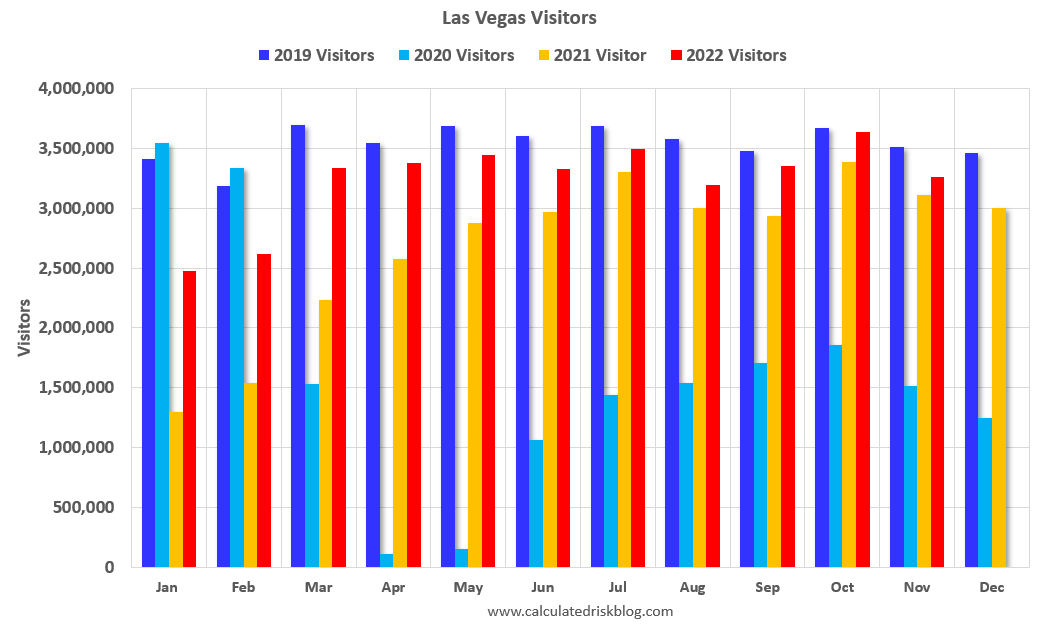
From the Las Vegas Visitor Authority: November 2022 Las Vegas Visitor Statistics
Even with typical late fall/early winter seasonal volume decreases kicking in after a stellar October, November 2022 saw visitation of approx. 3.27M, about 5% ahead of last November and ‐7% shy of November 2019 tallies, supported by a variety of events including the Automotive After Market Week and the Raiders vs. Colts home game.
Overall hotel occupancy reached 81.2% (+3.6 pts YoY and down ‐7.0 pts vs. Nov 2019). Weekend occupancy came in at 89.6% (‐1.1 pts of last November and ‐4.5 pts below November 2019), while Midweek occupancy reached 77.5%, up 5.6 pts vs. last November but down ‐7.3 pts vs. November 2019's tally.
The trend of strong room rates continued during the month as ADR approached $187, up roughly 20% YoY and +38% ahead of November 2019 while RevPAR surpassed $151 for the month, +25% YoY and +27% over November 2019.
 Click on graph for larger image.
 The first graph shows visitor traffic for 2019 (dark blue), 2020 (light blue), 2021 (yellow) and 2022 (red)
Visitor traffic was down 7.0% compared to the same month in 2019.
Visitor traffic was up 4.9% compared to last November.
The second graph shows convention traffic.

Convention traffic was down 3.4% compared to November 2019.The second graph shows convention traffic.
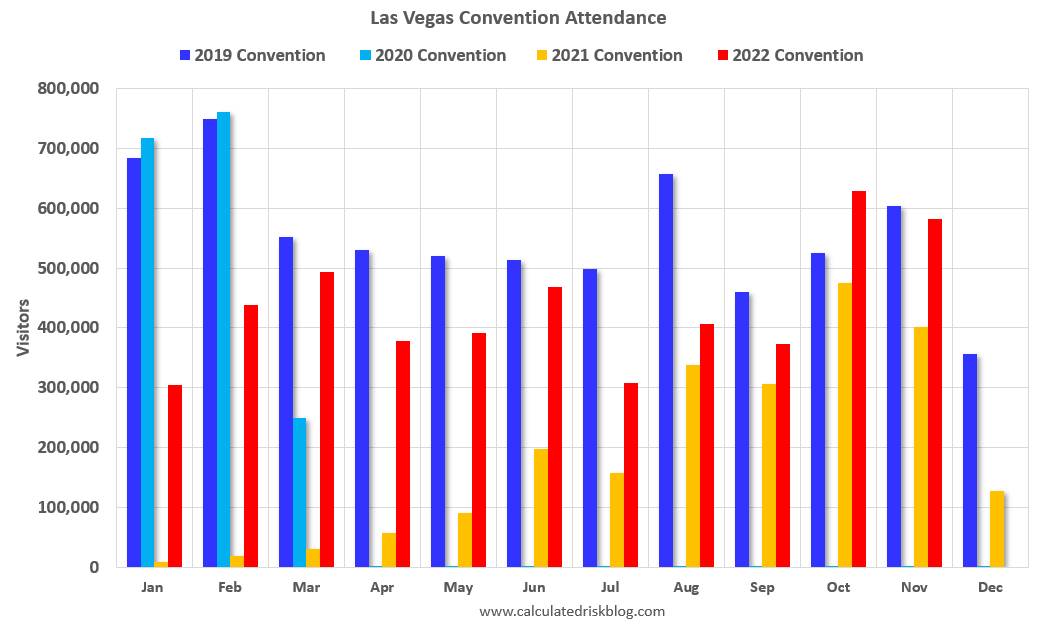
Note: There was almost no convention traffic from April 2020 through May 2021.
Philly Fed: State Coincident Indexes Increased in 30 States in November
by Calculated Risk on 12/29/2022 12:54:00 PM
From the Philly Fed:
The Federal Reserve Bank of Philadelphia has released the coincident indexes for the 50 states for November 2022. Over the past three months, the indexes increased in 35 states, decreased in 11 states, and remained stable in four, for a three-month diffusion index of 48. Additionally, in the past month, the indexes increased in 30 states, decreased in 13 states, and remained stable in seven, for a one-month diffusion index of 34.Note: These are coincident indexes constructed from state employment data. An explanation from the Philly Fed:
emphasis added
The coincident indexes combine four state-level indicators to summarize current economic conditions in a single statistic. The four state-level variables in each coincident index are nonfarm payroll employment, average hours worked in manufacturing by production workers, the unemployment rate, and wage and salary disbursements deflated by the consumer price index (U.S. city average). The trend for each state’s index is set to the trend of its gross domestic product (GDP), so long-term growth in the state’s index matches long-term growth in its GDP.
 Click on map for larger image.
Here is a map of the three-month change in the Philly Fed state coincident indicators. This map was all red during the worst of the Pandemic and also at the worst of the Great Recession.
The map is mostly positive on a three-month basis.
Source: Philly Fed.
 And here is a graph is of the number of states with one month increasing activity according to the Philly Fed.
 This graph includes states with minor increases (the Philly Fed lists as unchanged).
In November, 34 states had increasing activity including minor increases.
In November, 34 states had increasing activity including minor increases.
Inflation Adjusted House Prices 3.8% Below Peak
by Calculated Risk on 12/29/2022 10:14:00 AM
Today, in the Calculated Risk Real Estate Newsletter: Inflation Adjusted House Prices 3.8% Below Peak; Houses are the least “affordable” since 1982 when 30-year mortgage rates were over 14%
Excerpt:
It has been over 16 years since the bubble peak. In the October Case-Shiller released Tuesday, the seasonally adjusted National Index (SA), was reported as being 62% above the bubble peak in 2006. However, in real terms, the National index (SA) is about 12% above the bubble peak (and historically there has been an upward slope to real house prices). The composite 20, in real terms, is about 2% above the bubble peak.
Both indexes have declined for five consecutive months in real terms (inflation adjusted).
People usually graph nominal house prices, but it is also important to look at prices in real terms. As an example, if a house price was $200,000 in January 2000, the price would be almost $339,000 today adjusted for inflation (69.5% increase). That is why the second graph below is important - this shows "real" prices. ...
The second graph shows the same two indexes in real terms (adjusted for inflation using CPI less Shelter). Note: some people use other inflation measures to adjust for real prices. In real terms, the National index is 3.8% below the recent peak, and the Composite 20 index is 5.1% below the recent peak in 2022.
In real terms, house prices are still above the bubble peak levels. There is an upward slope to real house prices, and it has been over 16 years since the previous peak, but real prices are historically high.

There is much more in the article. You can subscribe at https://calculatedrisk.substack.com/
Weekly Initial Unemployment Claims increase to 225,000
by Calculated Risk on 12/29/2022 08:34:00 AM
The DOL reported:
In the week ending December 24, the advance figure for seasonally adjusted initial claims was 225,000, an increase of 9,000 from the previous week's unrevised level of 216,000. The 4-week moving average was 221,000, a decrease of 250 from the previous week's revised average. The previous week's average was revised down by 500 from 221,750 to 221,250.The following graph shows the 4-week moving average of weekly claims since 1971.
emphasis added
 Click on graph for larger image.
The dashed line on the graph is the current 4-week average. The four-week average of weekly unemployment claims decreased to 221,000.
The previous week was unrevised.
Weekly claims were close to the consensus forecast.
Wednesday, December 28, 2022
Fannie Mae: Mortgage Serious Delinquency Rate Decreased in November
by Calculated Risk on 12/28/2022 04:41:00 PM
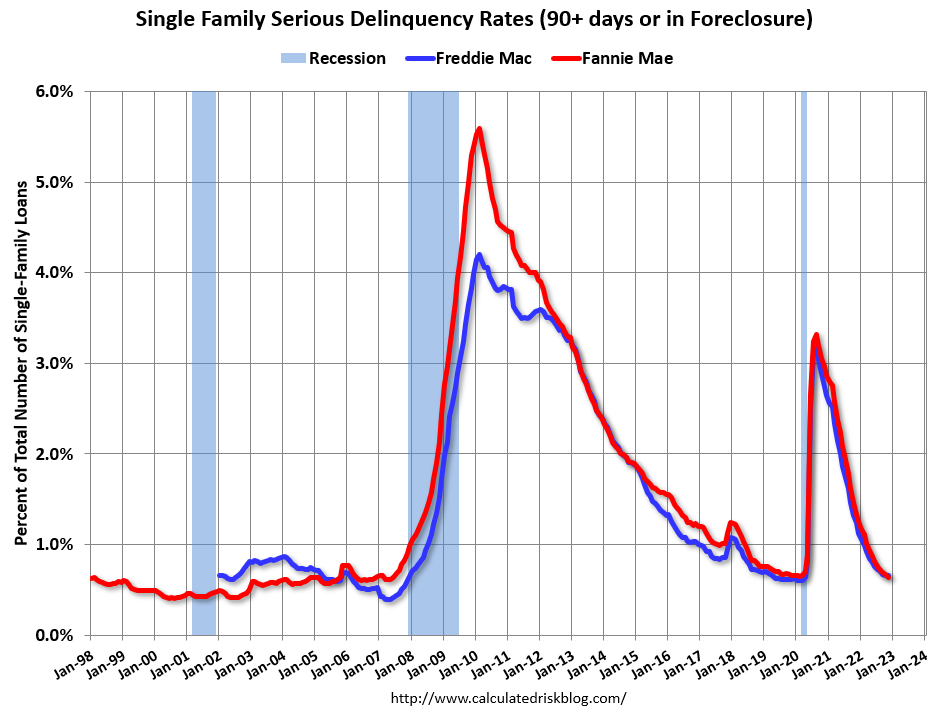
Fannie Mae reported that the Single-Family Serious Delinquency decreased to 0.64% in November from 0.67% in October. The serious delinquency rate is down from 1.33% in November 2021. This is slightly below the pre-pandemic lows.
These are mortgage loans that are "three monthly payments or more past due or in foreclosure".
The Fannie Mae serious delinquency rate peaked in February 2010 at 5.59% following the housing bubble and peaked at 3.32% in August 2020 during the pandemic.
 Click on graph for larger image
By vintage, for loans made in 2004 or earlier (1% of portfolio), 2.15% are seriously delinquent (down from 2.34% in October).
For loans made in 2005 through 2008 (1% of portfolio), 3.49% are seriously delinquent (down from 3.71%),
For recent loans, originated in 2009 through 2021 (98% of portfolio), 0.52% are seriously delinquent (down from 0.53%). So, Fannie is still working through a handful of poor performing loans from the bubble years.
Mortgages in forbearance were counted as delinquent in this monthly report, but they were not reported to the credit bureaus.
Freddie Mac reported earlier.
Mortgages in forbearance were counted as delinquent in this monthly report, but they were not reported to the credit bureaus.
Freddie Mac reported earlier.
Ten Economic Questions for 2023
by Calculated Risk on 12/28/2022 01:41:00 PM
Here is a review of the Ten Economic Questions for 2022
Below are my ten questions for 2023 (I've been doing this every year for over a decade!). These are just questions; I'll follow up with some thoughts on each of these questions.
The purpose of these questions is to provide a framework to think about how the U.S. economy will perform in 2023, and if there are surprises - like in 2020 - to adjust my thinking.
1) Economic growth: Economic growth was probably under 1% in 2022 as the economy slowed following the economic rebound in 2021. The FOMC is expecting growth of just 0.4% to 1.0% Q4-over-Q4 in 2023. How much will the economy grow in 2023? Will there be a recession in 2023?
2) Employment: Through November 2022, the economy added 4.3 million jobs in 2022. This makes 2022 the second-best year for job growth in US history, only behind the 6.7 million jobs added in 2021. How much will job growth slow in 2023? Or will the economy lose jobs?
3) Unemployment Rate: The unemployment rate was at 3.7% in November, down 0.5 percentage points year-over-year. Currently the FOMC is forecasting the unemployment rate will increase to the 4.4% to 4.7% range in Q4 2023. What will the unemployment rate be in December 2023?
4) Participation Rate: In November 2022, the overall participation rate was at 62.1%, up year-over-year from 61.9% in November 2021, but still below the pre-pandemic level of 63.4%. Long term, the BLS is projecting the overall participation rate will decline to 60.1% by 2031 due to demographics. What will the participation rate be in December 2023?
5) Inflation: Core PCE was up 4.7% YoY through November. This was down from a peak of 5.4% in early 2022. The FOMC is forecasting the YoY change in core PCE will be in the 3.2% to 3.7% range in Q4 2023. Will the core inflation rate decrease in 2023, and what will the YoY core inflation rate be in December 2023?
6) Monetary Policy: In response to the increase in inflation, the FOMC raised the federal funds rate from "0 to 1/4 percent" in January 2022, to "4-1/4 to 4-1/2 percent" in December. A majority of FOMC participants expect three or even four 25 bp rate hikes in 2023. What will the Fed Funds rate be in December 2023?
7) Wage Growth: Wage growth was strong in 2022 (up 5.1% year-over-year as of November). How much will wages increase in 2023?
8) Residential Investment: Residential investment (RI) was a drag on growth in 2022 as the housing market slowed sharply. Through November, starts were down 1.2% year-to-date compared to the same period in 2021. New home sales were down 15.2% year-to-date through November. Note: RI is mostly investment in new single-family structures, multifamily structures, home improvement and commissions on existing home sales. How much will RI change in 2023? How about housing starts and new home sales in 2023?
9) House Prices: It appears house prices - as measured by the national repeat sales index (Case-Shiller, FHFA, and CoreLogic) - will be up around 7% in 2022. What will happen with house prices in 2023?
10) Housing Inventory: Housing inventory decreased sharply during the pandemic to record lows in early 2022. Since then, inventory has increased, but is still well below pre-pandemic levels. Will inventory increase further in 2023?
NAR: Pending Home Sales Decreased 4.0% in November, Year-over-year Down 37.8%
by Calculated Risk on 12/28/2022 10:12:00 AM
From the NAR: Pending Home Sales Slid 4.0% in November
Pending home sales slid for the sixth consecutive month in November, according to the National Association of REALTORS®. All four U.S. regions recorded month-over-month decreases, and all four regions saw year-over-year declines in transactions.This was much larger than the expected decline for this index. Note: Contract signings usually lead sales by about 45 to 60 days, so this would usually be for closed sales in December and January.
"Pending home sales recorded the second-lowest monthly reading in 20 years as interest rates, which climbed at one of the fastest paces on record this year, drastically cut into the number of contract signings to buy a home," said NAR Chief Economist Lawrence Yun. "Falling home sales and construction have hurt broader economic activity."
The Pending Home Sales Index (PHSI)* — a forward-looking indicator of home sales based on contract signings — fell 4.0% to 73.9 in November. Year-over-year, pending transactions dropped by 37.8%. An index of 100 is equal to the level of contract activity in 2001.
...
The Northeast PHSI slipped 7.9% from last month to 63.3, a drop of 34.9% from November 2021. The Midwest index decreased 6.6% to 77.8 in November, a fall of 31.6% from one year ago.
The South PHSI retracted 2.3% to 88.5 in November, fading 38.5% from the prior year. The West index dropped by 0.9% in November to 55.1, retreating 45.7% from November 2021.
emphasis added
Final Look at Local Housing Markets in November
by Calculated Risk on 12/28/2022 08:40:00 AM
Today, in the Calculated Risk Real Estate Newsletter: Final Look at Local Housing Markets in November
A brief excerpt:
The big story for November existing home sales was the sharp year-over-year (YoY) decline in sales. Another key story was that new listings were down further YoY in November as many potential sellers are locked into their current home (low mortgage rate). And active inventory increased sharply YoY.There is much more in the article. You can subscribe at https://calculatedrisk.substack.com/
This is the final look at local markets in November. I’m tracking about 35 local housing markets in the US. Some of the 35 markets are states, and some are metropolitan areas. I update these tables throughout each month as additional data is released.
NOTE: I’ll be adding several more markets next month!
First, here is a table comparing the year-over-year Not Seasonally Adjusted (NSA) declines in sales this year from the National Association of Realtors® (NAR) with the local markets I track. So far, these measures have tracked closely. The NAR reported sales were down 35.2% NSA YoY in November.
...
More local data coming in January for activity in December!
My early expectation is we will see a similar YoY sales decline in December as in November, due to the increase in mortgage rates in September and October.

Tuesday, December 27, 2022
Wednesday: Pending Home Sales
by Calculated Risk on 12/27/2022 08:26:00 PM
 Note: Mortgage rates are from MortgageNewsDaily.com and are for top tier scenarios.
Note on MBA Index: "Due to the holiday, the results for weeks ending December 23, 2022 and December 30, 2022 will both be released on January 4, 2023."
Wednesday:
• At 10:00 AM ET, Pending Home Sales Index for November. The consensus is for a 0.5% decrease in the index.
• At 10:00 AM, Richmond Fed Survey of Manufacturing Activity for December. This is the last of regional manufacturing surveys for December.


