 RSS Feed
 by Calculated Risk on 12/22/2022 08:25:00 PM
Thursday, December 22, 2022
Friday: Durable Goods, Personal Income & Outlays, New Home Sales
 Note: Mortgage rates are from MortgageNewsDaily.com and are for top tier scenarios.
Friday:
• At 8:30 AM ET, Durable Goods Orders for November. The consensus is for a 0.1% increase..
• Also, at 8:30 AM: Personal Income and Outlays for November. The consensus is for a 0.2% increase in personal income, and for a 0.2% increase in personal spending. And for a 0.3% increase in the PCE prices index, and the Core PCE price index to increase 0.2%. PCE prices are expected to be up 5.7% YoY, and core PCE prices up 4.7% YoY.
• At 10:00 AM: New Home Sales for November from the Census Bureau. The consensus is for 595 thousand SAAR, down from 632 thousand in October.
• Also, at 10:00 AM: University of Michigan's Consumer sentiment index (Final for December).
• Also, at 10:00 AM: State Employment and Unemployment (Monthly) for November 2022
Freddie Mac: Mortgage Serious Delinquency Rate unchanged in November
by Calculated Risk on 12/22/2022 04:48:00 PM
Freddie Mac reported that the Single-Family serious delinquency rate in November was 0.66%, unchanged from 0.66% October. Freddie's rate is down year-over-year from 1.24% in November 2021.
Freddie's serious delinquency rate peaked in February 2010 at 4.20% following the housing bubble and peaked at 3.17% in August 2020 during the pandemic.
These are mortgage loans that are "three monthly payments or more past due or in foreclosure".
 Click on graph for larger image
Mortgages in forbearance are being counted as delinquent in this monthly report but are not reported to the credit bureaus.
The serious delinquency rate was at 0.60% just prior to the pandemic - this is almost back to that level.
Note that multi-family delinquencies have been increasing and were at 0.15% in November.
Realtor.com Reports Weekly Active Inventory Up 58% YoY; New Listings Down 17% YoY
by Calculated Risk on 12/22/2022 04:43:00 PM
Realtor.com has monthly and weekly data on the existing home market. Here is their weekly report released today from Economist Jiayi Xu: Weekly Housing Trends View — Data Week Ending Dec 17, 2022. Note: They have data on list prices, new listings and more, but this focus is on inventory.
• Active inventory growth held steady with for-sale homes up 58% above one year ago. Inventory growth continues to climb higher this week after its first pause in early December.
...
• New listings–a measure of sellers putting homes up for sale–were again down, this week by 17% from one year ago
 Here is a graph of the year-over-year change in inventory according to realtor.com.
 Note the rapid increase in the YoY change earlier this year, from down 30% at the beginning of the year, to up 29% YoY at the beginning of July.
Then the Realtor.com data was stuck at up around 26% to 30% YoY for 14 weeks in a row. This was due to the slowdown in new listings, even as sales had fallen sharply.
Then the YoY change started increasing sharply again (inventory is falling seasonally week-to-week now, but the comparison is YoY).
Vehicle Sales Forecast: "Sales to Weaken Again in December"
by Calculated Risk on 12/22/2022 02:22:00 PM
From WardsAuto: U.S. Light-Vehicle Sales to Weaken Again in December; Inventory Set to Rise (pay content). Brief excerpt:
If Winter Storm Elliott is as bad as predicted, it will create another headwind to December deliveries on top of inventory-related issues, fear of recession and rising prices and interest rates. Conversely, because the bad weather is hitting broad swaths of the U.S. at a time when most vehicle assembly plants will be closed anyway for the holiday season, production losses should be minimal and end-of-month inventory will not significantly suffer because of it.
 Click on graph for larger image.
This graph shows actual sales from the BEA (Blue), and Wards forecast for December (Red).
The Wards forecast of 13.0 million SAAR, would be down 8% from last month, but up 2% from a year ago (sales weakened in the second half of 2021, due to supply chain issues).
Vehicle sales are usually a transmission mechanism for Federal Open Market Committee (FOMC) policy, far behind housing. This time vehicle sales have been more suppressed by supply chain issues, but sales are probably now also being impacted by higher interest rates.
Lawler: Update on Rent Trends
by Calculated Risk on 12/22/2022 11:12:00 AM
Today, in the CalculatedRisk Real Estate Newsletter: Lawler: Update on Rent Trends
Excerpt:
From housing economist Tom Lawler:There is much more in the article. You can subscribe at https://calculatedrisk.substack.com/ Please subscribe!
Recently released data from various private entities that track US rent trends indicate that US rent growth has weakened considerably this Fall, and several measures suggest that rents have fallen by more than the seasonal norm over the last few months.
Here is a table showing monthly % changes in the Apartment List Rent Index (ALRI, not smoothed), the Zillow Observed Rent Index (ZORI, smoothed via 3-month moving average), and the CoreLogic Single Family Rent Index (CLSFRI, smoothed via 3-month moving average.) I’ve included the ALRI on a 3-month moving average basis to be comparable to the other two indices.
...
These rent indices show not only has US rent growth slowed sharply, but that rents have actually begun to fall this Fall, and by more than the seasonal norm.

Q3 GDP Growth Revised Up to 3.2% Annual Rate
by Calculated Risk on 12/22/2022 08:39:00 AM
From the BEA: Gross Domestic Product (Third Estimate), GDP by Industry, and Corporate Profits (Revised), Third Quarter 2022
Real gross domestic product (GDP) increased at an annual rate of 3.2 percent in the third quarter of 2022, according to the "third" estimate released by the Bureau of Economic Analysis. In the second quarter, real GDP decreased 0.6 percent.Here is a Comparison of Third and Second Estimates. PCE growth was revised up from 1.7% to 2.3%. Residential investment was revised down from -26.8% to -27.1%.
The "third" estimate of GDP released today is based on more complete source data than were available for the "second" estimate issued last month. In the second estimate, the increase in real GDP was 2.9 percent. The updated estimates primarily reflected upward revisions to consumer spending and nonresidential fixed investment that were partly offset by a downward revision to private inventory investment. For more information, refer to "Updates to GDP."
...
Real gross domestic income (GDI) increased 0.8 percent in the third quarter, an upward revision of 0.5 percentage point from the previous estimate. The average of real GDP and real GDI, a supplemental measure of U.S. economic activity that equally weights GDP and GDI, increased 2.0 percent in the third quarter, an upward revision of 0.4 percentage point.
emphasis added
Weekly Initial Unemployment Claims increase to 216,000
by Calculated Risk on 12/22/2022 08:33:00 AM
The DOL reported:
In the week ending December 17, the advance figure for seasonally adjusted initial claims was 216,000, an increase of 2,000 from the previous week's revised level. The previous week's level was revised up by 3,000 from 211,000 to 214,000. The 4-week moving average was 221,750, a decrease of 6,250 from the previous week's revised average. The previous week's average was revised up by 750 from 227,250 to 228,000.The following graph shows the 4-week moving average of weekly claims since 1971.
emphasis added
 Click on graph for larger image.
The dashed line on the graph is the current 4-week average. The four-week average of weekly unemployment claims decreased to 221,750.
The previous week was revised up.
Weekly claims were lower than the consensus forecast.
Black Knight: Mortgage Delinquency Rate Increased in November; Prepayments at Record Low
by Calculated Risk on 12/22/2022 07:00:00 AM
From Black Knight: Black Knight’s First Look: Prepayments Hit Third Consecutive Record Low in November, While Mortgage Delinquencies Top 3.0% and Foreclosure Starts Bounce 19%
• Prepayment activity in November dropped 15.6% to a single month mortality (SMM) rate of 0.40% – once again marking the lowest rate on record since before 2000 when Black Knight started reporting the metricAccording to Black Knight's First Look report, the percent of loans delinquent increased 3.5% in November compared to October and decreased 16% year-over-year.
• The national delinquency rate rose another 3.5% in November to 3.01%, up 10 basis points since October, driven by a 31K (+3.9%) increase in 30-day delinquencies and a 25K (+11%) rise in 60-day delinquencies
• The delinquency rate in Florida rose another 18 basis points in the month to 3.60% as the impact of Hurricane Ian on homeowners’ ability to make mortgage payments continues
• Improvement among seriously past-due loans continues to stagnate, with the population of 90-day delinquencies ticking down -0.2% from the month prior
• Foreclosure starts rose again (+19%) on the heels of October’s increase, but the month’s 23.4K starts are still below the recent high seen in June 2022 and remain 30% below pre-pandemic levels
• Foreclosure was started on 4.3% of serious delinquencies in November, up 7 basis points from October but still 44% less than the rate seen in the years leading up to the pandemic
• Active foreclosure inventory rose 5.3%, though 2022 volumes remain subdued after the record lows of 2021 due to widespread moratoriums and forbearance protections
emphasis added
Black Knight reported the U.S. mortgage delinquency rate (loans 30 or more days past due, but not in foreclosure) was 3.01% in November, up from 2.91% in October.
The percent of loans in the foreclosure process increased in November to 0.37%, from 0.35% in October.
The number of delinquent properties, but not in foreclosure, is down 294,000 properties year-over-year, and the number of properties in the foreclosure process is up 64,000 properties year-over-year.
| Black Knight: Percent Loans Delinquent and in Foreclosure Process | ||||
|---|---|---|---|---|
| Nov 2022 | Oct 2022 | Nov 2021 | Nov 2020 | |
| Delinquent | 3.01% | 2.91% | 3.59% | 6.33% |
| In Foreclosure | 0.37% | 0.35% | 0.25% | 0.33% |
| Number of properties: | ||||
| Number of properties that are delinquent, but not in foreclosure: | 1,612,000 | 1,557,000 | 1,906,000 | 3,381,000 |
| Number of properties in foreclosure pre-sale inventory: | 196,000 | 186,000 | 132,000 | 176,000 |
| Total Properties | 1,808,000 | 1,743,000 | 2,039,000 | 3,557,000 |
Wednesday, December 21, 2022
Thursday: Unemployment Claims, Q3 GDP (Third Estimate)
by Calculated Risk on 12/21/2022 08:31:00 PM
 Note: Mortgage rates are from MortgageNewsDaily.com and are for top tier scenarios.
Thursday:
• At 8:30 AM, The initial weekly unemployment claims report will be released. The consensus is for 225 thousand initial claims, up from 211 thousand last week.
• Also at 8:30 AM, Gross Domestic Product, 3rd quarter 2022 (Third estimate). The consensus is for real GDP at 2.9% annualized, unchanged from the second estimate of 2.9%.
• Also at 8:30 AM, Chicago Fed National Activity Index for November. This is a composite index of other data.
• At 11:00 AM, the Kansas City Fed manufacturing survey for December.
The Normal Seasonal Pattern for Median House Prices
by Calculated Risk on 12/21/2022 12:39:00 PM
Earlier, in the CalculatedRisk Real Estate Newsletter on Existing-Home Sales for November, I mentioned that the median price was down more than normal seasonally.
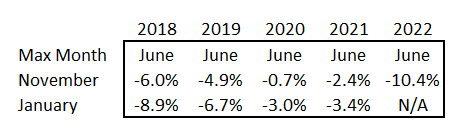 Here is a table of the seasonal pattern over the last several years.
Seasonally prices typically peak in June (closed sales for contracts signed mostly in April and May).
And seasonally prices bottom in January (contracts signed in November and December). I've included the decline from the peak for November for each year to compare to this year.
In 2020 and 2021, median prices only declined about 3% from peak to bottom.
But the decline this year, 10.4% so far, is much larger than in the pre-pandemic years. And we will probably see further declines in December and January - putting median prices down year-over-year in January.


