 RSS Feed
 by Calculated Risk on 12/06/2022 09:27:00 AM
Tuesday, December 06, 2022
Q3 Update: Delinquencies, Foreclosures and REO
Today, in the Calculated Risk Real Estate Newsletter: Q3 Update: Delinquencies, Foreclosures and REO
A brief excerpt:
Last year, I pointed out that with the end of the foreclosure moratoriums, combined with the expiration of a large number of forbearance plans, we would see an increase in REOs in late 2022 and into 2023. However, this would NOT lead to a surge in foreclosures and significantly impact house prices (as happened following the housing bubble) since lending has been solid and most homeowners have substantial equity in their homes.There is much more in the article. You can subscribe at https://calculatedrisk.substack.com/
...
Here is some data on REOs through Q3 2022 …
...
This graph shows the nominal dollar value of Residential REO for FDIC insured institutions. Note: The FDIC reports the dollar value and not the total number of REOs.
The dollar value of 1-4 family residential Real Estate Owned (REOs, foreclosure houses) increased from $784 million in Q2 2022 to $818 million in Q3 2022. This is increasing, but still very low.
...
The bottom line is there will be an increase in foreclosures over the next year (from record low levels), but it will not be a huge wave of foreclosures as happened following the housing bubble. The distressed sales during the housing bust led to cascading price declines, and that will not happen this time.

Trade Deficit increased to $78.2 Billion in October
by Calculated Risk on 12/06/2022 08:44:00 AM
From the Department of Commerce reported:
The U.S. Census Bureau and the U.S. Bureau of Economic Analysis announced today that the goods and services deficit was $78.2 billion in October, up $4.0 billion from $74.1 billion in September, revised.
October exports were $256.6 billion, $1.9 billion less than September exports. October imports were $334.8 billion, $2.2 billion more than September imports.
emphasis added
 Click on graph for larger image.
Exports decreased and imports increased in October.
Exports are up 14% year-over-year; imports are also up 14% year-over-year.
Both imports and exports decreased sharply due to COVID-19 and have now bounced back.
The second graph shows the U.S. trade deficit, with and without petroleum.
 The blue line is the total deficit, and the black line is the petroleum deficit, and the red line is the trade deficit ex-petroleum products.
Note that net, exports of petroleum products are slightly positive.
The trade deficit with China decreased to $28.9 billion in October, from $31.3 billion a year ago.
The trade deficit was slightly smaller than the consensus forecast.
CoreLogic: House Prices up 10.1% YoY in October; Declined 0.1% MoM in October NSA
by Calculated Risk on 12/06/2022 08:00:00 AM
Notes: This CoreLogic House Price Index report is for October. The recent Case-Shiller index release was for September. The CoreLogic HPI is a three-month weighted average and is not seasonally adjusted (NSA).
From CoreLogic: US Annual Home Price Growth Slows to Half of Spring 2022 Peak in October, CoreLogic Reports
CoreLogic® ... today released the CoreLogic Home Price Index (HPI™) and HPI Forecast™ for October 2022.
Year-over-year home price growth remained in double digits in October, at 10.1%, but continued to cool and was the lowest recorded since early 2021. Several factors are contributing to slowing appreciation: low inventory due to seller preferences to keep affordable mortgage rates that they have already locked in, homebuyer loss of purchase power and current economic uncertainty. Annual U.S. price growth is expected to taper off in the coming months, perhaps moving into negative territory by spring 2023, but then slowly ticking back into single digits as the year progresses.
“Following the recent mortgage rate surge above 7%, real estate activity and consumer sentiment regarding the housing market took a nosedive,” said Selma Hepp, interim lead of the Office of the Chief Economist at CoreLogic. “Home price growth continued to approach single digits in October, and it will move in that direction for the rest of the year and into 2023.”
...
U.S. home prices (including distressed sales) increased 10.1% year over year in October 2022 compared to October 2021. On a month-over-month basis, home prices declined by 0.1% compared to September 2022.
emphasis added
Monday, December 05, 2022
Tuesday: Trade Deficit
by Calculated Risk on 12/05/2022 08:00:00 PM
 From Matthew Graham at Mortgage News Daily: Mortgage Rates Start Lower, But Finish Higher
In addition to Fed anxiety, there was stronger economic data again this morning with a key report on the services sector coming in near the highest levels since earlier this year (a big reversal considering the previous month came in at the lowest levels in more than 2 years).Tuesday:
Strong economic data implies higher rates, all other things being equal. The bond market traded accordingly. By the end of the day, we'd lost enough ground that most mortgage lenders recalled their initial offerings and "re-priced" with higher rates/fees. The net effect was that Monday's rates ended up being close to Friday morning's after having been moderately lower to start the day. [30 year fixed 6.33%]
emphasis added
• At 8:00 AM: Corelogic House Price index for October.
• At 8:30 AM: Trade Balance report for October from the Census Bureau. The consensus is the trade deficit to be $79.1 billion. The U.S. trade deficit was at $73.3 billion in September.
Q4 GDP Tracking: Around 1.5%
by Calculated Risk on 12/05/2022 02:07:00 PM
From BofA:
Overall, today's data pushed up our 4Q US GDP tracking by one-tenth to 1.4% q/q saar. [Dec 5th estimate]From Goldman:
emphasis added
We left our Q4 GDP tracking estimate unchanged on net at +1.4% (qoq ar). [Dec 5th estimate]And from the Altanta Fed: GDPNow
The GDPNow model estimate for real GDP growth (seasonally adjusted annual rate) in the fourth quarter of 2022 is 2.8 percent on December 1, down from 4.3 percent on November 23. [Dec 1st estimate]
Black Knight Mortgage Monitor: Home Prices Declined in October; Down 3.2% since June
by Calculated Risk on 12/05/2022 11:06:00 AM
Today, in the Calculated Risk Real Estate Newsletter: Black Knight Mortgage Monitor: Home Prices Declined in October; Down 3.2% since June
A brief excerpt:
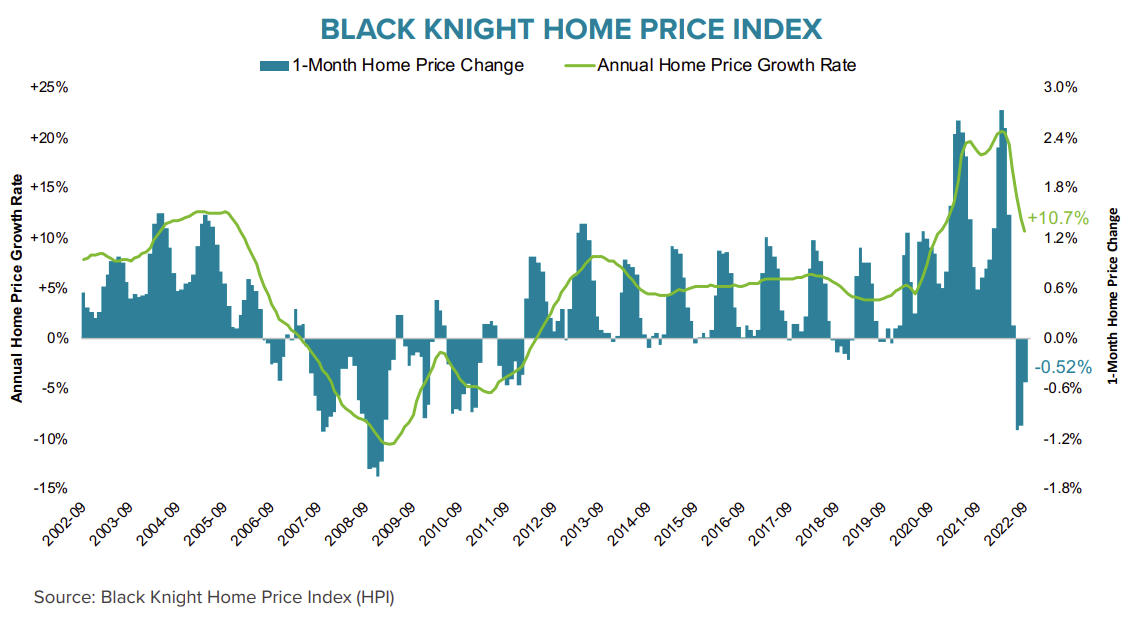
Here is a graph of the Black Knight HPI. The index is still up 9.3% year-over-year but declined for the fourth straight month in October and is now 3.2% off the peak in June.There is much more in the article. You can subscribe at https://calculatedrisk.substack.com/
• While near multi-decade low affordability would suggest home prices should be seeing strong declines, stalling inventory levels are holding home prices higher than current demand levels would suggest they should be
• Home prices fell 0.43% in October (-0.13% on a seasonally-adjusted basis), the smallest such decline – both actual and seasonally adjusted – since home prices peaked in June
• Likewise, home price growth cooled for the seventh consecutive month, to 9.3% in October from 10.6% the prior month, the lowest annual rate in >2 years
• The median home price nationally is now down 3.2% (-1.5% on a seasonally-adjusted basis) from its June peak but tight inventory has slowed the rate of decline in recent months
ISM® Services Index Increased to 56.5% in November
by Calculated Risk on 12/05/2022 10:13:00 AM
(Posted with permission). The ISM® Services index was at 56.5%, up from 54.4% last month. The employment index increased to 51.5%, from 49.1%. Note: Above 50 indicates expansion, below 50 in contraction.
From the Institute for Supply Management: Services PMI® at 56.5% November 2022 Services ISM® Report On Business®
Economic activity in the services sector grew in November for the 30th month in a row — with the Services PMI® registering 56.5 percent — say the nation's purchasing and supply executives in the latest Services ISM® Report On Business®.The PMI was higher than expected and the employment index was above 50.
The report was issued today by Anthony Nieves, CPSM, C.P.M., A.P.P., CFPM, Chair of the Institute for Supply Management® (ISM®) Services Business Survey Committee: “In November, the Services PMI® registered 56.5 percent, 2.1 percentage points higher than October’s reading of 54.4 percent. The Business Activity Index registered 64.7 percent, a substantial increase of 9 percentage points compared to the reading of 55.7 percent in October. The New Orders Index figure of 56 percent is 0.5 percentage point lower than the October reading of 56.5 percent.
emphasis added
Housing December 5th Weekly Update: Inventory Decreased 2.6% Week-over-week
by Calculated Risk on 12/05/2022 09:03:00 AM
Active inventory decreased last week. Here are the same week inventory changes for the last four years (usually inventory declines seasonally through the Winter):
2022: -14.4K (somewhat smaller than the usual seasonal decrease in inventory)
2021: -24.5K
2020: -18.3K
2019: -24.9K
Altos reports inventory is down 2.6% week-over-week and down 4.8% from the peak on October 28th.
 Click on graph for larger image.
This inventory graph is courtesy of Altos Research.
 Click on graph for larger image.
This inventory graph is courtesy of Altos Research.
As of December 2nd, inventory was at 549 thousand (7-day average), compared to 564 thousand the prior week.
Compared to the same week in 2021, inventory is up 56.7% from 350 thousand, and compared to the same week in 2020 inventory is up 14.2% from 481 thousand. However, compared to 3 years ago (2019), inventory is down 34.1% from 834 thousand.
Here are the inventory milestones I’ve been watching for with the Altos data:
1. The seasonal bottom (happened on March 4, 2022, for Altos) ✅
2. Inventory up year-over-year (happened on May 20, 2022, for Altos) ✅
3. Inventory up compared to 2020 (happened on October 7, 2022, for Altos) ✅
4. Inventory up compared to 2019 (currently down 34.1%).

Mike Simonsen discusses this data regularly on Youtube.
1. The seasonal bottom (happened on March 4, 2022, for Altos) ✅
2. Inventory up year-over-year (happened on May 20, 2022, for Altos) ✅
3. Inventory up compared to 2020 (happened on October 7, 2022, for Altos) ✅
4. Inventory up compared to 2019 (currently down 34.1%).

Here is a graph of the inventory change vs 2021 (milestone 2 above), 2020 (milestone 3) and 2019 (milestone 4). The blue line is the year-over-year data, the red line is compared to two years ago, and dashed purple is compared to 2019.
A key will be if inventory declines slower than usual during the winter months.
Mike Simonsen discusses this data regularly on Youtube.
Four High Frequency Indicators for the Economy
by Calculated Risk on 12/05/2022 08:27:00 AM
These indicators are mostly for travel and entertainment. It was interesting to watch these sectors recover as the pandemic impact subsided.
The TSA is providing daily travel numbers.
This data is as of December 4th.
 Click on graph for larger image.
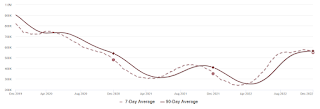
This data shows the 7-day average of daily total traveler throughput from the TSA for 2019 (Light Blue), 2020 (Black), 2021 (Blue) and 2022 (Red).
The dashed line is the percent of 2019 for the seven-day average.
The 7-day average is 6.9% below the same week in 2019 (93.1% of 2019). (Dashed line)
Air travel - as a percent of 2019 - has picked up recently - but still below pre-pandemic levels.
----- Movie Tickets: Box Office Mojo -----
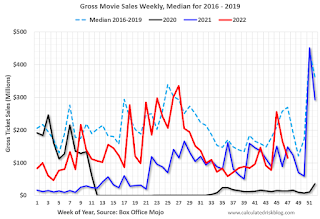 This data shows domestic box office for each week and the median for the years 2016 through 2019 (dashed light blue).
 This data shows domestic box office for each week and the median for the years 2016 through 2019 (dashed light blue).
 Black is 2020, Blue is 2021 and Red is 2022.
The data is from BoxOfficeMojo through December 1st.
Note that the data is usually noisy week-to-week and depends on when blockbusters are released.
Movie ticket sales were at $115 million last week, down about 57% from the median for the week.
Note that the data is usually noisy week-to-week and depends on when blockbusters are released.
Movie ticket sales were at $115 million last week, down about 57% from the median for the week.
 This graph shows the seasonal pattern for the hotel occupancy rate using the four-week average.
 The red line is for 2022, black is 2020, blue is the median, and dashed light blue is for 2021. Dashed purple is 2019 (STR is comparing to a strong year for hotels).
This data is through Nov 26th. The occupancy rate was down 0.5% compared to the same week in 2019.
The 4-week average of the occupancy rate is above the median rate for the previous 20 years (Blue) and close to 2019 levels.
Notes: Y-axis doesn't start at zero to better show the seasonal change.
Notes: Y-axis doesn't start at zero to better show the seasonal change.
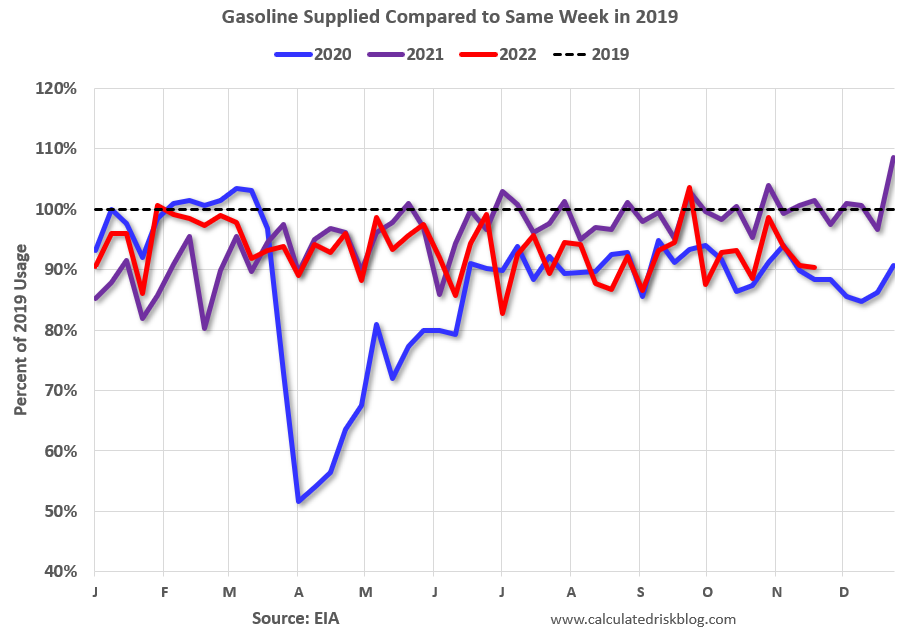
This graph, based on weekly data from the U.S. Energy Information Administration (EIA), shows gasoline supplied compared to the same week of 2019.
Blue is for 2020. Purple is for 2021, and Red is for 2022.
As of November 25th, gasoline supplied was down 9.6% compared to the same week in 2019.
Recently gasoline supplied has been running below 2019 and 2021 levels - and sometimes below 2020.
Sunday, December 04, 2022
Sunday Night Futures
by Calculated Risk on 12/04/2022 10:53:00 PM
Weekend:
• Schedule for Week of December 4, 2022
Monday:
• AT 10:00 AM ET, the ISM Services Index for November.
From CNBC: Pre-Market Data and Bloomberg futures S&P 500 are down 4 and DOW futures are down 16 (fair value).
Oil prices were up over the last week with WTI futures at $80.89 per barrel and Brent at $86.51 per barrel. A year ago, WTI was at $66, and Brent was at $71 - so WTI oil prices are up 23% year-over-year.
Here is a graph from Gasbuddy.com for nationwide gasoline prices. Nationally prices are at $3.36 per gallon. A year ago, prices were at $3.34 per gallon, so gasoline prices are up $0.02 per gallon year-over-year.


