 RSS Feed
 by Calculated Risk on 6/03/2022 08:44:00 AM
Friday, June 03, 2022
May Employment Report: 390 thousand Jobs, 3.6% Unemployment Rate
From the BLS:
Total nonfarm payroll employment rose by 390,000 in May, and the unemployment rate remained at 3.6 percent, the U.S. Bureau of Labor Statistics reported today. Notable job gains occurred in leisure and hospitality, in professional and business services, and in transportation and warehousing. Employment in retail trade declined.
...
The change in total nonfarm payroll employment for March was revised down by 30,000, from +428,000 to +398,000, and the change for April was revised up by 8,000, from +428,000 to +436,000. With these revisions, employment in March and April combined is 22,000 lower than previously reported.
emphasis added
 Click on graph for larger image.
The first graph shows the job losses from the start of the employment recession, in percentage terms.
The current employment recession was by far the worst recession since WWII in percentage terms.
However, 27 months after the onset of the current employment recession, almost all of the jobs have returned.
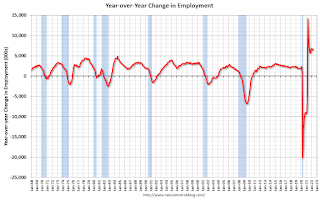 The second graph shows the year-over-year change in total non-farm employment since 1968.
In May, the year-over-year change was 6.5 million jobs. This was up significantly year-over-year.
Total payrolls increased by 390 thousand in May. Private payrolls increased by 333 thousand, and public payrolls increased 57 thousand.
Payrolls for March and April were revised down 22 thousand, combined.
The third graph shows the employment population ratio and the participation rate.
 The Labor Force Participation Rate increased to 62.3% in May, from 62.2% in April. This is the percentage of the working age population in the labor force.
The Employment-Population ratio increased to 60.1% from 60.0% (blue line).
I'll post the 25 to 54 age group employment-population ratio graph later.
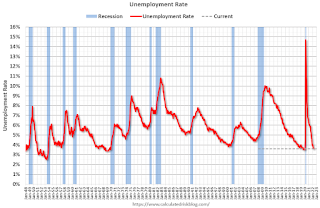 The fourth graph shows the unemployment rate.
The unemployment rate was unchanged in May at 3.6% from 3.6% in April.
This was above consensus expectations; however, March and April payrolls were revised down by 22,000 combined.
 The second graph shows the year-over-year change in total non-farm employment since 1968.
In May, the year-over-year change was 6.5 million jobs. This was up significantly year-over-year.
Total payrolls increased by 390 thousand in May. Private payrolls increased by 333 thousand, and public payrolls increased 57 thousand.
Payrolls for March and April were revised down 22 thousand, combined.
The third graph shows the employment population ratio and the participation rate.
 The Labor Force Participation Rate increased to 62.3% in May, from 62.2% in April. This is the percentage of the working age population in the labor force.
 The Employment-Population ratio increased to 60.1% from 60.0% (blue line).
I'll post the 25 to 54 age group employment-population ratio graph later.
 The fourth graph shows the unemployment rate.
 The unemployment rate was unchanged in May at 3.6% from 3.6% in April.
This was above consensus expectations; however, March and April payrolls were revised down by 22,000 combined.
I'll have more later ...
Thursday, June 02, 2022
Friday: Employment Report
by Calculated Risk on 6/02/2022 09:01:00 PM
My May Employment Preview
Goldman May Payrolls Preview
Friday:
• At 8:30 AM ET, Employment Report for May. The consensus is for 320,000 jobs added, and for the unemployment rate to decline to 3.5%.
• At 10:00 AM, the ISM Services Index for May. The consensus is for a reading of 56.4, down from 57.1.
On COVID (focus on hospitalizations and deaths):
| COVID Metrics | ||||
|---|---|---|---|---|
| Now | Week Ago | Goal | ||
| Percent fully Vaccinated | 66.7% | --- | ≥70.0%1 | |
| Fully Vaccinated (millions) | 221.4 | --- | ≥2321 | |
| New Cases per Day3 | 100,683 | 110,080 | ≤5,0002 | |
| Hospitalized3🚩 | 21,306 | 20,290 | ≤3,0002 | |
| Deaths per Day3 | 244 | 318 | ≤502 | |
| 1 Minimum to achieve "herd immunity" (estimated between 70% and 85%). 2my goals to stop daily posts, 37-day average for Cases, Currently Hospitalized, and Deaths 🚩 Increasing 7-day average week-over-week for Cases, Hospitalized, and Deaths ✅ Goal met. | ||||
 Click on graph for larger image.
This graph shows the daily (columns) and 7-day average (line) of deaths reported.
Average daily deaths bottomed in July 2021 at 214 per day.
Goldman May Payrolls Preview
by Calculated Risk on 6/02/2022 04:25:00 PM
A few brief excerpts from a note by Goldman Sachs economist Spencer Hill:
We estimate nonfarm payrolls rose by 225k in May (mom sa), a slowdown from the +428k pace in both of the previous two months and below consensus of +323k. ... We estimate a one-tenth drop in the unemployment rate to 3.5%—in line with consensusCR Note: The consensus is for 320 thousand jobs added, and for the unemployment rate to decline to 3.5%.
emphasis added
Hotels: Occupancy Rate Up 3.2% Compared to Same Week in 2019
by Calculated Risk on 6/02/2022 03:50:00 PM
This was the first increase in the occupancy rate compared to the same week in 2019. This was partly due to the timing of Memorial Day, and I expect the occupancy rate to be down compared to 2019 next week.
U.S. hotel performance dipped slightly from the previous week, according to STR‘s latest data through May 28.The following graph shows the seasonal pattern for the hotel occupancy rate using the four-week average.
May 22-28, 2022 (percentage change from comparable week in 2019*):
• Occupancy: 66.5% (+3.2%)
• Average daily rate (ADR): $151.73 (+22.2%)
• Revenue per available room (RevPAR): $100.97 (+26.2%)
*Due to the pandemic impact, STR is measuring recovery against comparable time periods from 2019.
emphasis added
 Click on graph for larger image.
The red line is for 2022, black is 2020, blue is the median, and dashed light blue is for 2021. Dashed purple is 2019 (STR is comparing to a strong year for hotels).
The 4-week average of the occupancy rate is above the median rate for the previous 20 years (Blue).
Note: Y-axis doesn't start at zero to better show the seasonal change.
The 4-week average of the occupancy rate will now mostly move sideways seasonally until the summer.
May Employment Preview
by Calculated Risk on 6/02/2022 12:34:00 PM
On Friday at 8:30 AM ET, the BLS will release the employment report for May. The consensus is for 320,000 jobs added, and for the unemployment rate to decline to 3.5%.
 Click on graph for larger image.
• First, currently there are still about 1.2 million fewer jobs than in February 2020 (the month before the pandemic).
This graph shows the job losses from the start of the employment recession, in percentage terms.
The current employment recession was by far the worst recession since WWII in percentage terms. However, the current employment recession, 26 months after the onset, has recovered quicker than the previous two recessions.
• ADP Report: The ADP employment report showed a gain of 128,000 private sector jobs, well below the consensus estimates of 280,000 jobs added. The ADP report hasn't been very useful in predicting the BLS report, but this suggests a weaker than expected BLS report.
• ISM Surveys: Note that the ISM services are diffusion indexes based on the number of firms hiring (not the number of hires). The ISM® manufacturing employment index decreased in May to 49.6%, down from 50.9% last month. This would suggest 20,000 jobs lost in manufacturing. ADP showed 22,000 manufacturing jobs added.
The ISM® Services employment index for May will be released tomorrow.
• Unemployment Claims: The weekly claims report showed an increase in the number of initial unemployment claims during the reference week (includes the 12th of the month) from 185,000 in April to 218,000 in May. This would usually suggest a few more layoffs in May than in April. In general, weekly claims were close to expectations in May.
 • Permanent Job Losers: Something to watch in the employment report will be "Permanent job losers". This graph shows permanent job losers as a percent of the pre-recession peak in employment through the April report.
This data is only available back to 1994, so there is only data for three recessions. In April, the number of permanent job losers decreased to 1.386 million from 1.392 million in the previous month.
These jobs will likely be the hardest to recover, so it is a positive that the number of permanent job losers is declining fairly rapidly.
• COVID: As far as the pandemic, the number of daily cases during the reference week in May was around 90,000, up triple the 30,000 in April. This is a possible negative for the May report.
• Conclusion: The consensus is for job growth to slow to 320,000 jobs added in May. Overall, the ADP report was below expectations, the ISM manufacturing employment was negative, and unemployment claims increased during the reference week. This suggests a weaker than expected employment report for May.
Rent Increases Up Sharply Year-over-year, Pace is slowing
by Calculated Risk on 6/02/2022 09:11:00 AM
Today, in the Calculated Risk Real Estate Newsletter: Rent Increases Up Sharply Year-over-year, Pace is slowing
A brief excerpt:
Here is a graph of the year-over-year (YoY) change for these measures since January 2015. All of these measures are through April 2022 (Apartment List through May 2022).There is much more in the article. You can subscribe at https://calculatedrisk.substack.com/
Note that new lease measures (Zillow, Apartment List) dipped early in the pandemic, whereas the BLS measures were steady. Then new leases took off, and the BLS measures are picking up.
...
The Zillow measure is up 16.4% YoY in April, down from 17.0% YoY in March. This is down from a peak of 17.2% YoY in February.
The ApartmentList measure is up 15.3% YoY as of May, down from 16.4% in April. This is down from the peak of 17.9% YoY last November.
Clearly rents are still increasing, and we should expect this to continue to spill over into measures of inflation in 2022. The Owners’ Equivalent Rent (OER) was up 4.8% YoY in April, from 4.5% YoY in March - and will likely increase further in the coming months.
My suspicion is rent increases will slow over the coming months as the pace of household formation slows, and more supply comes on the market.

Weekly Initial Unemployment Claims Decrease to 200,000
by Calculated Risk on 6/02/2022 08:34:00 AM
The DOL reported:
In the week ending May 28, the advance figure for seasonally adjusted initial claims was 200,000, a decrease of 11,000 from the previous week's revised level. The previous week's level was revised up by 1,000 from 210,000 to 211,000. The 4-week moving average was 206,500, a decrease of 500 from the previous week's revised average. The previous week's average was revised up by 250 from 206,750 to 207,000.The following graph shows the 4-week moving average of weekly claims since 1971.
emphasis added
 Click on graph for larger image.
The dashed line on the graph is the current 4-week average. The four-week average of weekly unemployment claims decreased to 206,500.
The previous week was revised up.
Weekly claims were lower than the consensus forecast.
ADP: Private Employment Increased 128,000 in May
by Calculated Risk on 6/02/2022 08:19:00 AM
Private sector employment increased by 128,000 jobs from April to May according to the May ADP® National Employment ReportTM. Broadly distributed to the public each month, free of charge, the ADP National Employment Report is produced by the ADP Research Institute® in collaboration with Moody’s Analytics. The report, which is derived from ADP’s actual data of those who are on a company’s payroll, measures the change in total nonfarm private employment each month on a seasonally-adjusted basisThis was below the consensus forecast of 280,000 for this report.
“Under a backdrop of a tight labor market and elevated inflation, monthly job gains are closer to pre-pandemic levels,” said Nela Richardson, chief economist, ADP. “The job growth rate of hiring has tempered across all industries, while small businesses remain a source of concern as they struggle to keep up with larger firms that have been booming as of late.”
emphasis added
The BLS report will be released Friday, and the consensus is for 320 thousand non-farm payroll jobs added in April. The ADP report has not been very useful in predicting the BLS report, but this suggests a weaker than expected BLS report.
Wednesday, June 01, 2022
Thursday: ADP Employment, Unemployment Claims
by Calculated Risk on 6/01/2022 09:14:00 PM
Thursday:
• At 8:15 AM ET, The ADP Employment Report for May. This report is for private payrolls only (no government). The consensus is for 280,000 payroll jobs added in May, up from 247,000 in April.
• At 8:30 AM, The initial weekly unemployment claims report will be released. The consensus is for 210 thousand unchanged from 210 thousand last week.
On COVID (focus on hospitalizations and deaths):
| COVID Metrics | ||||
|---|---|---|---|---|
| Now | Week Ago | Goal | ||
| Percent fully Vaccinated | 66.7% | --- | ≥70.0%1 | |
| Fully Vaccinated (millions) | 221.4 | --- | ≥2321 | |
| New Cases per Day3 | 103,686 | 108,692 | ≤5,0002 | |
| Hospitalized3🚩 | 20.984 | 20.011 | ≤3,0002 | |
| Deaths per Day3 | 264 | 303 | ≤502 | |
| 1 Minimum to achieve "herd immunity" (estimated between 70% and 85%). 2my goals to stop daily posts, 37-day average for Cases, Currently Hospitalized, and Deaths 🚩 Increasing 7-day average week-over-week for Cases, Hospitalized, and Deaths ✅ Goal met. | ||||
 Click on graph for larger image.
This graph shows the daily (columns) and 7-day average (line) of deaths reported.
Average daily deaths bottomed in July 2021 at 214 per day.
Vehicles Sales Decreased to 12.68 million SAAR in May
by Calculated Risk on 6/01/2022 05:28:00 PM
Wards Auto released their estimate of light vehicle sales for May. Wards Auto estimates sales of 12.68 million SAAR in May 2022 (Seasonally Adjusted Annual Rate), down 11.2% from the April sales rate, and down 24.9% from May 2021.
 Click on graph for larger image.
This graph shows light vehicle sales since 2006 from the BEA (blue) and Wards Auto's estimate for May (red).
The impact of COVID-19 was significant, and April 2020 was the worst month. After April 2020, sales increased, and were close to sales in 2019 (the year before the pandemic).
However, sales decreased late last year due to supply issues. It appears the "supply chain bottom" was in September 2021.
 The second graph shows light vehicle sales since the BEA started keeping data in 1967.
 Sales in May were below the consensus forecast of 14.5 million SAAR.


