 RSS Feed
 by Calculated Risk on 12/24/2021 10:32:00 AM
Friday, December 24, 2021
Ten Economic Questions for 2022
Here is a review of the Ten Economic Questions for 2021
Below are my ten questions for 2022. These are just questions; I'll follow up with some thoughts on each of these questions.
The purpose of these questions is to provide a framework to think about how the U.S. economy will perform in 2022, and if there are surprises - like in 2020 - to adjust my thinking.
A key question is when will the pandemic subside significantly? This will have a huge economic impact but is a question for infectious disease experts. The good news is a large percentage of the population is vaccinated, and there are effective drugs on the way. Science should continue to make progress against the virus.
1) Economic growth: Economic growth was probably around 5.5% in 2021 as the economy rebounded from 2020. There will be a drag from fiscal policy in 2022, and monetary policy will be less accommodative. The FOMC is expecting growth of 3.6% to 4.5% Q4-over-Q4 in 2022. How much will the economy grow in 2022?
2) Employment: Through November 2021, the economy added 6.1 million jobs in 2021. This makes 2021 the best year for job growth ever - by far. However, there are still 3.9 million fewer jobs than in February 2020 (pre-pandemic). Will the remaining jobs lost in 2020 return in 2022, or will job growth be sluggish?
3) Unemployment Rate: The unemployment rate was at 4.2% in November, down 2.5 percentage points year-over-year. Currently the FOMC is forecasting the unemployment rate will be in the 3.4% to 3.7% range in Q4 2022. What will the unemployment rate be in December 2022?
4) Participation Rate: In November 2021, the overall participation rate was at 61.8%, up year-over-year from 61.5% in November 2020. Long term, the BLS is projecting the overall participation rate will decline to 60.4% by 2030 due to demographics. Will the overall participation rate increase to pre-pandemic levels (63.4% in February 2020)? What will be the participation rate in December 2022?
5) Inflation: Core PCE was up 4.7% YoY through November. This was the highest YoY increase in core PCE since 1989. The FOMC is forecasting the YoY change in core PCE will be in the 2.5% to 3.0% range in Q4 2022. Will the core inflation rate increase or decrease by December 2022?
6) Monetary Policy: In response to the pandemic, the FOMC cut rates to zero, and initiated an asset purchase program in March 2020. The FOMC is currently on pace to stop the asset purchase program in March 2022. A majority of FOMC participants expect three rate hikes in 2022. Will the Fed raise rates in 2022? If so, how many times?
7) Residential Investment: Residential investment (RI) was a slight drag on growth in 2021, because investment was so strong in the 2nd half of 2020. Through November, starts were up 16.3% year-to-date compared to the same period in 2020. New home sales were down 6.5% year-to-date through November. Note: RI is mostly investment in new single-family structures, multifamily structures, home improvement and commissions on existing home sales. How much will RI change in 2022? How about housing starts and new home sales in 2022?
8) Housing Credit: Will we see easier mortgage lending in 2022? Will we see a further sharp increase in mortgage equity withdrawal (MEW)?
9) House Prices: It appears house prices - as measured by the national repeat sales index (Case-Shiller, FHFA, and CoreLogic) - will be up around 18% to 20% in 2021. What will happen with house prices in 2022?
10) Housing Inventory: Housing inventory decreased sharply during the pandemic to record lows in early 2021. Will inventory increase as the pandemic subsides, or will inventory decrease further in 2022?
Some thoughts:
• Question #1 for 2022: How much will the economy grow in 2022?
• Question #2 for 2022: Will the remaining jobs lost in 2020 return in 2022, or will job growth be sluggish?
• Question #3 for 2022: What will the unemployment rate be in December 2022?
• Question #4 for 2022: Will the overall participation rate increase to pre-pandemic levels (63.4% in February 2020)?
• Question #5 for 2022: Will the core inflation rate increase or decrease by December 2022?
• Question #6 for 2022: Will the Fed raise rates in 2022? If so, how many times?
• Question #7 for 2022: How about housing starts and new home sales in 2022?
• Question #8 for 2022: Housing Credit: Will we see easier mortgage lending in 2022?
• Question #9 for 2022: What will happen with house prices in 2022?
• Question #10 for 2022: Will inventory increase as the pandemic subsides, or will inventory decrease further in 2022?
Black Knight: National Mortgage Delinquency Rate Decreased in November; Foreclosures at Record Low
by Calculated Risk on 12/24/2021 08:11:00 AM
Note: At the beginning of the pandemic, the delinquency rate increased sharply (see table below). Loans in forbearance are counted as delinquent in this survey, but those loans are not reported as delinquent to the credit bureaus.
From Black Knight: Mortgage Delinquencies Continue Steady Improvement; Active Foreclosures Fall to Yet Another Record Low Entering Final Month of 2021
• The national delinquency rate saw yet another month of steady improvement, with November’s 4.1% monthly decline matching the 18-month average rate of reductionAccording to Black Knight's First Look report, the percent of loans delinquent decreased 4.1% in November compared to October and decreased 43% year-over-year.
• Despite serious delinquencies (loans 90+ days past due but not in foreclosure) falling another 80,000 from October, over 1 million such delinquencies remain, 2.5 times more than at the start of the pandemic
• Both foreclosure starts (3,700) and active foreclosure inventory (132,000) hit new record lows in November as borrowers continue to work through available forbearance and loss mitigation options
• More than 800,000 forbearance exits have occurred over the past 60 days, with nearly 560,000 homeowners remaining in post-forbearance loss mitigation
• Given the size of this population, both serious delinquency and foreclosure metrics demand close attention as we enter 2022
• Prepayment activity (SMM) fell by 8.9% in November to hit its lowest level in 22 months, as rising 30-year rates continue to put downward pressure on refinance volumes
emphasis added
The percent of loans in the foreclosure process decreased 4.3% in November and were down 24% over the last year.
Black Knight reported the U.S. mortgage delinquency rate (loans 30 or more days past due, but not in foreclosure) was 3.59% in November, down from 3.74% in October.
The percent of loans in the foreclosure process decreased in November to 0.25%, from 0.26% in October.
The number of delinquent properties, but not in foreclosure, is down 1,475,000 properties year-over-year, and the number of properties in the foreclosure process is down 44,000 properties year-over-year.
| Black Knight: Percent Loans Delinquent and in Foreclosure Process | ||||
|---|---|---|---|---|
| Nov 2021 | Oct 2021 | Nov 2020 | Nov 2019 | |
| Delinquent | 3.59% | 3.74% | 6.33% | 3.53% |
| In Foreclosure | 0.25% | 0.26% | 0.33% | 0.47% |
| Number of properties: | ||||
| Number of properties that are delinquent, but not in foreclosure: | 1,906,000 | 1,986,000 | 3,381,000 | 1,868,000 |
| Number of properties in foreclosure pre-sale inventory: | 132,000 | 138,000 | 176,000 | 248,000 |
| Total Properties | 2,039,000 | 2,125,000 | 3,557,000 | 2,116,000 |
Thursday, December 23, 2021
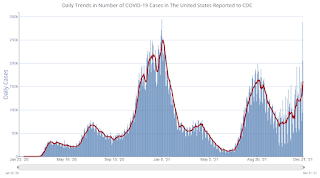
COVID December 23, 2021: Average Cases Exceeds Delta Peak
by Calculated Risk on 12/23/2021 08:58:00 PM
There will be no COVID updates over the 3-day Christmas weekend. Stay safe.
The CDC is the source for all data.
| COVID Metrics | ||||
|---|---|---|---|---|
| Today | Week Ago | Goal | ||
| Percent fully Vaccinated | 61.7% | --- | ≥70.0%1 | |
| Fully Vaccinated (millions) | 204.7 | --- | ≥2321 | |
| New Cases per Day3🚩 | 176,097 | 121,154 | ≤5,0002 | |
| Hospitalized3🚩 | 60,871 | 60,043 | ≤3,0002 | |
| Deaths per Day3🚩 | 1,213 | 1,170 | ≤502 | |
| 1 Minimum to achieve "herd immunity" (estimated between 70% and 85%). 2my goals to stop daily posts, 37-day average for Cases, Currently Hospitalized, and Deaths 🚩 Increasing 7-day average week-over-week for Cases, Hospitalized, and Deaths ✅ Goal met. | ||||
 Click on graph for larger image.
This graph shows the daily (columns) and 7-day average (line) of cases reported.
The scale might change soon (almost record number of new cases reported recently).
Freddie Mac: Mortgage Serious Delinquency Rate decreased in November
by Calculated Risk on 12/23/2021 04:42:00 PM
Freddie Mac reported that the Single-Family serious delinquency rate in November was 1.24%, down from 1.32% in October. Freddie's rate is down year-over-year from 2.75% in November 2020.
Freddie's serious delinquency rate peaked in February 2010 at 4.20% following the housing bubble, and peaked at 3.17% in August 2020 during the pandemic.
These are mortgage loans that are "three monthly payments or more past due or in foreclosure".

Mortgages in forbearance are being counted as delinquent in this monthly report, but are not reported to the credit bureaus.
This is very different from the increase in delinquencies following the housing bubble. Lending standards have been fairly solid over the last decade, and most of these homeowners have equity in their homes - and they will be able to restructure their loans once (if) they are employed.
Also - for multifamily - delinquencies were at 0.09%, down from the peak of 0.20% in April 2021.
Hotels: Occupancy Rate Up 8% Compared to Same Week in 2019
by Calculated Risk on 12/23/2021 02:15:00 PM
Note: Since occupancy declined sharply at the onset of the pandemic, CoStar is comparing to 2019.
U.S. hotel performance surpassed the levels seen during the comparable week of 2019, according to STR‘s latest data through December 18.The following graph shows the seasonal pattern for the hotel occupancy rate using the four week average.
December 12-18, 2021 (percentage change from comparable week in 2019*):
• Occupancy: 53.8% (+7.7%)
• Average daily rate (ADR): US$121.87 (+11.6%)
• Revenue per available room (RevPAR): US$65.61 (+20.2%)
Percentage changes were in part lifted by the comparable week of 2019 (ending 21 December) being closer to Christmas.
*Due to the steep, pandemic-driven performance declines of 2020, STR is measuring recovery against comparable time periods from 2019.
emphasis added
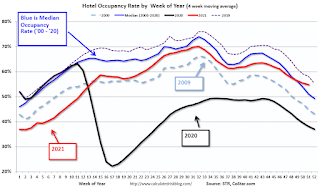 Click on graph for larger image.
The red line is for 2021, black is 2020, blue is the median, dashed purple is 2019, and dashed light blue is for 2009 (the worst year on record for hotels prior to 2020).
Although down compared to 2019, the 4-week average of the occupancy rate is now above the median rate for the previous 20 years (Blue).
Note: Y-axis doesn't start at zero to better show the seasonal change.
The 4-week average of the occupancy rate will bottom seasonally over the next few weeks.
New Home Sales: Record 110 thousand homes have not been started
by Calculated Risk on 12/23/2021 12:35:00 PM
Today, in the Real Estate Newsletter: New Home Sales: Record 110 thousand homes have not been started
Brief excerpt:
Sales, year to date in 2021, are 6.5% below sales in 2020, and new home sales in 2021 will finish solidly below sales in 2020 - since sales in 2020 finished strong.You can subscribe at https://calculatedrisk.substack.com/ (Currently all content is available for free, but please subscribe).
This graph shows new home sales for 2020 and 2021 by month (Seasonally Adjusted Annual Rate).
The year-over-year comparisons were easy in the first half of 2021 - especially in March and April. However, sales will be down year-over-year again in December - since the selling season was delayed in 2020.
...
The next graph shows the months of supply by stage of construction. “Months of supply” is inventory at each stage, divided by the sales rate.
The inventory of completed homes for sale was at 39 thousand in November, up from the record low of 33 thousand in March, April, May and July 2021. That is about 0.6 months of completed supply (red line). This is about half the normal level.
The inventory of new homes under construction is at 4.1 months (blue line) - well above the normal level. This elevated level of homes under construction is due to supply chain constraints.
And a record 110 thousand homes have not been started - about 1.8 months of supply (grey line) - almost double the normal level. Homebuilders are probably waiting to start some homes until they have a firmer grasp on prices.
New Home Sales at 744,000 Annual Rate in November
by Calculated Risk on 12/23/2021 10:08:00 AM
The Census Bureau reports New Home Sales in November were at a seasonally adjusted annual rate (SAAR) of 744 thousand.
The previous three months were revised down significantly.
Sales of new single‐family houses in November 2021 were at a seasonally adjusted annual rate of 744,000, according to estimates released jointly today by the U.S. Census Bureau and the Department of Housing and Urban Development. This is 12.4 percent above the revised October rate of 662,000, but is 14.0 percent below the November 2020 estimate of 865,000.
emphasis added
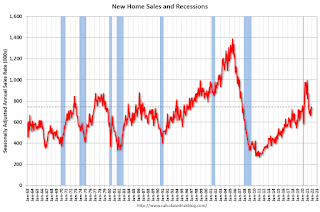 Click on graph for larger image.
The first graph shows New Home Sales vs. recessions since 1963. The dashed line is the current sales rate.
New home sales are now declining year-over-year since sales soared following the first few months of the pandemic.
The second graph shows New Home Months of Supply.
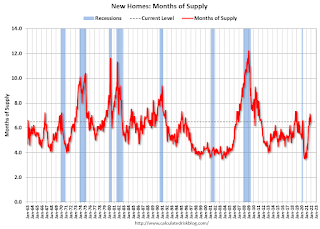 The months of supply decreased in November to 6.5 months from 7.1 months in October.
 The all-time record high was 12.1 months of supply in January 2009. The all-time record low was 3.5 months, most recently in October 2020.
This is above the normal range (about 4 to 6 months of supply is normal).
"The seasonally‐adjusted estimate of new houses for sale at the end of November was 402,000. This represents a supply of 6.5 months at the current sales rate."
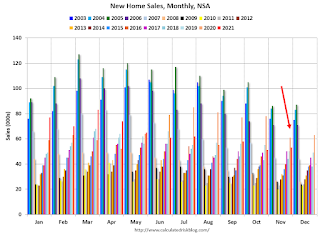 The last graph shows sales NSA (monthly sales, not seasonally adjusted annual rate).
In November 2021 (red column), 53 thousand new homes were sold (NSA). Last year, 61 thousand homes were sold in November.
The all-time high for November was 86 thousand in 2005, and the all-time low for November was 20 thousand in 2010.
This was below expectations of 766 thousand SAAR, and sales in the three previous months were revised down significantly. I'll have more later today.
Personal Income increased 0.4% in November; Spending increased 0.6%
by Calculated Risk on 12/23/2021 08:41:00 AM
The BEA released the Personal Income and Outlays report for November:
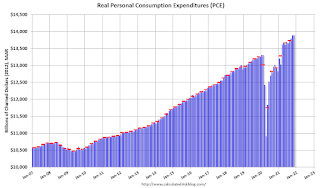
Personal income increased $90.4 billion (0.4 percent) in November according to estimates released today by the Bureau of Economic Analysis. Disposable personal income (DPI) increased $70.4 billion (0.4 percent) and personal consumption expenditures (PCE) increased $104.7 billion (0.6 percent).The November PCE price index increased 5.7 percent year-over-year and the November PCE price index, excluding food and energy, increased 4.7 percent year-over-year.
Real DPI decreased 0.2 percent in November and Real PCE increased less than 0.1 percent; spending on services increased 0.5 percent and spending on goods decreased 0.8 percent. The PCE price index increased 0.6 percent. Excluding food and energy, the PCE price index increased 0.5 percent
emphasis added
The following graph shows real Personal Consumption Expenditures (PCE) through November 2021 (2012 dollars). Note that the y-axis doesn't start at zero to better show the change.
 Click on graph for larger image.
The dashed red lines are the quarterly levels for real PCE.
Personal income was above expectations, and the increase in PCE was below expectations.
Using the two-month method to estimate Q4 PCE growth, PCE was increasing at a 5.7% annual rate in Q4 2021. (Using the mid-month method, PCE was increasing at 4.2%).
Weekly Initial Unemployment Claims Unchanged at 205,000
by Calculated Risk on 12/23/2021 08:34:00 AM
The DOL reported:
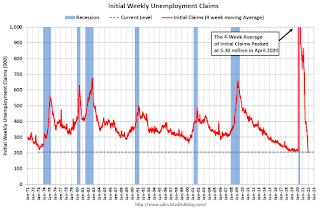
In the week ending December 18, the advance figure for seasonally adjusted initial claims was 205,000, unchanged from the previous week's revised level. The previous week's level was revised down by 1,000 from 206,000 to 205,000. The 4- week moving average was 206,250, an increase of 2,750 from the previous week's revised average. The previous week's average was revised down by 250 from 203,750 to 203,500.The following graph shows the 4-week moving average of weekly claims since 1971.
emphasis added
 Click on graph for larger image.
The dashed line on the graph is the current 4-week average. The four-week average of weekly unemployment claims increased to 206,000.
The previous week was revised down.
Regular state continued claims decreased to 1,859,000 (SA) from 1,867,000 (SA) the previous week.
Weekly claims were at the consensus forecast.
Wednesday, December 22, 2021
Thursday: Unemployment Claims, Durable Goods, Personal Income and Outlays, New Home Sales
by Calculated Risk on 12/22/2021 07:34:00 PM
Thursday:
• At 8:30 AM ET, the initial weekly unemployment claims report will be released. Initial claims were 206 thousand last week.
• Also, at 8:30 AM, Durable Goods Orders for November.
• Also, at 8:30 AM, Personal Income and Outlays for November. The consensus is for a 0.2% increase in personal income, and for a 1.0% increase in personal spending.
• At 10:00 AM, New Home Sales for November from the Census Bureau. The consensus is 766 thousand sales SAAR.
• Also, at 10:00 AM, University of Michigan's Consumer sentiment index (Final for December).
From CR on COVID (mostly focus on hospitalizations and deaths, although new cases are rising rapidly):
The CDC is the source for all data.
| COVID Metrics | ||||
|---|---|---|---|---|
| Today | Week Ago | Goal | ||
| Percent fully Vaccinated | 61.7% | --- | ≥70.0%1 | |
| Fully Vaccinated (millions) | 204.8 | --- | ≥2321 | |
| New Cases per Day3🚩 | 161,261 | 118,855 | ≤5,0002 | |
| Hospitalized3🚩 | 61,290 | 59,405 | ≤3,0002 | |
| Deaths per Day3🚩 | 1,223 | 1,112 | ≤502 | |
| 1 Minimum to achieve "herd immunity" (estimated between 70% and 85%). 2my goals to stop daily posts, 37-day average for Cases, Currently Hospitalized, and Deaths 🚩 Increasing 7-day average week-over-week for Cases, Hospitalized, and Deaths ✅ Goal met. | ||||
 Click on graph for larger image.
This graph shows the daily (columns) and 7-day average (line) of cases reported.
The scale might change soon (almost record number of new cases reported yesterday).


