 RSS Feed
 by Calculated Risk on 7/16/2021 03:32:00 PM
Friday, July 16, 2021
July 16th COVID-19, New Cases, Hospitalizations, Vaccinations
The 7-day average cases is the highest since May 19th.
The 7-day average hospitalizations is the highest since June 4th.
This data is from the CDC.
According to the CDC, on Vaccinations.
Total doses administered: 336,604,158, as of a week ago 332,966,409. Average doses last week: 0.52 million per day.
KUDOS to the residents of the 20 states and D.C. that have already achieved the 70% goal (percent over 18 with at least one dose): Vermont, Hawaii, Massachusetts and Connecticut are at 80%+, and Maine, New Mexico, New Jersey, Rhode Island, Pennsylvania, California, Maryland, Washington, New Hampshire, New York, Illinois, Virginia, Delaware, Minnesota, Oregon, Colorado and D.C. are all over 70%.
According to the CDC, on Vaccinations.
Total doses administered: 336,604,158, as of a week ago 332,966,409. Average doses last week: 0.52 million per day.
| COVID Metrics | ||||
|---|---|---|---|---|
| Today | Yesterday | Week Ago | Goal | |
| Percent over 18, One Dose | 68.0% | 67.9% | 67.4% | ≥70.0%1,2 |
| Fully Vaccinated✅ (millions) | 160.7 | 160.4 | 158.6 | ≥1601 |
| New Cases per Day3🚩 | 27,804 | 26,306 | 16,995 | ≤5,0002 |
| Hospitalized3🚩 | 16,241 | 15,580 | 12,703 | ≤3,0002 |
| Deaths per Day3🚩 | 223 | 211 | 162 | ≤502 |
| 1 America's Short Term Goals, 2my goals to stop daily posts, 37 day average for Cases, Hospitalized, and Deaths 🚩 Increasing 7 day average week-over-week for Cases, Hospitalized, and Deaths ✅ Goal met (even if late). | ||||
KUDOS to the residents of the 20 states and D.C. that have already achieved the 70% goal (percent over 18 with at least one dose): Vermont, Hawaii, Massachusetts and Connecticut are at 80%+, and Maine, New Mexico, New Jersey, Rhode Island, Pennsylvania, California, Maryland, Washington, New Hampshire, New York, Illinois, Virginia, Delaware, Minnesota, Oregon, Colorado and D.C. are all over 70%.
Next up are Utah at 66.5%, Wisconsin at 66.2%, Florida at 66.1%, Nebraska at 66.1%, South Dakota at 65.0%, and Iowa at 64.6%.
 Click on graph for larger image.
This graph shows the daily (columns) and 7 day average (line) of positive tests reported.
This data is from the CDC.
Q2 GDP Forecasts: Forecasts Down to around 8%
by Calculated Risk on 7/16/2021 12:05:00 PM
From BofA:
[lowered] 2Q GDP growth of 8.5% qoq saar. [July 15 estimate]From Goldman Sachs:
emphasis added
We lowered our Q2 GDP tracking estimates by ¼pp to +8¼% (qoq ar), reflecting the downward revisions to retail control. [July 16 estimate]From the NY Fed Nowcasting Report
The New York Fed Staff Nowcast stands at 3.2% for 2021:Q2 and 4.2% for 2021:Q3. [July 16 estimate]And from the Altanta Fed: GDPNow
The GDPNow model estimate for real GDP growth (seasonally adjusted annual rate) in the second quarter of 2021 is 7.5 percent on July 16, down from 7.9 percent on July 9. [July 16 estimate]
Black Knight: Number of Homeowners in COVID-19-Related Forbearance Plans Declined Slightly
by Calculated Risk on 7/16/2021 10:31:00 AM
Note: Both Black Knight and the MBA (Mortgage Bankers Association) are putting out weekly estimates of mortgages in forbearance.
This data is as of July 13th.
From Andy Walden at Black Knight: Forbearance Volumes Essentially Flat This Week
After last week’s roughly 190,000 reduction in the number of active forbearance plans, a decline of just 1,000 plans may feel miniscule.
It may indeed be, but it’s also very much in line with what we’ve seen month after month since the recovery began – namely, the well-documented, mid-month lull in activity.
As of July 13, 1.86 million borrowers remain in COVID-19 forbearance plans, making up 3.5% of all active mortgages and 2.1% of GSE, 6.2% of FHA/VA and 4.0% of Portfolio/PLS loans.
What little weekly improvement was seen was found among FHA/VA forbearance plans (-5,000). This was partially offset by a 4,000 rise among portfolio/PLS forbearances while at the same time plan volumes among GSE loans held steady from last week.
Click on graph for larger image.
All in, this puts the number of loans in active forbearance down 196,000 (-9.5%) from the same time last month. With nearly 400,000 plans still scheduled to be reviewed for extension/removal this month, there is still a chance for moderate recovery towards the end of this month and the beginning of August.
Removal volumes returned to mid-June levels as the number of loans being reviewed for extension/removal trailed off after the first week of the month, while plan starts edged higher, driven by an increase in restart activity.
This too is a familiar phenomenon; one we’ve seen following large volumes of quarterly plan reviews over the course of the pandemic. As in the past, the increase in restarts is most likely a counter to last week’s large number of exits.
emphasis added

Retail Sales Increased 0.6% in June
by Calculated Risk on 7/16/2021 08:38:00 AM
On a monthly basis, retail sales were increased 0.6% from May to June (seasonally adjusted), and sales were up 18.0 percent from June 2020.
From the Census Bureau report:
Advance estimates of U.S. retail and food services sales for June 2021, adjusted for seasonal variation and holiday and trading-day differences, but not for price changes, were $621.3 billion, an increase of 0.6 percent from the previous month, and 18.0 percent above June 2020. ... The April 2021 to May 2021 percent change was revised from down 1.3 percent to down 1.7 percent.
emphasis added
 Click on graph for larger image.
This graph shows retail sales since 1992. This is monthly retail sales and food service, seasonally adjusted (total and ex-gasoline).
Retail sales ex-gasoline were up 0.4% in June.
The stimulus checks boosted retail sales significantly in March and April.
The second graph shows the year-over-year change in retail sales and food service (ex-gasoline) since 1993.
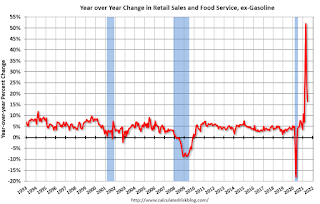 Retail and Food service sales, ex-gasoline, increased by 16.6% on a YoY basis.
Sales in June were above expectations, however sales in May were revised down.
The second graph shows the year-over-year change in retail sales and food service (ex-gasoline) since 1993.
 Retail and Food service sales, ex-gasoline, increased by 16.6% on a YoY basis.
Sales in June were above expectations, however sales in May were revised down.
Thursday, July 15, 2021
Friday: Retail Sales
by Calculated Risk on 7/15/2021 08:59:00 PM
Friday:
• At 8:30 AM ET, Retail sales for June is scheduled to be released. The consensus is for 0.4% decrease in retail sales. Retail sales ex-gasoline were down 1.5% in May.
• At 10:00 AM, University of Michigan's Consumer sentiment index (Preliminary for July).
• At 10:00 AM, State Employment and Unemployment (Monthly) for June 2020
July 15th COVID-19, New Cases, Hospitalizations, Vaccinations
by Calculated Risk on 7/15/2021 03:42:00 PM
The 7-day average cases is the highest since May 20th.
The 7-day average hospitalizations is the highest since June 5th.
This data is from the CDC.
According to the CDC, on Vaccinations.
Total doses administered: 336,054,953, as of a week ago 332,345,797. Average doses last week: 0.53 million per day.
KUDOS to the residents of the 20 states and D.C. that have already achieved the 70% goal (percent over 18 with at least one dose): Vermont, Hawaii, Massachusetts and Connecticut are at 80%+, and Maine, New Mexico, New Jersey, Rhode Island, Pennsylvania, California, Maryland, Washington, New Hampshire, New York, Illinois, Virginia, Delaware, Minnesota, Oregon, Colorado and D.C. are all over 70%.
According to the CDC, on Vaccinations.
Total doses administered: 336,054,953, as of a week ago 332,345,797. Average doses last week: 0.53 million per day.
| COVID Metrics | ||||
|---|---|---|---|---|
| Today | Yesterday | Week Ago | Goal | |
| Percent over 18, One Dose | 67.9% | 67.8% | 67.3% | ≥70.0%1,2 |
| Fully Vaccinated✅ (millions) | 160.4 | 160.1 | 158.3 | ≥1601 |
| New Cases per Day3🚩 | 26,306 | 24,739 | 15,541 | ≤5,0002 |
| Hospitalized3🚩 | 15,580 | 15,069 | 12,419 | ≤3,0002 |
| Deaths per Day3🚩 | 211 | 203 | 167 | ≤502 |
| 1 America's Short Term Goals, 2my goals to stop daily posts, 37 day average for Cases, Hospitalized, and Deaths 🚩 Increasing 7 day average week-over-week for Cases, Hospitalized, and Deaths ✅ Goal met (even if late). | ||||
KUDOS to the residents of the 20 states and D.C. that have already achieved the 70% goal (percent over 18 with at least one dose): Vermont, Hawaii, Massachusetts and Connecticut are at 80%+, and Maine, New Mexico, New Jersey, Rhode Island, Pennsylvania, California, Maryland, Washington, New Hampshire, New York, Illinois, Virginia, Delaware, Minnesota, Oregon, Colorado and D.C. are all over 70%.
Next up are Utah at 66.3%, Wisconsin at 66.2%, Florida at 66.1%, Nebraska at 65.9%, South Dakota at 64.9%, and Iowa at 64.5%.
 Click on graph for larger image.
This graph shows the daily (columns) and 7 day average (line) of positive tests reported.
This data is from the CDC.
Sacramento Real Estate in June: Sales up 14% YoY, Active Inventory down 13% YoY
by Calculated Risk on 7/15/2021 01:31:00 PM
Note: I'm tracking data for many local markets around the U.S. I think it is especially important to watch inventory this year.
From SacRealtor.org: Sacramento County median sales price reaches $520,000
June closed ended with 1,723 sales, an 11.9% increase from May (1,540). Compared to one year ago (1,506), the current figure is up 14.4%..Note that inventory in June was up 2.4% from last month, and up 76% from the record low in January 2021.
...
The Active Listing Inventory increased 2.4% from May to June, from 1,267 units to 1,297 units. Compared with June 2020 (1,495), inventory is down 13.2%.
The Months of Inventory remained at .8 Months. This figure represents the amount of time (in months) it would take for the current rate of sales to deplete the total active listing inventory.
emphasis added
LA Area Port Traffic: Solid Imports, Weak Exports in June
by Calculated Risk on 7/15/2021 01:21:00 PM
Note: The expansion to the Panama Canal was completed in 2016 (As I noted a few years ago), and some of the traffic that used the ports of Los Angeles and Long Beach is probably going through the canal. This might be impacting TEUs on the West Coast.
Container traffic gives us an idea about the volume of goods being exported and imported - and usually some hints about the trade report since LA area ports handle about 40% of the nation's container port traffic.
The following graphs are for inbound and outbound traffic at the ports of Los Angeles and Long Beach in TEUs (TEUs: 20-foot equivalent units or 20-foot-long cargo container).
To remove the strong seasonal component for inbound traffic, the first graph shows the rolling 12 month average.
 Click on graph for larger image.
On a rolling 12 month basis, inbound traffic was up 1.5% in June compared to the rolling 12 months ending in May. Outbound traffic was down 0.5% compared to the rolling 12 months ending the previous month.
The 2nd graph is the monthly data (with a strong seasonal pattern for imports).
 Usually imports peak in the July to October period as retailers import goods for the Christmas holiday, and then decline sharply and bottom in February or March depending on the timing of the Chinese New Year.
2021 started off incredibly strong for imports.
Imports were up 23% YoY in June (collapsed last year due to pandemic), and exports were down 6.2% YoY.
Imports were up 23% YoY in June (collapsed last year due to pandemic), and exports were down 6.2% YoY.
Hotels: Occupancy Rate Down 9% Compared to Same Week in 2019
by Calculated Risk on 7/15/2021 11:47:00 AM
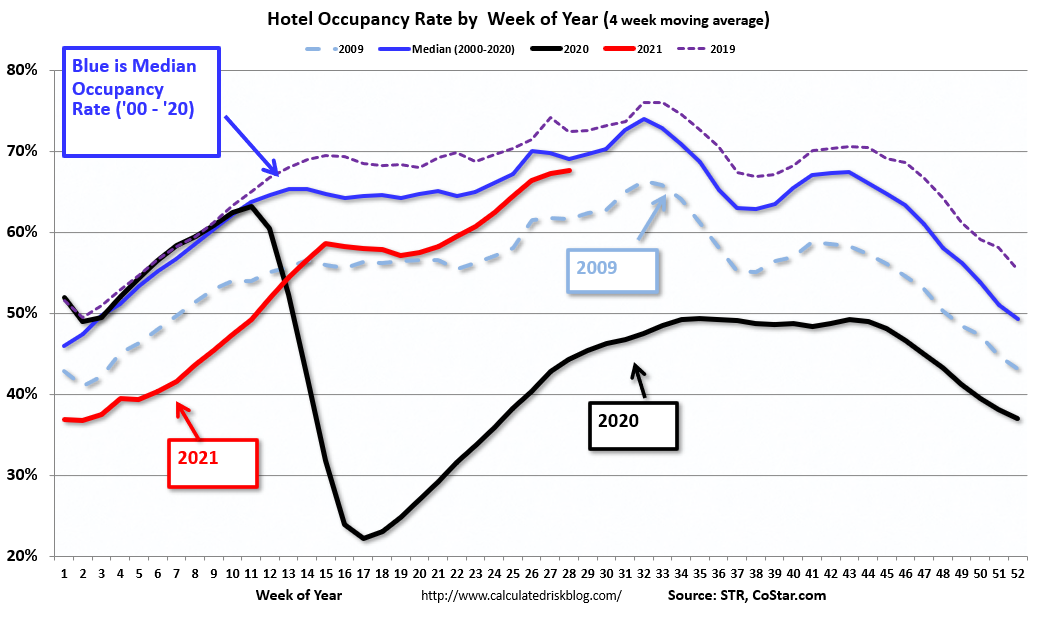
Note: The year-over-year occupancy comparisons are easy, since occupancy declined sharply at the onset of the pandemic. So STR is comparing to the same week in 2019.
The occupancy rate is down 9.3% compared to the same week in 2019.
U.S. hotel occupancy improved week over week, while average daily rate (ADR) was the highest on record, according to STR‘s latest data through July 10.The following graph shows the seasonal pattern for the hotel occupancy rate using the four week average.
July 4-10, 2021 (percentage change from comparable week in 2019*):
• Occupancy: 67.2% (-9.3%)
• Average daily rate (ADR): US$139.84 (+5.4%)
• Revenue per available room (RevPAR): US$93.99 (-4.4%)
Inflation aside, STR analysts note that hoteliers are taking advantage of pent-up leisure demand and higher spending travelers while trying to counter staffing shortages and rising operational costs in some regions. Additionally, with demand mostly transient, there is not the usual lowering effect of discounted group rates at the higher end of the market. Most of the higher ADR performances are outside of the major metro markets.
emphasis added
 Click on graph for larger image.
The red line is for 2021, black is 2020, blue is the median, dashed purple is 2019, and dashed light blue is for 2009 (the worst year on record for hotels prior to 2020).
Occupancy is well above the horrible 2009 levels and weekend occupancy (leisure) has been solid.
Note: Y-axis doesn't start at zero to better show the seasonal change.
Note: Y-axis doesn't start at zero to better show the seasonal change.
With solid leisure travel, the Summer months should have decent occupancy - but it is uncertain what will happen in the Fall with business travel.
Industrial Production Increased 0.4 Percent in June
by Calculated Risk on 7/15/2021 09:23:00 AM
From the Fed: Industrial Production and Capacity Utilization
Industrial production increased 0.4 percent in June after moving up 0.7 percent in May. In June, manufacturing output edged down 0.1 percent, as an ongoing shortage of semiconductors contributed to a decrease of 6.6 percent in the production of motor vehicles and parts. Excluding motor vehicles and parts, factory output increased 0.4 percent. The output of utilities advanced 2.7 percent, reflecting heightened demand for air conditioning, as much of the country experienced a heat wave in June. The index for mining increased 1.4 percent.
For the second quarter as a whole, total industrial production rose at an annual rate of 5.5 percent. Manufacturing output increased at an annual rate of 3.7 percent despite a drop of 22.5 percent for motor vehicles and parts.
At 100.1 percent of its 2017 average, total industrial production in June was 9.8 percent above its year-earlier level but 1.2 percent below its pre-pandemic (February 2020) level. Capacity utilization for the industrial sector rose 0.3 percentage point in June to 75.4 percent, a rate that is 4.2 percentage points below its long-run (1972–2020) average.
emphasis added
 Click on graph for larger image.
This graph shows Capacity Utilization. This series is up from the record low set in April 2020, but still below the level in February 2020.
Capacity utilization at 75.4% is 4.2% below the average from 1972 to 2020.
Note: y-axis doesn't start at zero to better show the change.
 The second graph shows industrial production since 1967.
Industrial production increased in June to 100.1. This is 1.2% below the February 2020 level.
The change in industrial production was below consensus expectations.


