 RSS Feed
 by Calculated Risk on 7/15/2021 11:47:00 AM
Thursday, July 15, 2021
Hotels: Occupancy Rate Down 9% Compared to Same Week in 2019
Note: The year-over-year occupancy comparisons are easy, since occupancy declined sharply at the onset of the pandemic. So STR is comparing to the same week in 2019.
The occupancy rate is down 9.3% compared to the same week in 2019.
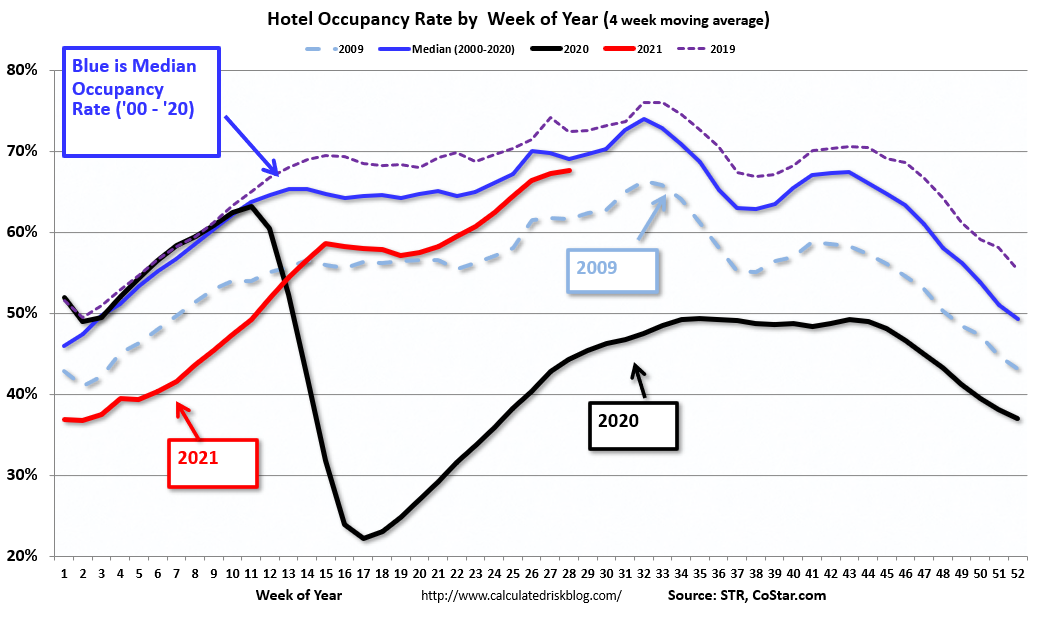
U.S. hotel occupancy improved week over week, while average daily rate (ADR) was the highest on record, according to STR‘s latest data through July 10.The following graph shows the seasonal pattern for the hotel occupancy rate using the four week average.
July 4-10, 2021 (percentage change from comparable week in 2019*):
• Occupancy: 67.2% (-9.3%)
• Average daily rate (ADR): US$139.84 (+5.4%)
• Revenue per available room (RevPAR): US$93.99 (-4.4%)
Inflation aside, STR analysts note that hoteliers are taking advantage of pent-up leisure demand and higher spending travelers while trying to counter staffing shortages and rising operational costs in some regions. Additionally, with demand mostly transient, there is not the usual lowering effect of discounted group rates at the higher end of the market. Most of the higher ADR performances are outside of the major metro markets.
emphasis added
 Click on graph for larger image.
The red line is for 2021, black is 2020, blue is the median, dashed purple is 2019, and dashed light blue is for 2009 (the worst year on record for hotels prior to 2020).
Occupancy is well above the horrible 2009 levels and weekend occupancy (leisure) has been solid.
Note: Y-axis doesn't start at zero to better show the seasonal change.
Note: Y-axis doesn't start at zero to better show the seasonal change.
With solid leisure travel, the Summer months should have decent occupancy - but it is uncertain what will happen in the Fall with business travel.


