 RSS Feed
 by Calculated Risk on 3/23/2021 12:07:00 PM
Tuesday, March 23, 2021
A few Comments on February New Home Sales
New home sales for February were reported at 775,000 on a seasonally adjusted annual rate basis (SAAR). Sales for the previous three months were revised up significantly.
This was well below consensus expectations for February. The weather was harsh in February - and probably played a role in the decline in sales - but the large year-over-year declines were in the West and Northeast. If the sales decline in February had been mostly weather related, we'd expect large declines in the mid-West and South regions (but sales were up year-over-year in those regions).
Still, the last nine months saw the highest sales rates since 2006. Clearly low mortgages rates, low existing home supply, and favorable demographics have boosted sales. A surging stock market has probably helped new home sales too.
Earlier: New Home Sales decrease to 775,000 Annual Rate in February.
 Click on graph for larger image.
This graph shows new home sales for 2020 and 2021 by month (Seasonally Adjusted Annual Rate).
The year-over-year comparisons are easy in early 2021 - especially in March and April.
However, sales will likely be down year-over-year in August through October - since the selling season was delayed in 2020.
And on inventory: note that completed inventory (3rd graph) is near record lows, but inventory under construction is closer to normal.
 On inventory, according to the Census Bureau:
This graph shows the months of supply by stage of construction..
The inventory of completed homes for sale was at 40 thousand in February was just above the record low of 37 thousand in 2013 (when sales were much lower). That is about 0.6 months of completed supply.
Earlier: New Home Sales decrease to 775,000 Annual Rate in February.
 Click on graph for larger image.
This graph shows new home sales for 2020 and 2021 by month (Seasonally Adjusted Annual Rate).
The year-over-year comparisons are easy in early 2021 - especially in March and April.
However, sales will likely be down year-over-year in August through October - since the selling season was delayed in 2020.
And on inventory: note that completed inventory (3rd graph) is near record lows, but inventory under construction is closer to normal.
 On inventory, according to the Census Bureau:
 "A house is considered for sale when a permit to build has been issued in permit-issuing places or work has begun on the footings or foundation in nonpermit areas and a sales contract has not been signed nor a deposit accepted."Starting in 1973 the Census Bureau broke this down into three categories: Not Started, Under Construction, and Completed.
This graph shows the months of supply by stage of construction..
The inventory of completed homes for sale was at 40 thousand in February was just above the record low of 37 thousand in 2013 (when sales were much lower). That is about 0.6 months of completed supply.
The inventory of new homes under construction, and not started, is about 4.2 months - close to normal.
New Home Sales decrease to 775,000 Annual Rate in February
by Calculated Risk on 3/23/2021 10:13:00 AM
The Census Bureau reports New Home Sales in February were at a seasonally adjusted annual rate (SAAR) of 775 thousand.
The previous three months were revised up.
Sales of new single-family houses in February 2021 were at a seasonally adjusted annual rate of 775,000, according to estimates released jointly today by the U.S. Census Bureau and the Department of Housing and Urban Development. This is 18.2 percent below the revised January rate of 948,000, but is 8.2 percent above the February 2020 estimate of 716,000.
emphasis added
 Click on graph for larger image.
The first graph shows New Home Sales vs. recessions since 1963. The dashed line is the current sales rate.
The last nine months saw the highest sales rates since 2006. This was decent year-over-year growth.
The second graph shows New Home Months of Supply.
 The months of supply increased in February to 4.8 months from 3.8 months in January.
 The all time record high was 12.1 months of supply in January 2009. The all time record low is 3.5 months, most recently in October 2020.
This is in the normal range (about 4 to 6 months supply is normal).
"The seasonally-adjusted estimate of new houses for sale at the end of February was 312,000. This represents a supply of 4.8 months at the current sales rate. "
 On inventory, according to the Census Bureau:
 "A house is considered for sale when a permit to build has been issued in permit-issuing places or work has begun on the footings or foundation in nonpermit areas and a sales contract has not been signed nor a deposit accepted."Starting in 1973 the Census Bureau broke this down into three categories: Not Started, Under Construction, and Completed.
The third graph shows the three categories of inventory starting in 1973.
The inventory of completed homes for sale is low, and the combined total of completed and under construction is a little lower than normal.
 The last graph shows sales NSA (monthly sales, not seasonally adjusted annual rate).
In February 2021 (red column), 64 thousand new homes were sold (NSA). Last year, 63 thousand homes were sold in February
The all time high for February was 109 thousand in 2005, and the all time low for February was 22 thousand in 2011.
This was well below expectations, however sales in the three previous months were revised up. I'll have more later today.
Black Knight: National Mortgage Delinquency Rate Increased in February
by Calculated Risk on 3/23/2021 09:03:00 AM
Note: Loans in forbearance are counted as delinquent in this survey, but those loans are not reported as delinquent to the credit bureaus.
From Black Knight: Black Knight’s First Look: Mortgage Delinquencies Rise for the First Time in Nine Months; Increase Largely Calendar-Driven but Bears Watching
• After eight consecutive months of improvement, the national mortgage delinquency rate rose in February from 5.85% to 6.0%According to Black Knight's First Look report, the percent of loans delinquent increased 2.6% in February compared to January, and increased 83% year-over-year.
• The rise was largely calendar-related, as February is both a short month and ended on a Sunday – cutting the days on which payments can be processed – which has historically impacted performance metrics
• Delinquency rate increases were seen broadly across portfolios, geographies and asset classes
• The increase was primarily seen in early-stage delinquencies, while the number of loans 90 or more days past due but not yet in foreclosure (including those in active forbearance) saw a modest decline
• Prepayment activity edged upward in February as well, but recent 30-year interest rate increases are likely to put downward pressure on prepayment rates in the coming months
• Both foreclosure starts and active foreclosure inventory again hit new record lows, as recently extended foreclosure moratoriums continue to suppress activity
emphasis added
The percent of loans in the foreclosure process decreased 1.1% in February and were down 30% over the last year.
Black Knight reported the U.S. mortgage delinquency rate (loans 30 or more days past due, but not in foreclosure) was 6.00% in February, up from 5.85% in January.
The percent of loans in the foreclosure process decreased slightly in February to 0.32%, from 0.32% in January.
The number of delinquent properties, but not in foreclosure, is up 1,449,000 properties year-over-year, and the number of properties in the foreclosure process is down 71,000 properties year-over-year.
| Black Knight: Percent Loans Delinquent and in Foreclosure Process | ||||
|---|---|---|---|---|
| Feb 2021 | Jan 2020 | Feb 2020 | Feb 2019 | |
| Delinquent | 6.00% | 5.85% | 3.28% | 3.89% |
| In Foreclosure | 0.32% | 0.32% | 0.45% | 0.51% |
| Number of properties: | ||||
| Number of properties that are delinquent, but not in foreclosure: | 3,186,000 | 3,130,000 | 1,737,000 | 2,019,000 |
| Number of properties in foreclosure pre-sale inventory: | 168,000 | 171,000 | 239,000 | 264,000 |
| Total Properties | 3,354,000 | 3,301,000 | 1,976,000 | 2,284,000 |
Monday, March 22, 2021
Tuesday: New Home Sales, Fed Chair Powell Testimony, Richmond Fed Mfg
by Calculated Risk on 3/22/2021 09:00:00 PM
From Matthew Graham at Mortgage News Daily: MBS RECAP: Not a Bad Day, But We Need More Convincing
Rates have tried to convince us that the worst is over on several occasions in the past few months. First it was 1.18%, then 1.38%, and most recently 1.63% (all in terms of 10yr yields), but all of those would-be ceilings quickly gave way to more weakness. 1.75% is now singing the same tune. ... [30 year fixed 3.43%]Tuesday:
emphasis added
• At 10:00 AM ET, New Home Sales for February from the Census Bureau. The consensus is for 885 thousand SAAR, down from 923 thousand in January.
• Also at 10:00 AM, Richmond Fed Survey of Manufacturing Activity for March.
• At 12:00 PM, Testimony, Fed Chair Powell, Coronavirus Aid, Relief, and Economic Security Act, Before the Committee on Financial Services, U.S. House of Representatives
March 22 COVID-19 Vaccinations, New Cases, Hospitalizations
by Calculated Risk on 3/22/2021 05:34:00 PM
According to the CDC, 126.5 million doses have been administered. 17.4% of the population over 18 is fully vaccinated, and 32% of the population over 18 has had at least one dose.
And check out COVID Act Now to see how each state is doing. (updated link to new site)
Almost 28,000 US deaths have been reported in March due to COVID.
 Click on graph for larger image.
This graph shows the daily (columns) 7 day average (line) of positive tests reported.
This data is from the CDC.
 Click on graph for larger image.
This graph shows the daily (columns) 7 day average (line) of positive tests reported.
This data is from the CDC.
The 7-day average is 54,241, well above the low following the summer surge of 35,000.
The second graph shows the number of people hospitalized.
 This data is also from the CDC.
The CDC cautions that due to reporting delays, the area in grey will probably increase.
The second graph shows the number of people hospitalized.
 This data is also from the CDC.
The CDC cautions that due to reporting delays, the area in grey will probably increase.
The current 7-day average is 33,302 well above the post-summer surge low of 23,000.
MBA Survey: "Share of Mortgage Loans in Forbearance Decreases to 5.05%"
by Calculated Risk on 3/22/2021 04:00:00 PM
Note: This is as of March 14th.
From the MBA: Share of Mortgage Loans in Forbearance Decreases to 5.05%
The Mortgage Bankers Association’s (MBA) latest Forbearance and Call Volume Survey revealed that the total number of loans now in forbearance decreased by 9 basis points from 5.14% of servicers’ portfolio volume in the prior week to 5.05% as of March 14, 2021. According to MBA’s estimate, 2.5 million homeowners are in forbearance plans.
...
“New forbearance requests decreased to their lowest level since last March. Combined with a steady pace of exits, this drop in new requests resulted in a larger decline in the share of loans in forbearance across all investor categories,” said Mike Fratantoni, MBA’s Senior Vice President and Chief Economist. “More than 11 percent of borrowers in forbearance have now exceeded the 12-month mark. We anticipate that servicers will be busy over the next month, with many homeowners opting for the extension for up to 18 months recently made available for federally-backed loans.”
Fratantoni added, “The pace of economic activity is picking up as the vaccine rollout continues. We expect that a stronger job market will help many successfully exit forbearance in the months ahead.”
emphasis added
 Click on graph for larger image.
This graph shows the percent of portfolio in forbearance by investor type over time. Most of the increase was in late March and early April, and has trended down since then.
The MBA notes: "Total weekly forbearance requests as a percent of servicing portfolio volume (#) decreased relative to the prior week: from 0.07% to 0.05%, the lowest level since the week ending March 15, 2020."
Housing Inventory March 22nd Update: At Record Lows
by Calculated Risk on 3/22/2021 01:31:00 PM
One of the key questions for 2021 is: Will inventory increase as the pandemic subsides, or will inventory decrease further in 2021?
Tracking inventory will be very important this year.
 Click on graph for larger image in graph gallery.
This inventory graph is courtesy of Altos Research.
As of March 19th, inventory was at 316 thousand (7 day average), compared to 738 thousand the same week a year ago. That is a decline of 57%.
A week ago, inventory was at 317 thousand, and was down 57% YoY. Seasonally, inventory should bottom soon.
Mike Simonsen discusses this data regularly on Youtube.
Mike Simonsen discusses this data regularly on Youtube.
Comments on February Existing Home Sales
by Calculated Risk on 3/22/2021 12:09:00 PM
Earlier: NAR: Existing-Home Sales Decreased to 6.22 million in February
A few key points:
1) This was the highest sales rate for February since 2006, and the 2rd highest sales for February on record. Some of the increase over the last eight months was probably related to pent up demand from the shutdowns in March and April. Other reasons include record low mortgage rates, a move away from multi-family rentals, strong second home buying (to escape the high-density cities), a strong stock market and favorable demographics.
The delay in the buying season has pushed the seasonally adjusted number to very high levels.
For example, assuming the buying season was shifted three months by the pandemic, this number of sales, Not Seasonally Adjusted (NSA) in November, would have given a 4.9 million Seasonally Adjusted Annual Rate (SAAR), as opposed to the reported 6.22 million SAAR for February. So the delay in the 2020 buying season is probably a factor in the headline number being so high.
2) Inventory is very low, and was down 29.5% year-over-year (YoY) in January. Also, as housing economist Tom Lawler has noted, the local MLS data shows even a larger decline in active inventory (the NAR appears to include some pending sales in inventory). Lawler noted:
Months-of-supply is just above the record low set in December 2020 and January 2021. Inventory will be important to watch in 2021, see: Some thoughts on Housing Inventory
This also means there are going to be some difficult comparisons in the second half of 2021!
2) Inventory is very low, and was down 29.5% year-over-year (YoY) in January. Also, as housing economist Tom Lawler has noted, the local MLS data shows even a larger decline in active inventory (the NAR appears to include some pending sales in inventory). Lawler noted:
"As I’ve noted before, the inventory measure in most publicly-released local realtor/MLS reports excludes listings with pending contracts, but that is not the case for many of the reports sent to the NAR (referred to as the “NAR Report!”), Since the middle of last Spring inventory measures excluding pending listings have fallen much more sharply than inventory measures including such listings, and this latter inventory measure understates the decline in the effective inventory of homes for sale over the last several months."
It seems likely that active inventory is down close to 50% year-over-year.
3) As usual, housing economist Tom Lawler's forecast was closer to the NAR report than the Consensus. The NAR reported 6.22 million SAAR, Lawler estimated the NAR would report 6.29 million SAAR, and the consensus was 6.50 million SAAR.
 Click on graph for larger image.
This graph shows existing home sales by month for 2020 and 2021.
The year-over-year comparisons will be easy in the first half of 2021 - especially in April, May and June - and then difficult in the second half of the year.
The second graph shows existing home sales for each month, Not Seasonally Adjusted (NSA), since 2005.
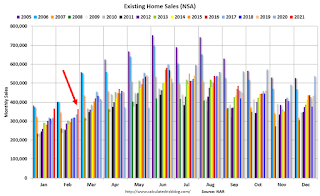 Sales NSA in February (364,000) were 8.7% above sales last year in February (335,000).
This was the highest sales for February (NSA) since 2006.
NAR: Existing-Home Sales Decreased to 6.22 million in February
by Calculated Risk on 3/22/2021 10:09:00 AM
From the NAR: Existing-Home Sales Descend 6.6% in February
Total existing-home sales, completed transactions that include single-family homes, townhomes, condominiums and co-ops, decreased 6.6% from January to a seasonally-adjusted annual rate of 6.22 million in February. Sales in total climbed year-over-year, up 9.1% from a year ago (5.70 million in February 2020).Note: January was revised down from 6.69 million to 6.66 million SAAR.
Total housing inventory at the end of February amounted to 1.03 million units, equal to January’s inventory and down 29.5% from one year ago (1.46 million). Unsold inventory sits at a 2.0-month supply at the current sales pace, slightly up from January’s 1.9-month supply and down from the 3.1-month amount recorded in February 2020. NAR first began tracking the single-family home supply in 1982.
emphasis added
 Click on graph for larger image.
This graph shows existing home sales, on a Seasonally Adjusted Annual Rate (SAAR) basis since 1993.
Sales in February (6.22 million SAAR) were down 6.6% from last month, and were 9.1% above the February 2020 sales rate.
The second graph shows nationwide inventory for existing homes.
 According to the NAR, inventory was unchanged at 1.03 million in February from 1.03 million in January. Headline inventory is not seasonally adjusted, and inventory usually decreases to the seasonal lows in December and January, and peaks in mid-to-late summer.
The last graph shows the year-over-year (YoY) change in reported existing home inventory and months-of-supply. Since inventory is not seasonally adjusted, it really helps to look at the YoY change. Note: Months-of-supply is based on the seasonally adjusted sales and not seasonally adjusted inventory.
 Inventory was down 29.5% year-over-year in February compared to February 2020.
 Months of supply was increased to 2.0 months in February from 1.9 months in January (tied for all time low).
This was below the consensus forecast. I'll have more later.
Seven High Frequency Indicators for the Economy
by Calculated Risk on 3/22/2021 08:17:00 AM
These indicators are mostly for travel and entertainment. It will interesting to watch these sectors recover as the vaccine is distributed.
IMPORTANT: Be safe now - if all goes well, we could all be vaccinated by Q2 2021.
----- Airlines: Transportation Security Administration -----
The TSA is providing daily travel numbers.
 Click on graph for larger image.
This data shows the seven day average of daily total traveler throughput from the TSA for 2019 (Light Blue), 2020 (Blue) and 2021 (Red).
The dashed line is the percent of 2019 for the seven day average.
This data is as of March 21st.
The seven day average is down 44.6% from the same week in 2019 (55.4% of last year). (Dashed line)
There was a slow increase from the bottom, with ups and downs due to the holidays - and TSA data has moved up in 2021.
----- Restaurants: OpenTable -----
The second graph shows the 7 day average of the year-over-year change in diners as tabulated by OpenTable for the US and several selected cities.
----- Hotel Occupancy: STR -----
 This graph shows the seasonal pattern for the hotel occupancy rate using the four week average.
The red line is for 2021, black is 2020, blue is the median, and dashed light blue is for 2009 (the worst year since the Great Depression for hotels - before 2020).
Even when occupancy increases to 2009 levels, hotels will still be hurting.
This data is through March 13th. Hotel occupancy is currently down 1.4% year-over-year (down 25.8% compared to same week in 2019). Starting next week, occupancy will be up year-over-year, since occupancy declined sharply at the onset of the pandemic. However, occupancy will still be down significantly from normal levels.
Notes: Y-axis doesn't start at zero to better show the seasonal change.
----- Gasoline Supplied: Energy Information Administration -----
 This graph, based on weekly data from the U.S. Energy Information Administration (EIA), shows gasoline supplied compared to the same week of 2019.
Blue is for 2020. Red is for 2021.
As of March 12th, gasoline supplied was off about 10.3% (about 89.7% of the same week in 2019).
Gasoline supplied will be up year-over-year soon, since at one point, gasoline supplied was off almost 50% YoY in 2020.
----- Transit: Apple Mobility -----
This graph is from Apple mobility. From Apple: "This data is generated by counting the number of requests made to Apple Maps for directions in select countries/regions, sub-regions, and cities." This is just a general guide - people that regularly commute probably don't ask for directions.
There is also some great data on mobility from the Dallas Fed Mobility and Engagement Index. However the index is set "relative to its weekday-specific average over January–February", and is not seasonally adjusted, so we can't tell if an increase in mobility is due to recovery or just the normal increase in the Spring and Summer.
 This data is through March 20th for the United States and several selected cities.
The graph is the running 7 day average to remove the impact of weekends.
IMPORTANT: All data is relative to January 13, 2020. This data is NOT Seasonally Adjusted. People walk and drive more when the weather is nice, so I'm just using the transit data.
According to the Apple data directions requests, public transit in the 7 day average for the US is at 59% of the January 2020 level. It is at 52% in Chicago, and 60% in Houston (the Houston dip was a weather related decline) - and moving up recently.
----- New York City Subway Usage -----
Here is some interesting data on New York subway usage (HT BR).
 This graph is from Todd W Schneider. This is weekly data since 2015.
The TSA is providing daily travel numbers.
 Click on graph for larger image.
This data shows the seven day average of daily total traveler throughput from the TSA for 2019 (Light Blue), 2020 (Blue) and 2021 (Red).
The dashed line is the percent of 2019 for the seven day average.
This data is as of March 21st.
The seven day average is down 44.6% from the same week in 2019 (55.4% of last year). (Dashed line)
There was a slow increase from the bottom, with ups and downs due to the holidays - and TSA data has moved up in 2021.
The second graph shows the 7 day average of the year-over-year change in diners as tabulated by OpenTable for the US and several selected cities.
IMPORTANT: OpenTable notes: "we’ve updated the data including downloadable dataset from January 1, 2021 onward to compare seated diners from 2021 to 2019, as opposed to year over year." Thanks!
 Thanks to OpenTable for providing this restaurant data:
This data is updated through March 20, 2021.
This data is "a sample of restaurants on the OpenTable network across all channels: online reservations, phone reservations, and walk-ins. For year-over-year comparisons by day, we compare to the same day of the week from the same week in the previous year."
Note that this data is for "only the restaurants that have chosen to reopen in a given market". Since some restaurants have not reopened, the actual year-over-year decline is worse than shown.
Dining picked up during the holidays, then slumped with the huge winter surge in cases. Dining is picking up again - and is actually up compared to 2019 in Texas.
----- Movie Tickets: Box Office Mojo -----
 This data shows domestic box office for each week and the median for the years 2016 through 2019 (dashed light blue).
 Thanks to OpenTable for providing this restaurant data:
This data is updated through March 20, 2021.
This data is "a sample of restaurants on the OpenTable network across all channels: online reservations, phone reservations, and walk-ins. For year-over-year comparisons by day, we compare to the same day of the week from the same week in the previous year."
Note that this data is for "only the restaurants that have chosen to reopen in a given market". Since some restaurants have not reopened, the actual year-over-year decline is worse than shown.
Dining picked up during the holidays, then slumped with the huge winter surge in cases. Dining is picking up again - and is actually up compared to 2019 in Texas.
 This data shows domestic box office for each week and the median for the years 2016 through 2019 (dashed light blue).
 Blue is 2020 and Red is 2021.
The data is from BoxOfficeMojo through Mar 18th.
Note that the data is usually noisy week-to-week and depends on when blockbusters are released.
Movie ticket sales were at $17 million last week, down about 91% from the median for the week.
Note that the data is usually noisy week-to-week and depends on when blockbusters are released.
Movie ticket sales were at $17 million last week, down about 91% from the median for the week.
 This graph shows the seasonal pattern for the hotel occupancy rate using the four week average.
 The red line is for 2021, black is 2020, blue is the median, and dashed light blue is for 2009 (the worst year since the Great Depression for hotels - before 2020).
Even when occupancy increases to 2009 levels, hotels will still be hurting.
This data is through March 13th. Hotel occupancy is currently down 1.4% year-over-year (down 25.8% compared to same week in 2019). Starting next week, occupancy will be up year-over-year, since occupancy declined sharply at the onset of the pandemic. However, occupancy will still be down significantly from normal levels.
Notes: Y-axis doesn't start at zero to better show the seasonal change.
 This graph, based on weekly data from the U.S. Energy Information Administration (EIA), shows gasoline supplied compared to the same week of 2019.
Blue is for 2020. Red is for 2021.
As of March 12th, gasoline supplied was off about 10.3% (about 89.7% of the same week in 2019).
Gasoline supplied will be up year-over-year soon, since at one point, gasoline supplied was off almost 50% YoY in 2020.
This graph is from Apple mobility. From Apple: "This data is generated by counting the number of requests made to Apple Maps for directions in select countries/regions, sub-regions, and cities." This is just a general guide - people that regularly commute probably don't ask for directions.
There is also some great data on mobility from the Dallas Fed Mobility and Engagement Index. However the index is set "relative to its weekday-specific average over January–February", and is not seasonally adjusted, so we can't tell if an increase in mobility is due to recovery or just the normal increase in the Spring and Summer.
 This data is through March 20th for the United States and several selected cities.
The graph is the running 7 day average to remove the impact of weekends.
IMPORTANT: All data is relative to January 13, 2020. This data is NOT Seasonally Adjusted. People walk and drive more when the weather is nice, so I'm just using the transit data.
According to the Apple data directions requests, public transit in the 7 day average for the US is at 59% of the January 2020 level. It is at 52% in Chicago, and 60% in Houston (the Houston dip was a weather related decline) - and moving up recently.
Here is some interesting data on New York subway usage (HT BR).
 This graph is from Todd W Schneider. This is weekly data since 2015.
 Most weeks are between 30 and 35 million entries, and currently there are under 10 million subway turnstile entries per week.
This data is through Friday, March 19th.
Schneider has graphs for each borough, and links to all the data sources.
He notes: "Data updates weekly from the MTA’s public turnstile data, usually on Saturday mornings".
This data is through Friday, March 19th.
Schneider has graphs for each borough, and links to all the data sources.
He notes: "Data updates weekly from the MTA’s public turnstile data, usually on Saturday mornings".


