 RSS Feed
 by Calculated Risk on 12/22/2020 08:26:00 PM
Tuesday, December 22, 2020
December 22 COVID-19 Test Results; Record Hospitalizations, Record 7-Day Deaths
Note: The week-over-week growth in positive cases has slowed. Hopefully that continues.
The US is now averaging close to 2 million tests per day. Based on the experience of other countries, for adequate test-and-trace (and isolation) to reduce infections, the percent positive needs to be under 5% (probably close to 1%), so the US has far too many daily cases - and percent positive - to do effective test-and-trace.
There were 1,688,785 test results reported over the last 24 hours.
There were 188,614 positive tests.
Over 54,000 US deaths have been reported so far in December. See the graph on US Daily Deaths here.
 Click on graph for larger image.
This data is from the COVID Tracking Project.
The percent positive over the last 24 hours was 11.2% (red line is 7 day average). The percent positive is calculated by dividing positive results by total tests (including pending).
And check out COVID Act Now to see how each state is doing. (updated link to new site)
 The second graph shows the 7 day average of positive tests reported and daily hospitalizations.
• Record Hospitalizations
• Record 7 Day Average Deaths
Freddie Mac: Mortgage Serious Delinquency Rate decreased in November
by Calculated Risk on 12/22/2020 05:46:00 PM
Freddie Mac reported that the Single-Family serious delinquency rate in November was 2.75%, down from 2.89% in October. Freddie's rate is up from 0.62% in November 2019.
Freddie's serious delinquency rate peaked in February 2010 at 4.20%.
These are mortgage loans that are "three monthly payments or more past due or in foreclosure".
 Click on graph for larger image
Mortgages in forbearance are being counted as delinquent in this monthly report, but they will not be reported to the credit bureaus.
This is very different from the increase in delinquencies following the housing bubble. Lending standards have been fairly solid over the last decade, and most of these homeowners have equity in their homes - and they will be able to restructure their loans once (if) they are employed.
Note: Fannie Mae will report for November soon.
Also - for multifamily - delinquencies were at 0.16%, up from 0.14% in October, and up more than double from 0.06% in November 2019.
NMHC: Rent Payment Tracker Shows Households Paying Rent Decreased 3.4% YoY
by Calculated Risk on 12/22/2020 03:22:00 PM
From the NMHC: NMHC Rent Payment Tracker Finds 89.8 Percent of Apartment Households Paid Rent as of December 20
The National Multifamily Housing Council (NMHC)’s Rent Payment Tracker found 89.8 percent of apartment households made a full or partial rent payment by December 20 in its survey of 11.5 million units of professionally managed apartment units across the country.
This is a 3.4 percentage point, or 392,952 household decrease from the share who paid rent through December 20, 2019 and compares to 90.3 percent that had paid by November 20, 2020. These data encompass a wide variety of market-rate rental properties across the United States, which can vary by size, type and average rental price.
emphasis added
This graph from the NMHC Rent Payment Tracker shows the percent of household making full or partial rent payments by the 6th (dark color) and 20th (light color) of the month.
This is mostly for large, professionally managed properties.
The new disaster relief should help people make their rent payments.
Comments on November Existing Home Sales
by Calculated Risk on 12/22/2020 12:22:00 PM
Earlier: NAR: Existing-Home Sales Decreased to 6.69 million in November
A few key points:
1) This was the highest sales rate for November since 2005. Some of the increase over the last several months was probably related to pent up demand from the shutdowns in March and April. Other reasons include record low mortgage rates, a move away from multi-family rentals, strong second home buying (to escape the high-density cities) and favorable demographics.
The delay in the buying season has pushed the seasonally adjusted number to very high levels. For example, this number of sales, Not Seasonally Adjusted (NSA) in August, would have given a 5 million Seasonally Adjusted Annual Rate (SAAR), as opposed to 6.7 million. So the delay in the buying season is a factor in the headline number being so high.
2) Inventory is very low, and was down 22% year-over-year (YoY) in November. This is the lowest level of inventory for November since at least the early 1990s. Months-of-supply is at a record low. Inventory will be important to watch in 2021, see: Some thoughts on Housing Inventory
 Click on graph for larger image.
This graph shows existing home sales by month for 2019 and 2020.
Note that existing home sales picked up somewhat in the second half of 2019 as interest rates declined.
Even with weak sales in April, May, and June, sales to date are up about 4% compared to the same period in 2019.
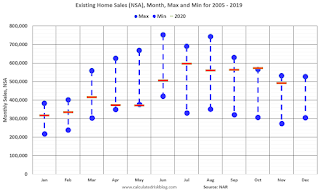 The second graph shows existing home sales Not Seasonally Adjusted (NSA) by month (Red dashes are 2020), and the minimum and maximum for 2005 through 2019.
Sales NSA in November (492,000) were 22% above sales last year in November (404,000). This was the highest sales for November (NSA) since 2005.
There are going to be some difficult comparisons in the second half of next year!
2) Inventory is very low, and was down 22% year-over-year (YoY) in November. This is the lowest level of inventory for November since at least the early 1990s. Months-of-supply is at a record low. Inventory will be important to watch in 2021, see: Some thoughts on Housing Inventory
 Click on graph for larger image.
This graph shows existing home sales by month for 2019 and 2020.
Note that existing home sales picked up somewhat in the second half of 2019 as interest rates declined.
Even with weak sales in April, May, and June, sales to date are up about 4% compared to the same period in 2019.
 The second graph shows existing home sales Not Seasonally Adjusted (NSA) by month (Red dashes are 2020), and the minimum and maximum for 2005 through 2019.
Sales NSA in November (492,000) were 22% above sales last year in November (404,000). This was the highest sales for November (NSA) since 2005.
NAR: Existing-Home Sales Decreased to 6.69 million in November
by Calculated Risk on 12/22/2020 10:14:00 AM
From the NAR: Existing-Home Sales Decrease 2.5% in November
Total existing-home sales, completed transactions that include single-family homes, townhomes, condominiums and co-ops, decreased 2.5% from October to a seasonally-adjusted annual rate of 6.69 million in November. However, sales in total rose year-over-year, up 25.8% from a year ago (5.32 million in November 2019).
...
Total housing inventory at the end of November totaled 1.28 million units, down 9.9% from October and down 22% from one year ago (1.64 million). Unsold inventory sits at an all-time low 2.3-month supply at the current sales pace, down from 2.5 months in October and down from the 3.7-month figure recorded in November 2019.
emphasis added
 Click on graph for larger image.
This graph shows existing home sales, on a Seasonally Adjusted Annual Rate (SAAR) basis since 1993.
Sales in November (6.69 million SAAR) were down 2.5% from last month, and were 25.8% above the November 2019 sales rate.
The second graph shows nationwide inventory for existing homes.
 According to the NAR, inventory decreased to 1.28 million in November from 1.42 million in October. Headline inventory is not seasonally adjusted, and inventory usually decreases to the seasonal lows in December and January, and peaks in mid-to-late summer.
The last graph shows the year-over-year (YoY) change in reported existing home inventory and months-of-supply. Since inventory is not seasonally adjusted, it really helps to look at the YoY change. Note: Months-of-supply is based on the seasonally adjusted sales and not seasonally adjusted inventory.
 Inventory was down 22% year-over-year in November compared to November 2019.
 Months of supply decreased to 2.3 months in November (an all time low).
This was close to the consensus forecast. I'll have more later.
Q3 GDP Growth Revised up slightly to 33.4% Annual Rate
by Calculated Risk on 12/22/2020 08:35:00 AM
From the BEA: Gross Domestic Product (Third Estimate), Corporate Profits (Revised), and GDP by Industry, Third Quarter 2020
Real gross domestic product (GDP) increased at an annual rate of 33.4 percent in the third quarter of 2020, according to the "third" estimate released by the Bureau of Economic Analysis. In the second quarter, real GDP decreased 31.4 percent.Here is a Comparison of Third and Second Estimates. PCE growth was revised up to 41.0% from 40.6%. Residential investment was revised up from 62.3% to 63.0%. This was at the consensus forecast.
The “third” estimate of GDP released today is based on more complete source data than were available for the "second" estimate issued last month. In the second estimate, the increase in real GDP was 33.1 percent. The upward revision primarily reflected larger increases in personal consumption expenditures (PCE) and nonresidential fixed investment
emphasis added
Monday, December 21, 2020
Tuesday: Existing Home Sales, Q3 GDP
by Calculated Risk on 12/21/2020 09:27:00 PM
Tuesday:
• At 8:30 AM ET, Gross Domestic Product, 3nd quarter 2020 (Third estimate). The consensus is that real GDP increased 33.1% annualized in Q3, unchanged from the second estimate of GDP.
• At 10:00 AM, Existing Home Sales for November from the National Association of Realtors (NAR). The consensus is for 6.70 million SAAR, down from 6.85 million. Housing economist Tom Lawler expects the NAR to report sales of 6.50 million SAAR for November.
• Also at 10:00 AM, Richmond Fed Survey of Manufacturing Activity for December.
December 21 COVID-19 Test Results; Record Hospitalizations, Record 7-Day Deaths
by Calculated Risk on 12/21/2020 07:12:00 PM
Note: The week-over-week growth in positive cases has slowed. Hopefully that continues.
The US is now averaging close to 2 million tests per day. Based on the experience of other countries, for adequate test-and-trace (and isolation) to reduce infections, the percent positive needs to be under 5% (probably close to 1%), so the US has far too many daily cases - and percent positive - to do effective test-and-trace.
There were 2,076,374 test results reported over the last 24 hours.
There were 178,191 positive tests.
Over 51,000 US deaths have been reported so far in December. See the graph on US Daily Deaths here.
 Click on graph for larger image.
This data is from the COVID Tracking Project.
The percent positive over the last 24 hours was 8.6% (red line is 7 day average). The percent positive is calculated by dividing positive results by total tests (including pending).
And check out COVID Act Now to see how each state is doing. (updated link to new site)
 The second graph shows the 7 day average of positive tests reported and daily hospitalizations.
• Record Hospitalizations
• Record 7 Day Average Deaths
December Vehicle Sales Forecast: "Rise Slightly from November"; Annual Sales Down 16% from 2019
by Calculated Risk on 12/21/2020 04:34:00 PM
From Wards: December U.S. Light-Vehicle Sales Forecast to Rise Slightly from November (pay content)
 Click on graph for larger image.
This graph shows actual sales from the BEA (Blue), and Wards forecast for December (Red).
Sales have bounced back from the April low, but will likely be down around 6% year-over-year in December.
The Wards forecast of 15.8 million SAAR, would be up about 2% from November.
This would put annual sales in 2020 down about 16% compared to 2019.
MBA Survey: "Share of Mortgage Loans in Forbearance Increases to 5.49%"
by Calculated Risk on 12/21/2020 04:00:00 PM
Note: This is as of December 13th.
From the MBA: Share of Mortgage Loans in Forbearance Increases to 5.49%
The Mortgage Bankers Association’s (MBA) latest Forbearance and Call Volume Survey revealed that the total number of loans now in forbearance increased slightly from 5.48% of servicers’ portfolio volume in the prior week to 5.49% as of December 13, 2020. According to MBA’s estimate, 2.7 million homeowners are in forbearance plans.
...
The share of loans in forbearance has stayed fairly level since early November, often with small decreases in the GSE loan share and increases for Ginnie Mae loans. That was the case last week. Additionally, forbearance requests from Ginnie Mae borrowers reached the highest level since the week ending June 14,” said Mike Fratantoni, MBA’s Senior Vice President and Chief Economist. “Additional restrictions on businesses and rising COVID-19 cases are causing a renewed increase in layoffs and other signs of slowing economic activity. These troubling trends will likely result in more homeowners seeking relief.”
...
By stage, 18.78% of total loans in forbearance are in the initial forbearance plan stage, while 78.54% are in a forbearance extension. The remaining 2.69% are forbearance re-entries.
emphasis added
 Click on graph for larger image.
This graph shows the percent of portfolio in forbearance by investor type over time. Most of the increase was in late March and early April, and has generally been trending down.
The MBA notes: "Weekly forbearance requests as a percent of servicing portfolio volume (#) remained flat from the previous week at 0.12 percent."


