 RSS Feed
 by Calculated Risk on 11/05/2020 02:04:00 PM
Thursday, November 05, 2020
FOMC Statement: No Change
Fed Chair Powell press conference video here starting at 2:30 PM ET.
FOMC Statement:
The Federal Reserve is committed to using its full range of tools to support the U.S. economy in this challenging time, thereby promoting its maximum employment and price stability goals.
The COVID-19 pandemic is causing tremendous human and economic hardship across the United States and around the world. Economic activity and employment have continued to recover but remain well below their levels at the beginning of the year. Weaker demand and earlier declines in oil prices have been holding down consumer price inflation. Overall financial conditions remain accommodative, in part reflecting policy measures to support the economy and the flow of credit to U.S. households and businesses.
The path of the economy will depend significantly on the course of the virus. The ongoing public health crisis will continue to weigh on economic activity, employment, and inflation in the near term, and poses considerable risks to the economic outlook over the medium term.
The Committee seeks to achieve maximum employment and inflation at the rate of 2 percent over the longer run. With inflation running persistently below this longer-run goal, the Committee will aim to achieve inflation moderately above 2 percent for some time so that inflation averages 2 percent over time and longer-term inflation expectations remain well anchored at 2 percent. The Committee expects to maintain an accommodative stance of monetary policy until these outcomes are achieved. The Committee decided to keep the target range for the federal funds rate at 0 to 1/4 percent and expects it will be appropriate to maintain this target range until labor market conditions have reached levels consistent with the Committee's assessments of maximum employment and inflation has risen to 2 percent and is on track to moderately exceed 2 percent for some time. In addition, over coming months the Federal Reserve will increase its holdings of Treasury securities and agency mortgage-backed securities at least at the current pace to sustain smooth market functioning and help foster accommodative financial conditions, thereby supporting the flow of credit to households and businesses.
In assessing the appropriate stance of monetary policy, the Committee will continue to monitor the implications of incoming information for the economic outlook. The Committee would be prepared to adjust the stance of monetary policy as appropriate if risks emerge that could impede the attainment of the Committee's goals. The Committee's assessments will take into account a wide range of information, including readings on public health, labor market conditions, inflation pressures and inflation expectations, and financial and international developments.
Voting for the monetary policy action were Jerome H. Powell, Chair; John C. Williams, Vice Chair; Michelle W. Bowman; Lael Brainard; Richard H. Clarida; Mary C. Daly; Patrick Harker; Robert S. Kaplan; Loretta J. Mester; and Randal K. Quarles. Ms. Daly voted as an alternate member at this meeting.
emphasis added
October Employment Preview
by Calculated Risk on 11/05/2020 10:58:00 AM
On Friday at 8:30 AM ET, the BLS will release the employment report for October. The consensus is for 600 thousand jobs added, and for the unemployment rate to decrease to 7.6%.
• Decennial Census: The decennial Census will subtract 147,311 temporary jobs.
• ADP Report: The ADP employment report showed a gain of 365,000 private sector jobs, well below the consensus estimate of 650 thousand jobs. The ADP report hasn't been very useful in predicting the BLS report, but this suggests the BLS report could be weaker than expected.
• ISM Surveys: The ISM manufacturing employment index increased in October to 53.2% from 49.6% in September, and is finally above 50. This would suggest essentially no change in manufacturing jobs in October - although ADP showed 7,000 manufacturing jobs added.
The ISM Services employment index decreased in October to 50.1% from 51.8% in October, and is just above 50. This would suggest around 75,000 service jobs added in October. Combined, the ISM surveys suggest around 75,000 private sector jobs added in October. The ISM surveys haven't been as useful as usual during the pandemic, but this does suggest the report could be weaker than expected.
• Unemployment Claims: The weekly claims report showed a high number of total continuing unemployment claims during the reference week, although this might not be very useful right now. If we did a "Rip Van Winkle", and saw the weekly claims report this morning, we'd think the economy was in a deep recession!
• Homebase, Kronos/UKG: There are other indicators that analysts are looking at - like Homebase hours worked and Kronos (see Ernie Tedeschi comments).
 Click on graph for larger image.
"Data from Homebase, Kronos/UKG, and UI claims since mid-September would be consistent with +801K jobs created in October, seasonally-adjusted.• Seasonal Retail Hiring: Typically retail companies start hiring for the holiday season in October, and really increase hiring in November. Here is a graph that shows the historical net retail jobs added for October, November and December by year.
That number would be very modestly above September's pace of +661K.
But, of course, the uncertainty here is large."
 Click on graph for larger image.
In 2019, retailers hired 161,000 seasonal employees (NSA) in October. This translated to a gain of 22,000 SA. Brick and Mortar retailers could be more cautious this year, and retail might decline SA in October.
There could even be a larger impact in November. In 2019, retailers hired 432,000 temporary employees NSA in November, and this translated to a loss of 14,000 jobs SA. This will be something to watch.
 • Permanent Job Losers: Something to watch in the employment report will be "Permanent job losers". While there has been a strong bounce back in total employment, from the shutdown in March and April, permanent job losers have continued to increase.
This graph shows permanent job losers as a percent of the pre-recession peak in employment through the September report.
This data is only available back to 1994, so there is only data for three recessions. In September, the number of permanent job losers increased to 3.756 million from 3.411 million in August.
• Merrill Lynch forecast: "The October jobs report will likely reveal a moderation in nonfarm payroll growth to 625k, down from 661k in September. Census workers will contribute a notable drag – excluding government, we expect solid private payroll growth of 800k. The unemployment rate will likely improve to 7.6% from 7.9% in September."
• Conclusion: The employment related data has been all over the place, but most of the indicators suggest a weaker report in October than in September. My guess is the report will be lower than the consensus.
Weekly Initial Unemployment Claims at 751,000
by Calculated Risk on 11/05/2020 08:38:00 AM
The DOL reported:
In the week ending October 31, the advance figure for seasonally adjusted initial claims was 751,000, a decrease of 7,000 from the previous week's revised level. The previous week's level was revised up by 7,000 from 751,000 to 758,000. The 4-week moving average was 787,000, a decrease of 4,000 from the previous week's revised average. The previous week's average was revised up by 3,250 from 787,750 to 791,000.This does not include the 362,883 initial claims for Pandemic Unemployment Assistance (PUA) that was up from 359,044 the previous week. (There are some questions on PUA numbers).
emphasis added
The following graph shows the 4-week moving average of weekly claims since 1971.
 Click on graph for larger image.
The dashed line on the graph is the current 4-week average. The four-week average of weekly unemployment claims decreased to 787,000.
The previous week was revised up.
The second graph shows seasonally adjust continued claims since 1967 (lags initial by one week).
 At the worst of the Great Recession, continued claims peaked at 6.635 million, but then steadily declined.
Continued claims decreased to 7,285,000 (SA) from 7,823,000 (SA) last week and will likely stay at a high level until the crisis abates.
Note: There are an additional 9,332,610 receiving Pandemic Unemployment Assistance (PUA) that decreased from 10,324,779 the previous week (there are questions about these numbers). This is a special program for business owners, self-employed, independent contractors or gig workers not receiving other unemployment insurance.
An additional 3,961,060 are receiving Pandemic Emergency Unemployment Compensation (PEUC) that increased from 3,683,496 the previous week.
Wednesday, November 04, 2020
Thursday: FOMC Announcement, Unemployment Claims
by Calculated Risk on 11/04/2020 09:00:00 PM
Thursday:
• At 8:30 AM ET, The initial weekly unemployment claims report will be released. The consensus is initial claims decreased to 725 thousand from 751 thousand last week.
• At 2:00 PM, FOMC Meeting Announcement. No change in policy is expected at this meeting..
• At 2:30 PM, Fed Chair Jerome Powell holds a press briefing following the FOMC announcement.
November 4 COVID-19 Test Results; Over 100,000 Cases Reported Today
by Calculated Risk on 11/04/2020 07:04:00 PM
Note: I look forward to when I will not be posting this daily!
The US is now averaging close to 1 million tests per day. Based on the experience of other countries, for adequate test-and-trace (and isolation) to reduce infections, the percent positive needs to be well under 5% (probably close to 1%), so the US still needs to increase the number of tests per day significantly (or take actions to push down the number of new infections).
There were 966,851 test results reported over the last 24 hours.
There were 103,087 positive tests. (New record)
Over 3,500 US deaths have been reported so far in November. See the graph on US Daily Deaths here.
 Click on graph for larger image.
This data is from the COVID Tracking Project.
The percent positive over the last 24 hours was 10.7% (red line is 7 day average).
For the status of contact tracing by state, check out testandtrace.com.
And check out COVID Exit Strategy to see how each state is doing.
 The second graph shows the 7 day average of positive tests reported.
The dashed line is the July high.
Note that there were very few tests available in March and April, and many cases were missed (the percent positive was very high - see first graph). By June, the percent positive had dropped below 5%.
This is a new record 7-day average cases for the USA.
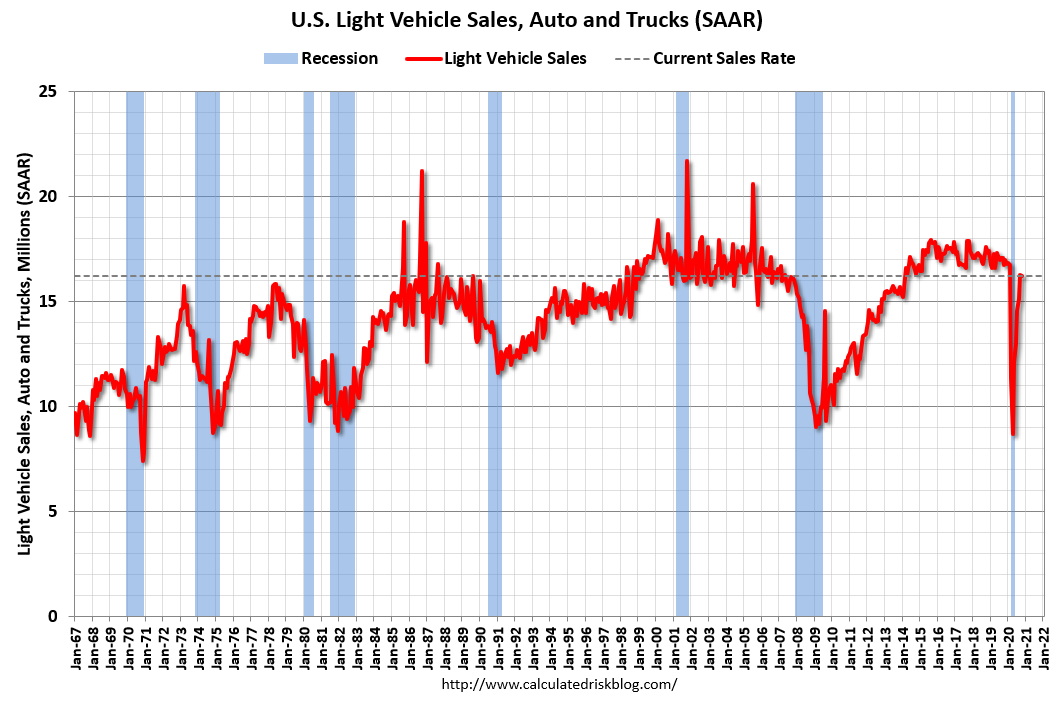
October Vehicles Sales decreased to 16.2 Million SAAR
by Calculated Risk on 11/04/2020 11:26:00 AM
The BEA released their estimate of light vehicle sales for October this morning. The BEA estimates sales of 16.21 million SAAR in October 2020 (Seasonally Adjusted Annual Rate), down 0.5% from the September sales rate, and down 3.3% from October 2019.
This was below the consensus estimate of 16.5 million SAAR.
 Click on graph for larger image.
This graph shows light vehicle sales since 2006 from the BEA (blue) and the BEA's estimate for October (red).
The impact of COVID-19 was significant, and April was the worst month.
Since April, sales have increased, but are still down 3.3% from last year.
The second graph shows light vehicle sales since the BEA started keeping data in 1967.
 Note: dashed line is current estimated sales rate of 16.21 million SAAR.
Sales-to-date are down 17.3% in 2020 compared to the same period in 2019.
In 2019, there were 14.48 million light vehicle sales through October. In 2020, there have been 11.97 million sales.
ISM Services Index Decreased to 56.6% in October
by Calculated Risk on 11/04/2020 10:08:00 AM
The October ISM Services index was at 56.6%, down from 57.8% last month. The employment index decreased to 50.1%, from 51.8%. Note: Above 50 indicates expansion, below 50 contraction.
From the Institute for Supply Management: Services PMI™ at 56.6%; October 2020 Services ISM® Report On Business®
Business Activity Index at 61.2%; New Orders Index at 58.8%; Employment Index at 50.1%; Supplier Deliveries Index at 56.2%This was below the consensus forecast, and the employment index was barely above 50.
Economic activity in the services sector grew in October for the fifth month in a row, say the nation's purchasing and supply executives in the latest Services ISM® Report On Business®.
The report was issued today by Anthony Nieves, CPSM, C.P.M., A.P.P., CFPM, Chair of the Institute for Supply Management® (ISM®) Services Business Survey Committee: "The Services PMI™ registered 56.6 percent, 1.2 percentage points lower than the September reading of 57.8 percent. This reading represents a fifth straight month of growth for the services sector, which has expanded for all but two of the last 129 months.
emphasis added
Trade Deficit Decreased to $63.9 Billion in September
by Calculated Risk on 11/04/2020 08:39:00 AM
From the Department of Commerce reported:
The U.S. Census Bureau and the U.S. Bureau of Economic Analysis announced today that the goods and services deficit was $63.9 billion in September, down $3.2 billion from $67.0 billion in August, revised.
September exports were $176.4 billion, $4.4 billion more than August exports. September imports were $240.2 billion, $1.2 billion more than August imports.
emphasis added
 Click on graph for larger image.
Both exports and imports increased in September.
Exports are down 16% compared to September 2019; imports are down 6.5% compared to September 2019.
Both imports and exports decreased sharply due to COVID-19, and have now bounced back (imports more than exports),
The second graph shows the U.S. trade deficit, with and without petroleum.
 The blue line is the total deficit, and the black line is the petroleum deficit, and the red line is the trade deficit ex-petroleum products.
Note that the U.S. exported a slight net positive petroleum products in recent months.
Oil imports averaged $37.59 per barrel in September, up from $37.43 per barrel in August, and down from $53.10 in September 2019.
The trade deficit with China decreased to $29.7 billion in September, from $31.6 billion in September 2019.
ADP: Private Employment increased 365,000 in October
by Calculated Risk on 11/04/2020 08:19:00 AM
Private sector employment increased by 365,000 jobs from September to October according to the October ADP National Employment Report®. ... The report, which is derived from ADP’s actual payroll data, measures the change in total nonfarm private employment each month on a seasonally-adjusted basis.This was below the consensus forecast for 650 thousand private sector jobs added in the ADP report.
“The labor market continues to add jobs, yet at a slower pace,” said Ahu Yildirmaz, vice president and cohead of the ADP Research Institute. “Although the pace is slower, we’ve seen employment gains across all industries and sizes.
emphasis added
The BLS report will be released Friday, and the consensus is for 600 thousand non-farm payroll jobs added in October. Of course the ADP report has not been very useful in predicting the BLS report.
MBA: Mortgage Applications Increase in Latest Weekly Survey
by Calculated Risk on 11/04/2020 07:00:00 AM
From the MBA: Mortgage Applications Increase in Latest MBA Weekly Survey
Mortgage applications increased 3.8 percent from one week earlier, according to data from the Mortgage Bankers Association’s (MBA) Weekly Mortgage Applications Survey for the week ending October 30, 2020.
... The Refinance Index increased 6 percent from the previous week and was 88 percent higher than the same week one year ago. The seasonally adjusted Purchase Index decreased 1 percent from one week earlier. The unadjusted Purchase Index decreased 3 percent compared with the previous week and was 25 percent higher than the same week one year ago.
“Mortgage rates continue to hover at record lows this fall. The 30-year fixed mortgage rate remained essentially unchanged at 3.01 percent last week, but rates for 15-year fixed-rate loans, FHA loans and jumbo loans all fell to new MBA survey lows,” said Joel Kan, MBA’s Associate Vice President of Economic and Industry Forecasting. “The drop in rates spurred an uptick in demand for refinances. Activity increased over 6 percent, with borrowers notably seeking conventional and government loans. After a solid stretch of purchase applications growth, activity decreased for the fifth time in six weeks, but was still over 25 percent higher than a year ago, and has increased year-over-year for six straight months. 2020 continues to overall be a strong year for the housing market.”
...
The average contract interest rate for 30-year fixed-rate mortgages with conforming loan balances ($510,400 or less) increased to 3.01 percent from 3.00 percent, with points increasing to 0.38 from 0.35 (including the origination fee) for 80 percent loan-to-value ratio (LTV) loans.
emphasis added
 Click on graph for larger image.
The first graph shows the refinance index since 1990.
The refinance index has been very volatile recently depending on rates and liquidity.
But with record low rates, the index remains up significantly from last year.
 The second graph shows the MBA mortgage purchase index
According to the MBA, purchase activity is up 25% year-over-year unadjusted.
Note: Red is a four-week average (blue is weekly).


