 RSS Feed
 by Calculated Risk on 10/14/2020 02:04:00 PM
Wednesday, October 14, 2020
Houston Real Estate in September: Sales Up 32% YoY, Inventory Down 25% YoY
From the HAR: Houston Home Sales Stage a September Surge
Houston’s sizzling summer of home sales extended into September as consumers continued to take advantage of historically low mortgage interest rates amid a pandemic. Once again, the high end of the market experienced the greatest increase in sales volume, with mid-range homes also drawing strong activity. The sales frenzy, combined with a steady decline in the number of homes entering the market in recent months, has sent inventory to its lowest level in almost six years, making a sales slowdown inevitable as would-be buyers are left with a narrower selection of homes.Inventory declined 25.4% year-over-year from 42,959 in September 2019 to 32,047 in September 2020.
According to the latest Houston Association of Realtors (HAR) Market Update, 9,101 single-family homes sold in September compared to 7,050 a year earlier. That translates to a 29.1 percent increase and marks the fourth straight month of positive sales.
...
Sales of all property types totaled 11,137 – up 31.9 percent from September 2019. Total dollar volume for the month surged 43.6 percent to $3.4 billion. The lease market cooled in September, with declines in single-family housing while townhouse/condo leases were unchanged year-over-year.
emphasis added
Note that the closed sales in September were for contracts that were mostly signed in July and August.
House Prices to National Average Wage Index
by Calculated Risk on 10/14/2020 11:19:00 AM
One of the metrics we'd like to follow is a ratio of house prices to incomes. Unfortunately most income data is released with a significantly lag, and there are always questions about which income data to use (the average total income is skewed by the income of a few people).
And for key measures of house prices - like Case-Shiller - we have indexes, not actually prices.
But we can construct a ratio of the house price indexes to some measure of income.
For this graph I decided to look at house prices and the National Average Wage Index released yesterday for 2019 from Social Security.
 Click on graph for larger image.
This graph shows the ratio of house price indexes divided by the National Average Wage Index (the Wage index is first divided by 1000).
This uses the annual average National Case-Shiller index since 1976 (and an estimate for 2020).
As of 2020, house prices were somewhat above the median historical ratio - but far below the bubble peak.
Going forward, I think it would be a positive if wages outpaced, or at least kept pace with house prices increases for a few years.
Note: The national wage index for 2020 is estimated using the median increase over the last several years.
House Prices and Inventory
by Calculated Risk on 10/14/2020 11:01:00 AM
It is difficult to measure housing demand directly, but inventory is fairly easy to track. Watching existing home "for sale" inventory is very helpful. As an example, the increase in inventory in late 2005 helped me call the top for housing.
And the decrease in inventory eventually helped me correctly call the bottom for house prices in early 2012, see: The Housing Bottom is Here.
I don't have a crystal ball, but watching inventory helps understand the housing market. And inventory has been decreasing in many areas recently, and pushing up house prices.
 Click on graph for larger image.
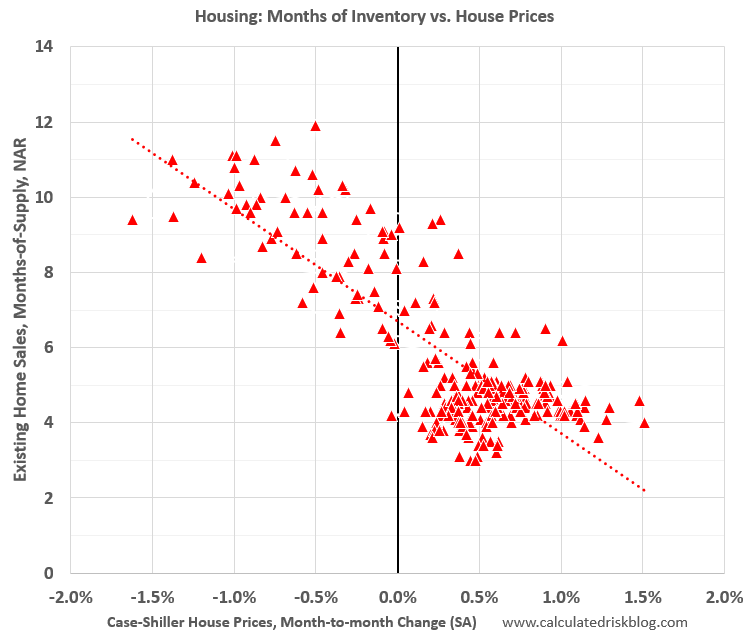
This graph below shows existing home months-of-supply (from the NAR) vs. the seasonally adjusted month-to-month price change in the Case-Shiller National Index (both since January 1999).
There is a clear relationship, and this is no surprise (but interesting to graph).
If months-of-supply is high, prices decline. If months-of-supply is low, prices rise.
For August, the NAR reported months-of-supply at 3.0 months. This is very low, and based on recent reports, months-of-supply might decrease further in September.
Note that Case-Shiller is through July. The recent CoreLogic report indicated prices were up even more in August, and Zillow is forecasting the Case-Shiller Year-over-year House Price Growth to Increase Significantly in August.
MBA: Mortgage Applications Decrease in Latest Weekly Survey
by Calculated Risk on 10/14/2020 07:00:00 AM
From the MBA: Mortgage Applications Decrease in Latest MBA Weekly Survey
Mortgage applications decreased 0.7 percent from one week earlier, according to data from the Mortgage Bankers Association’s (MBA) Weekly Mortgage Applications Survey for the week ending October 9, 2020.
... The Refinance Index decreased 0.3 percent from the previous week and was 44 percent higher than the same week one year ago. The seasonally adjusted Purchase Index decreased 2 percent from one week earlier. The unadjusted Purchase Index decreased 1 percent compared with the previous week and was 24 percent higher than the same week one year ago.
Mortgage applications for refinances and home purchases both decreased slightly last week, despite the 30-year fixed mortgage rate declining to a new MBA survey low of 3.00 percent. Applications for government mortgages offset some of the overall decline by increasing 3 percent, driven by a solid gain in government purchase applications and an 11 percent jump in VA refinance applications,” said Joel Kan, MBA’s Associate Vice President of Economic and Industry Forecasting. “Refinance and purchase activity continue to run well ahead of last year’s pace, fueled by record-low rates and strong homebuyer demand. Housing supply is a challenge for many aspiring buyers, but activity should continue to stay strong the rest of the year.”
...
The average contract interest rate for 30-year fixed-rate mortgages with conforming loan balances ($510,400 or less) decreased to 3.00 percent from 3.01 percent, with points decreasing to 0.32 from 0.37 (including the origination fee) for 80 percent loan-to-value ratio (LTV) loans.
emphasis added
 Click on graph for larger image.
The first graph shows the refinance index since 1990.
The refinance index has been very volatile recently depending on rates and liquidity.
But with record low rates, the index remains up significantly from last year.
 The second graph shows the MBA mortgage purchase index
According to the MBA, purchase activity is up 24% year-over-year unadjusted.
Note: Red is a four-week average (blue is weekly).
Tuesday, October 13, 2020
October 13 COVID-19 Test Results
by Calculated Risk on 10/13/2020 06:52:00 PM
The US is now mostly reporting 700 thousand to 1 million tests per day. Based on the experience of other countries, the percent positive needs to be well under 5% to really push down new infections (probably close to 1%), so the US still needs to increase the number of tests per day significantly (or take actions to push down the number of new infections).
There were 840,142 test results reported over the last 24 hours.
There were 46,647 positive tests.
Over 8,600 Americans deaths from COVID have been reported in October. See the graph on US Daily Deaths here.
 Click on graph for larger image.
This data is from the COVID Tracking Project.
The percent positive over the last 24 hours was 5.5% (red line is 7 day average).
For the status of contact tracing by state, check out testandtrace.com.
And check out COVID Exit Strategy to see how each state is doing.
 The second graph shows the 7 day average of positive tests reported.
The dashed line is the July high.
Note that there were very few tests available in March and April, and many cases were missed (the percent positive was very high - see first graph). By June, the percent positive had dropped below 5%.
Everyone needs to be vigilant or we might see record high cases this Fall and Winter.
Technical Note: October Employment Report Will Show a Significant Decrease in Temporary Census Workers
by Calculated Risk on 10/13/2020 02:21:00 PM
The Census Bureau released an update today on 2020 Census Paid Temporary Workers
As of the September reference week, there were 246,801 decennial Census temporary workers. As of week of September 27 to October 3, there were 163,913 temp workers.
That is a decrease of 82,888 - with two more weeks of layoffs to go.
This week is the BLS reference week, and it seems likely another 70,000 or so temporary workers were let go this week and last week (to be released in two weeks).
This means the October employment report will show a sharp decrease in temporary Census employment.
This means the October employment report will show a sharp decrease in temporary Census employment.
In August, the employment report showed a gain of 238,000 temporary 2020 Census workers, boosting the headline number.
In September, the employment report showed a decrease of 41,000 temporary 2020 Census workers, reducing the headline number.
My guess is the October employment report will show a decrease of around 150,000 temporary Census workers (maybe even more).
Cleveland Fed: Key Measures Show Inflation Eased Year-over-year in September
by Calculated Risk on 10/13/2020 11:11:00 AM
The Cleveland Fed released the median CPI and the trimmed-mean CPI this morning:
According to the Federal Reserve Bank of Cleveland, the median Consumer Price Index rose 0.1% September. The 16% trimmed-mean Consumer Price Index rose 0.1% in September. "The median CPI and 16% trimmed-mean CPI are measures of core inflation calculated by the Federal Reserve Bank of Cleveland based on data released in the Bureau of Labor Statistics’ (BLS) monthly CPI report".
Note: The Cleveland Fed released the median CPI details for September here. Used cars and trucks increased at a 118% annualized rate in September.
 Click on graph for larger image.
This graph shows the year-over-year change for these four key measures of inflation. On a year-over-year basis, the median CPI rose 2.5%, the trimmed-mean CPI rose 2.4%, and the CPI less food and energy rose 1.7%. Core PCE is for August and increased 1.6% year-over-year.
Used cars and trucks drove inflation in September. Overall inflation will not be a concern during the crisis.
Cost of Living Adjustment increases 1.3% in 2021, Contribution Base increased to $142,800
by Calculated Risk on 10/13/2020 09:17:00 AM
With the release of the CPI report this morning, we now know the Cost of Living Adjustment (COLA), and the contribution base for 2021.
From Social Security: Social Security Announces 1.3 Percent Benefit Increase for 2021
Social Security and Supplemental Security Income (SSI) benefits for approximately 70 million Americans will increase 1.3 percent in 2021, the Social Security Administration announced today.Currently CPI-W is the index that is used to calculate the Cost-Of-Living Adjustments (COLA). Here is a discussion from Social Security on the current calculation (1.3% increase) and a list of previous Cost-of-Living Adjustments.
The 1.3 percent cost-of-living adjustment (COLA) will begin with benefits payable to more than 64 million Social Security beneficiaries in January 2021. Increased payments to more than 8 million SSI beneficiaries will begin on December 31, 2020. (Note: some people receive both Social Security and SSI benefits). The Social Security Act ties the annual COLA to the increase in the Consumer Price Index as determined by the Department of Labor’s Bureau of Labor Statistics.
Some other adjustments that take effect in January of each year are based on the increase in average wages. Based on that increase, the maximum amount of earnings subject to the Social Security tax (taxable maximum) will increase to $142,800 from $137,700.
The contribution and benefit base will be $142,800 in 2021.
The National Average Wage Index increased to $54,099.99 in 2019, up 3.75% from $52,145.80 in 2018 (used to calculate contribution base).
BLS: CPI increased 0.2% in September, Core CPI increased 0.2%
by Calculated Risk on 10/13/2020 08:34:00 AM
The Consumer Price Index for All Urban Consumers (CPI-U) increased 0.2 percent in September on a seasonally adjusted basis after rising 0.4 percent in August, the U.S. Bureau of Labor Statistics reported today. Over the last 12 months, the all items index increased 1.4 percent before seasonal adjustment.Overall inflation was at expectations in September. I'll post a graph later today after the Cleveland Fed releases the median and trimmed-mean CPI.
The index for used cars and trucks continued to rise sharply and accounted for most of the monthly increase in the seasonally adjusted all items index. The food index was unchanged, with an increase in the food away from home index offsetting a decline in the food at home index. The energy index rose 0.8 percent in September as the index for natural gas increased 4.2 percent.
The index for all items less food and energy rose 0.2 percent in September after larger increases in July and August. ...
The all items index rose 1.4 percent for the 12 months ending September, a slightly larger increase than the 1.3-percent rise for the 12-month period ending August. The index for all items less food and energy rose 1.7 percent over the last 12 months, the same increase as the period ending August.
emphasis added
Monday, October 12, 2020
Tuesday: CPI
by Calculated Risk on 10/12/2020 09:14:00 PM
Tuesday:
• At 8:30 AM ET, The Consumer Price Index for September from the BLS. The consensus is for a 0.2% increase in CPI, and a 0.2% increase in core CPI.


