 RSS Feed
 by Calculated Risk on 10/14/2020 11:01:00 AM
Wednesday, October 14, 2020
House Prices and Inventory
It is difficult to measure housing demand directly, but inventory is fairly easy to track. Watching existing home "for sale" inventory is very helpful. As an example, the increase in inventory in late 2005 helped me call the top for housing.
And the decrease in inventory eventually helped me correctly call the bottom for house prices in early 2012, see: The Housing Bottom is Here.
I don't have a crystal ball, but watching inventory helps understand the housing market. And inventory has been decreasing in many areas recently, and pushing up house prices.
 Click on graph for larger image.
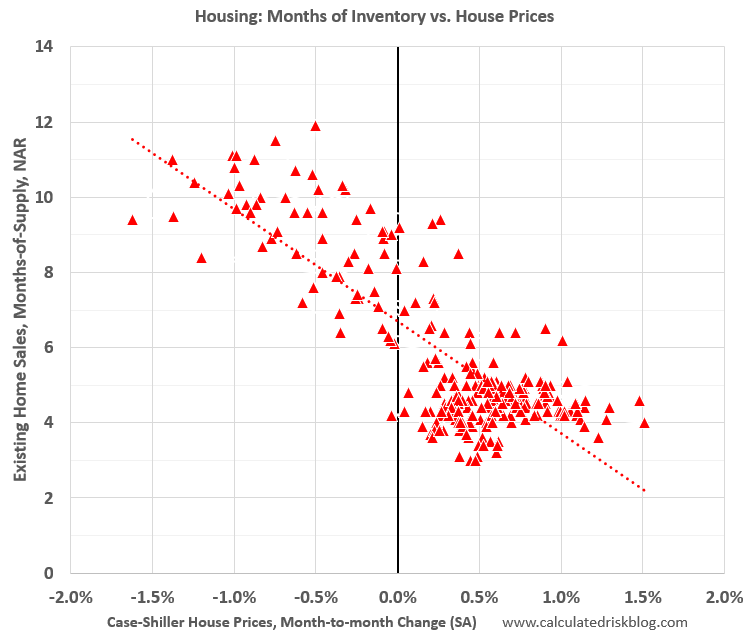
This graph below shows existing home months-of-supply (from the NAR) vs. the seasonally adjusted month-to-month price change in the Case-Shiller National Index (both since January 1999).
There is a clear relationship, and this is no surprise (but interesting to graph).
If months-of-supply is high, prices decline. If months-of-supply is low, prices rise.
For August, the NAR reported months-of-supply at 3.0 months. This is very low, and based on recent reports, months-of-supply might decrease further in September.
Note that Case-Shiller is through July. The recent CoreLogic report indicated prices were up even more in August, and Zillow is forecasting the Case-Shiller Year-over-year House Price Growth to Increase Significantly in August.


