 RSS Feed
 by Calculated Risk on 9/03/2020 12:29:00 PM
Thursday, September 03, 2020
Hotels: Occupancy Rate Declined 27.7% Year-over-year
From HotelNewsNow.com: STR: US hotel results for week ending 29 August
U.S. hotel occupancy decreased slightly for the second consecutive week, according to the latest data from STR.The following graph shows the seasonal pattern for the hotel occupancy rate using the four week average.
23-29 August 2020 (percentage change from comparable week in 2019):
• Occupancy: 48.2% (-27.7%)
• Average daily rate (ADR): US$98.39 (-23.2%)
• Revenue per available room (RevPAR): US$47.38 (-44.5%)
The industry sold 237,000 fewer room nights than the previous week, which represented a demand decrease of 1.3%. Week-over-week demand improvements were a constant since mid-April, but as summer ends and leisure travel fades, hotel performance gains have flattened.
emphasis added
 Click on graph for larger image.
The red line is for 2020, dash light blue is 2019, blue is the median, and black is for 2009 (the worst year probably since the Great Depression for hotels).
The leisure travel season usually peaks at the beginning of August, and then the occupancy rate typically declines sharply in the Fall. So "flat" isn't terrible.
With so many schools closed, the leisure travel season might have lasted longer than usual this year, but it is unlikely business travel will pickup significantly in the Fall.
Note: Y-axis doesn't start at zero to better show the seasonal change.
Comments on Weekly Unemployment Claims
by Calculated Risk on 9/03/2020 10:26:00 AM
Earlier: Weekly Initial Unemployment Claims increase to 833,352 NSA
Note: The DOL changed their seasonal adjustment method, so to compare to the previous week, we need to use the NSA data. See Technical Note on Weekly Unemployment Claims
The Not Seasonally Adjusted (NSA) claims increased to 833,352 from 825,761 the previous week. These are directly comparable since the Seasonal Adjustment Factor was identical for both weeks.
This was the 24th consecutive week with extraordinarily high initial claims.
More importantly, continued claims are still extremely high (second graph below).
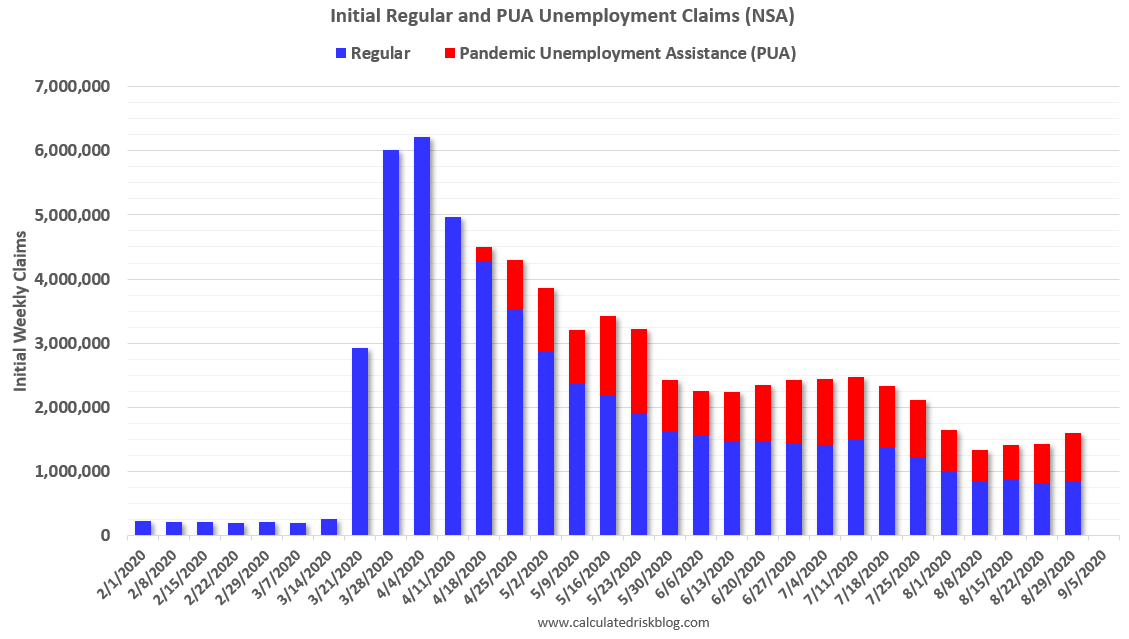
The following graph shows regular initial unemployment claims (blue) and PUA claims (red) since early February (all NSA).
 Click on graph for larger image.
Initial claims, including Pandemic Unemployment Assistance (PUA) are still close to 1.6 million per week.
The worst week during the great recession was 665,000 (SA). So total initial weekly claims are still more than 900 thousand higher than the worst week of the great recession!
We are probably seeing some layoffs related to the higher level of COVID cases and also from the end of some Payroll Protection Programs (PPP).
 The second graph shows all person receiving unemployment insurance benefits on all programs. Note that this data is released with a two week lag, and is not seasonally adjusted.
There are typically around 2 million people receiving benefits from the various programs (mostly regular unemployment insurance).
As of the release this morning, there were still 29 million people receiving benefits as of August 15th.
This was a very disappointing weekly report. Initial claims increased (NSA), there was a sharp increase in PUA initial claims (might be a data dump), and the total continued claims increased - and remains at a very high level.
ISM Services Index decreased to 56.9% in August
by Calculated Risk on 9/03/2020 10:06:00 AM
The August ISM Services index was at 56.9%, down from 58.1% in June. The employment index increased to 47.9%, from 42.1%. Note: Above 50 indicates expansion, below 50 contraction.
From the Institute for Supply Management: Services PMI™ at 56.9%; August 2020 Services ISM® Report On Business®
Business Activity Index at 62.4%; New Orders Index at 56.8%; Employment Index at 47.9%; Supplier Deliveries Index at 60.5%The employment index showed ongoing weakness with the sixth consecutive reading below 50.
Economic activity in the services sector grew in August for the third month in a row, say the nation's purchasing and supply executives in the latest Services ISM® Report On Business®.
The report was issued today by Anthony Nieves, CPSM, C.P.M., A.P.P., CFPM, Chair of the Institute for Supply Management® (ISM®) Services Business Survey Committee: "The Services PMI™ (formerly the Non-Manufacturing NMI®) registered 56.9 percent, 1.2 percentage points lower than the July reading of 58.1 percent. This reading represents growth in the services sector for the third straight month and the 125th time in the last 127 months, with the exception of April's and May's contraction.
emphasis added
Trade Deficit Increased Sharply to $63.6 Billion in July
by Calculated Risk on 9/03/2020 08:55:00 AM
From the Department of Commerce reported:
The U.S. Census Bureau and the U.S. Bureau of Economic Analysis announced today that the goods and services deficit was $63.6 billion in July, up $10.1 billion from $53.5 billion in June, revised.
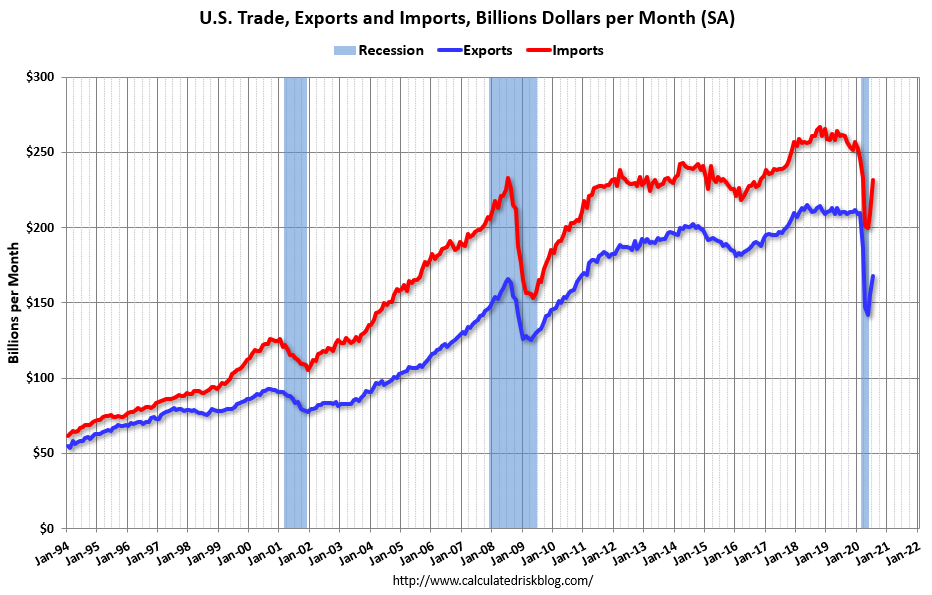
July exports were $168.1 billion, $12.6 billion more than June exports. July imports were $231.7 billion, $22.7 billion more than June imports
emphasis added
 Click on graph for larger image.
Both exports and imports increased in June.
Exports are down 20% compared to July 2019; imports are down 11% compared to July 2019.
Both imports and exports decreased sharply due to COVID-19, and have now bounced back (imports more than exports),
The second graph shows the U.S. trade deficit, with and without petroleum.
 The blue line is the total deficit, and the black line is the petroleum deficit, and the red line is the trade deficit ex-petroleum products.
Note that the U.S. exported a slight net positive petroleum products in recent months.
Oil imports averaged $40.60 per barrel in July, up from $35.34 per barrel in June, and down from $60.11 in July 2019.
The trade deficit with China decreased to $31.6 billion in July, from $32.7 billion in July 2019.
Weekly Initial Unemployment Claims increase to 833,352 NSA
by Calculated Risk on 9/03/2020 08:39:00 AM
Note: The DOL has changed their seasonal adjustment method, so to compare to the previous week, we need to use the NSA data. See Technical Note on Weekly Unemployment Claims
The Not Seasonally Adjusted (NSA) claims increased to 833,352 from 825,761 the previous week. These are directly comparable since the Seasonal Adjustment Factor was identical for both weeks.
The DOL reported:
In the week ending August 29, the advance figure for seasonally adjusted initial claims was 881,000, a decrease of 130,000 from the previous week's revised level. The previous week's level was revised up by 5,000 from 1,006,000 to 1,011,000. The 4-week moving average was 991,750, a decrease of 77,500 from the previous week's revised average. The previous week's average was revised up by 1,250 from 1,068,000 to 1,069,250.The previous week was revised up.
emphasis added
This does not include the 759,482 initial claims for Pandemic Unemployment Assistance (PUA) that was up from 607,808 the previous week.
The following graph shows the 4-week moving average of weekly claims since 1971.
 Click on graph for larger image.
The dashed line on the graph is the current 4-week average. The four-week average of weekly unemployment claims decreased to 991,750.
The previous week was revised up.
The second graph shows seasonally adjust continued claims since 1967 (lags initial by one week).
 At the worst of the Great Recession, continued claims peaked at 6.635 million, but then steadily declined.
Continued claims decreased to 13,254,000 (SA) from 14,492,000 (SA) last week and will likely stay at a high level until the crisis abates.
Note: There are an additional 13,570,327 receiving Pandemic Unemployment Assistance (PUA) that increased from 10,972,770 the previous week. This is a special program for business owners, self-employed, independent contractors or gig workers not receiving other unemployment insurance.
Wednesday, September 02, 2020
Thursday: Unemployment Claims, Trade Deficit, ISM Services
by Calculated Risk on 9/02/2020 07:54:00 PM
Thursday:
• At 8:30 AM ET, The initial weekly unemployment claims report will be released. The early consensus is for a 950 thousand initial claims, down from 1.006 million the previous week.
• At 8:30 AM, Trade Balance report for July from the Census Bureau. The consensus is for the U.S. trade deficit to be at $52.3 billion in July, from $50.7 billion in June.
• At 10:00 AM, ISM Services Index for August.
September 2 COVID-19 Test Results
by Calculated Risk on 9/02/2020 07:00:00 PM
The US is now mostly reporting over 700,000 tests per day (fewer recently). Based on the experience of other countries, the percent positive needs to be well under 5% to really push down new infections, so the US still needs to increase the number of tests per day significantly (or take actions to push down the number of new infections).
There were 644,842 test results reported over the last 24 hours.
There were 30,409 positive tests.
See the graph on US Daily Deaths here.
 Click on graph for larger image.
This data is from the COVID Tracking Project.
The percent positive over the last 24 hours was 4.7% (red line).
For the status of contact tracing by state, check out testandtrace.com.
And check out COVID Exit Strategy to see how each state is doing.
 The second graph shows the 7 day average of positive tests reported.
The dashed line is the June low.
Note that there were very few tests available in March and April, and many cases were missed (the percent positive was very high - see first graph).
By June, the percent positive had dropped below 5% (lower than today). If people stay vigilant, the number of cases might drop to the June low by the end of September (that would still be a large number of new cases, but progress).
Technical Note on Weekly Unemployment Claims
by Calculated Risk on 9/02/2020 01:25:00 PM
UPDATE: The NY Times has an article on this too: The Labor Department will start counting unemployment claims in a new way.
The DOL has announced that they are changing the seasonal adjustment for unemployment claims:
Beginning with the Unemployment Insurance (UI) Weekly Claims News Release issued Thursday, September 3, 2020, the methodology used to seasonally adjust the national initial claims and continued claims will reflect additive factors as opposed to multiplicative factors.This makes sense since the huge increase in weekly claims has been due to the pandemic.
However, the DOL will not revise prior weeks, from Ben Casselman:
@USDOL says initial claims for 8/22 will NOT be revised to reflect the new adjustment methodology. So we should expect to see a big, artificial drop in claims from 8/22 to 8/29.Currently this is the a low season for initial claims, so the seasonal factor is below 100 (see data and seasonal factors here).
For example, for the week ending August 22nd, initial weekly claims were 1,006,000 Seasonally Adjusted (SA), and 821,591 NSA. The seasonal factor was 81.7.
The formula is (NSA Claims) * 100 / Seasonal Factor = Seasonally Adjusted Claims. So 821,591 * 100 / 81.7 = 1,006,000 (rounded to nearest 1,000).
Switching to additive factors, my guess is the DOL would have added about 40,000 to the NSA number to report the SA number. So instead of reporting 1,006,000 for the week ending August 22nd, the DOL would have reported 862,000.
As Ben Casselman notes, the DOL will not revise prior weeks using the additive factor. Since the seasonal factor for the week ending Aug 29th (to be reported tomorrow) is also 81.7, this means the number of SA claims would decline significantly, even with the same level of NSA claims.
What this means is we cannot compare the SA number to previous weeks. However, since the seasonal factor was the same for both the week ending August 22nd, and the week ending Aug 29th, we can directly compare the NSA number for both weeks to see if claims were increasing or decreasing.
U.S. Heavy Truck Sales down 26% Year-over-year in August
by Calculated Risk on 9/02/2020 10:40:00 AM
The following graph shows heavy truck sales since 1967 using data from the BEA. The dashed line is the August 2020 seasonally adjusted annual sales rate (SAAR).
Heavy truck sales really collapsed during the great recession, falling to a low of 180 thousand SAAR in May 2009. Then heavy truck sales increased to a new all time high of 575 thousand SAAR in September 2019.
However heavy truck sales started declining late last year due to lower oil prices.
Note: "Heavy trucks - trucks more than 14,000 pounds gross vehicle weight."

Click on graph for larger image.
Heavy truck sales really declined towards the end of March due to COVID-19 and the collapse in oil prices.
Heavy truck sales are now back to March 2020 levels.
Heavy truck sales were at 395 thousand SAAR in August, up from 379 thousand SAAR in July, but down 26% from 534 thousand SAAR in August 2019.
ADP: Private Employment increased 428,000 in August
by Calculated Risk on 9/02/2020 08:20:00 AM
Private sector employment increased by 428,000 jobs from July to August according to the August ADP National Employment Report®. ... The report, which is derived from ADP’s actual payroll data, measures the change in total nonfarm private employment each month on a seasonally-adjusted basis.This was well below the consensus forecast for 900 thousand private sector jobs added in the ADP report.
“The August job postings demonstrate a slow recovery,” said Ahu Yildirmaz, vice president and co-head of the ADP Research Institute. “Job gains are minimal, and businesses across all sizes and sectors have yet to come close to their pre-COVID-19 employment levels.
The BLS report will be released Friday, and the consensus is for 1.4 million non-farm payroll jobs added in August. Of course the ADP report has not been very useful in predicting the BLS report.


