 RSS Feed
 by Calculated Risk on 8/21/2020 08:16:00 AM
Friday, August 21, 2020
Black Knight: Number of Homeowners in COVID-19-Related Forbearance Plans "Remains Flat"
Note: Both Black Knight and the MBA (Mortgage Bankers Association) are putting out weekly estimates of mortgages in forbearance.
This data is as of August 18th.
From Number of Loans in Forbearances Remains Flat
According to latest data from Black Knight’s McDash Flash Forbearance Tracker, the number of mortgages in active forbearance remained flat over the past week, with a 15,000 reduction among GSE mortgages offset by a 5,000 rise in FHA forbearances and a 10,000 increase among portfolio/PLS-held loans.
As of August 18, 3.9 million homeowners remain in active forbearance, representing 7.4% of all active mortgages, unchanged from last week. Together, they represent $833 billion in unpaid principal.
...
As we’ve discussed previously, there are a number of factors that continue to represent significant uncertainty as we move forward, including the ongoing COVID-19 pandemic and the expiration of expanded unemployment benefits last month.
emphasis added
 Click on graph for larger image.
CR Note: There will probably be another disaster relief package soon, but we might see an increase in forbearance activity in the coming weeks as we wait for additional relief.
Thursday, August 20, 2020
Friday: Existing Home Sales
by Calculated Risk on 8/20/2020 07:55:00 PM
Take the over on existing home sales tomorrow. This could be the highest sales rate since 2006!
Friday:
• At 10:00 AM ET, Existing Home Sales for July from the National Association of Realtors (NAR). The consensus is for 5.39 million SAAR, up from 4.72 million last month.
Housing economist Tom Lawler expects the NAR to report 5.85 million SAAR.
• Also at 10:00 AM State Employment and Unemployment (Monthly) for July 2019
August 20 COVID-19 Test Results
by Calculated Risk on 8/20/2020 06:28:00 PM
The US is now mostly reporting over 700,000 tests per day (fewer recently). Based on the experience of other countries, the percent positive needs to be well under 5% to really push down new infections, so the US still needs to increase the number of tests per day significantly (or take actions to push down the number of new infections).
There were 635,809 test results reported over the last 24 hours.
There were 43,245 positive tests.
There have been 20,717 COVID deaths in the first 20 days of August. See the graph on US Daily Deaths here.
 Click on graph for larger image.
This data is from the COVID Tracking Project.
The percent positive over the last 24 hours was 6.8% (red line).
For the status of contact tracing by state, check out testandtrace.com.
And check out COVID Exit Strategy to see how each state is doing.
Hotels: Occupancy Rate Declined 30% Year-over-year
by Calculated Risk on 8/20/2020 12:32:00 PM
From HotelNewsNow.com: STR: US hotel results for week ending 15 August
U.S. weekly hotel occupancy hit 50.0% for the first time since mid-March, according to the latest data from STR.The following graph shows the seasonal pattern for the hotel occupancy rate using the four week average.
9-15 August 2020 (percentage change from comparable week in 2019):
• Occupancy: 50.2% (-30.0%)
• Average daily rate (ADR): US$101.41 (-23.0%)
• Revenue per available room (RevPAR): US$50.87 (-46.1%)
U.S. occupancy has risen week over week for 17 of the last 18 weeks, although growth in demand (room nights sold) has slowed. The week ending 14 March was the last with occupancy of at least 50.0%.
emphasis added
As STR noted, the occupancy rate has increased week-to-week in "17 of the last 18 weeks". The increases in occupancy have slowed and are well below the level for this week last year of 72%.
 Click on graph for larger image.
The red line is for 2020, dash light blue is 2019, blue is the median, and black is for 2009 (the worst year probably since the Great Depression for hotels).
The leisure travel season usually peaks at the beginning of August (right now), and the occupancy rate typically declines sharply in the Fall.
With so many schools closed, the leisure travel season might be lasting longer this year than usual.
Note: Y-axis doesn't start at zero to better show the seasonal change.
Comments on Weekly Unemployment Claims
by Calculated Risk on 8/20/2020 11:15:00 AM
A few comments:
In normal times, most analysts focus on initial unemployment claims for the BLS reference week of the employment report. For August, the BLS reference week is August 9th through the 15th, and the initial claims report this morning was for the reference week. The increase in initial claims in the report this morning would usually indicate weakness in the labor market.
However, continued claims are probably much more useful now. Continued claims are released with a one week lag, so continued claims for the reference week will be released next week. Continued claims are down 2.1 million from the reference week in July, suggesting an increase in employment in August.
There are an additional 11,224,774 receiving Pandemic Unemployment Assistance (PUA). This is a special program for business owners, self-employed, independent contractors or gig workers not receiving other unemployment insurance.
The following graph shows regular initial unemployment claims (blue) and PUA claims (red) since early February.
 Click on graph for larger image.
This was the 22nd consecutive week with extraordinarily high initial claims.
We are probably seeing some layoffs related to the higher level of COVID cases and also from the end of some Payroll Protection Programs (PPP).
Philly Fed Manufacturing "continued to expand" in August
by Calculated Risk on 8/20/2020 09:14:00 AM
Note: Be careful with diffusion indexes. This shows a rebound off the bottom - some improvement from May to August - but doesn't show the level of activity.
From the Philly Fed: August 2020 Manufacturing Business Outlook Survey
Manufacturing activity in the region continued to expand this month, according to firms responding to the August Manufacturing Business Outlook Survey. The survey’s current indicators for general activity, new orders, and shipments remained positive for the third consecutive month but fell from their readings in July. The employment index also fell from its reading in July but remained in positive territory for the second consecutive month. Most of the future indicators remained elevated, suggesting that the firms expect growth over the next six months.This was below the consensus forecast. Here is a graph comparing the regional Fed surveys and the ISM manufacturing index:
The diffusion index for current activity fell 7 points to 17.2 in August, its third consecutive positive reading after reaching long-term lows in April and May … On balance, the firms reported increases in manufacturing employment for the second consecutive month, but the current employment index fell 11 points to 9.0 this month.
emphasis added
 Click on graph for larger image.
The New York and Philly Fed surveys are averaged together (blue, through August), and five Fed surveys are averaged (yellow, through July) including New York, Philly, Richmond, Dallas and Kansas City. The Institute for Supply Management (ISM) PMI (red) is through July (right axis).
These early reports suggest the ISM manufacturing index will stay positive in August, but will likely not change much from the July level.
Weekly Initial Unemployment Claims increase to 1,106,000
by Calculated Risk on 8/20/2020 08:39:00 AM
The DOL reported:
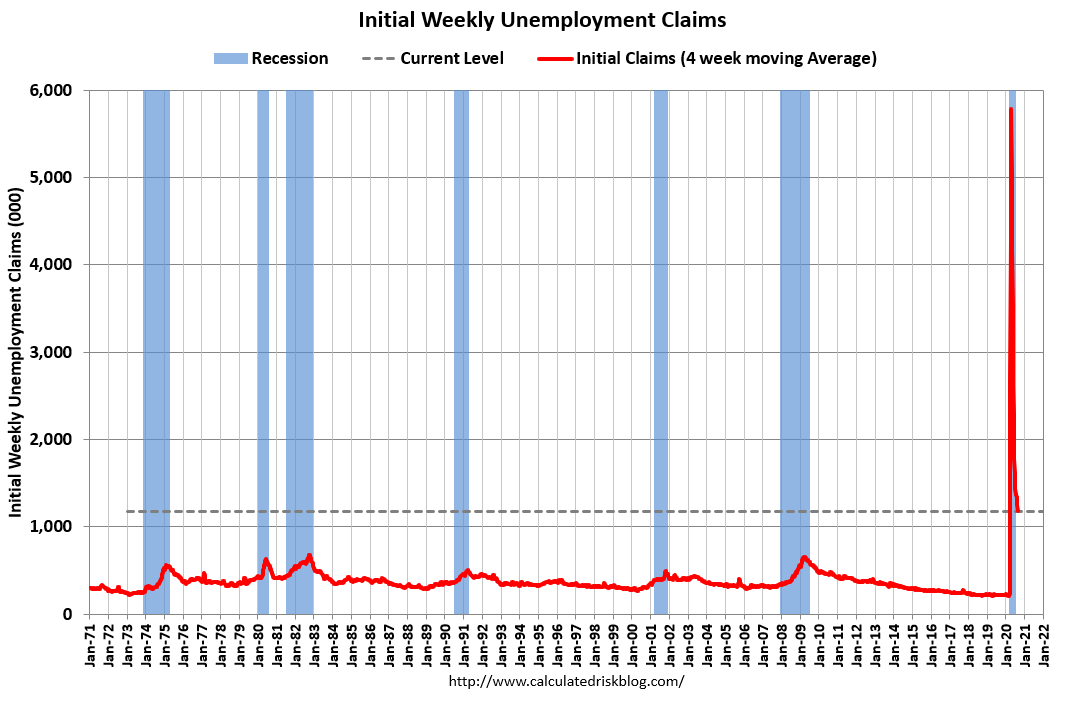
In the week ending August 15, the advance figure for seasonally adjusted initial claims was 1,106,000, an increase of 135,000 from the previous week's revised level. The previous week's level was revised up by 8,000 from 963,000 to 971,000. The 4-week moving average was 1,175,750, a decrease of 79,000 from the previous week's revised average. The previous week's average was revised up by 2,000 from 1,252,750 to 1,254,750.The previous week was revised up.
emphasis added
This does not include the 542,797 initial claims for Pandemic Unemployment Assistance (PUA) that was up from 489,639 the previous week.
The following graph shows the 4-week moving average of weekly claims since 1971.
 Click on graph for larger image.
The dashed line on the graph is the current 4-week average. The four-week average of weekly unemployment claims decreased to 1,252,750.
Initial weekly claims was well above the consensus forecast of 900 thousand initial claims, and the previous week was revised up.
The second graph shows seasonally adjust continued claims since 1967 (lags initial by one week).
 At the worst of the Great Recession, continued claims peaked at 6.635 million, but then steadily declined.
Continued claims decreased to 14,844,000 (SA) from 15,480,000 (SA) last week and will likely stay at a high level until the crisis abates.
Note: There are an additional 11,224,774 receiving Pandemic Unemployment Assistance (PUA) that increased from 10,723,396 the previous week. This is a special program for business owners, self-employed, independent contractors or gig workers not receiving other unemployment insurance.
Wednesday, August 19, 2020
Thursday: Unemployment Claims, Philly Fed Mfg
by Calculated Risk on 8/19/2020 09:28:00 PM
Thursday:
• At 8:30 AM ET, The initial weekly unemployment claims report will be released. The early consensus is for a 900 thousand initial claims, down from 963 thousand the previous week.
• Also at 8:30 AM, the Philly Fed manufacturing survey for August. The consensus is for a reading of 20.5, down from 24.1.
August 19 COVID-19 Test Results
by Calculated Risk on 8/19/2020 06:34:00 PM
The US is now mostly reporting over 700,000 tests per day. Based on the experience of other countries, the percent positive needs to be well under 5% to really push down new infections, so the US still needs to increase the number of tests per day significantly (or take actions to push down the number of new infections).
There were 680,934 test results reported over the last 24 hours.
There were 45,103 positive tests.
There have been 19,600 COVID deaths in the first 19 days of August. See the graph on US Daily Deaths here.
 Click on graph for larger image.
This data is from the COVID Tracking Project.
The percent positive over the last 24 hours was 6.6% (red line).
For the status of contact tracing by state, check out testandtrace.com.
And check out COVID Exit Strategy to see how each state is doing.
FOMC Minutes: "Uncertainty surrounding the economic outlook remained very elevated"
by Calculated Risk on 8/19/2020 02:26:00 PM
From the Fed: Minutes of the Federal Open Market Committee July 28-29, 2020. A few excerpts:
Participants observed that uncertainty surrounding the economic outlook remained very elevated, with the path of the economy highly dependent on the course of the virus and the public sector's response to it. Several risks to the outlook were noted, including the possibility that additional waves of virus outbreaks could result in extended economic disruptions and a protracted period of reduced economic activity. In such scenarios, banks and other lenders could tighten conditions in credit markets appreciably and restrain the availability of credit to households and businesses. Other risks cited included the possibility that fiscal support for households, businesses, and state and local governments might not provide sufficient relief of financial strains in these sectors and that some foreign economies could come under greater pressure than anticipated as a result of the spread of the pandemic abroad. Several participants noted potential longer-run effects of the pandemic associated with possible restructuring in some sectors of the economy that could slow the growth of the economy's productive capacity for some time.
A number of participants commented on various potential risks to financial stability. Banks and other financial institutions could come under significant stress, particularly if one of the more adverse scenarios regarding the spread of the virus and its effects on economic activity was realized. Nonfinancial corporations had carried high levels of indebtedness into the pandemic, increasing their risk of insolvency. There were also concerns that the anticipated increase in Treasury debt over the next few years could have implications for market functioning. There was general agreement that these institutions, activities, and markets should be monitored closely, and a few participants noted that improved data would be helpful for doing so. Several participants observed that the Federal Reserve had recently taken steps to help ensure that banks remain resilient through the pandemic, including by conducting additional sensitivity analysis in conjunction with the most recent bank stress tests and imposing temporary restrictions on shareholder payouts to preserve banks' capital. A couple of participants noted that they believed that restrictions on shareholder payouts should be extended, while another judged that such a step would be premature.
emphasis added


