 RSS Feed
 by Calculated Risk on 6/22/2020 01:22:00 PM
Monday, June 22, 2020
Comments on May Existing Home Sales
Earlier: NAR: Existing-Home Sales Decreased to 3.91 million in May, Rebound Expected in Coming Months
A few key points:
1) Existing home sales are counted at the close of escrow, so this report is mostly for contracts signed in March and April - when the economy was mostly shutdown.
Sales NSA for May were below the housing bust low for May. However, there has been a rebound in mortgage purchase applications and regional pending home sales, so we can expect a rebound in existing home sales in June or July.
2) Inventory is very low, and was down 18.8% year-over-year (YoY) in May. This is the lowest level of inventory for May since at least the early 1990s.
3) As usual, housing economist Tom Lawler was much closer to the actual NAR report than the consensus forecast.
 Click on graph for larger image.
This graph shows existing home sales by month for 2019 and 2020.
Note that existing home sales picked up somewhat in the second half of 2019 as interest rates declined.
Even with weak sales in April and May, sales to date are only down about 9.1% compared to the same period in 2019.
 The second graph shows existing home sales Not Seasonally Adjusted (NSA) by month (Red dashes are 2020), and the minimum and maximum for 2005 through 2019.
Sales NSA in May (372,000) were well below sales last year in April (452,000).
Sales NSA in May were just BELOW the housing bust minimum for May in 2009 (376,000).
Black Knight: National Mortgage Delinquency Rate Increased Sharply in May, Highest Rate since 2011
by Calculated Risk on 6/22/2020 11:59:00 AM
Note: Loans in forbearance are counted as delinquent in this survey, but these loans are not reported as delinquent to the credit bureaus.
From Black Knight: Black Knight: Mortgage Delinquencies Increase Another 20% in May to Hit Highest Level Since 2011, But June Payment Data Suggests Rise May Be Cresting
• Another 723,000 homeowners became past due on their mortgages in May, pushing the national delinquency rate to its highest level in 8.5 yearsAccording to Black Knight's First Look report for March, the percent of loans delinquent increased 20.4% in May compared to April, and increased 131% year-over-year.
• There are now 4.3 million homeowners past due on their mortgages or in active foreclosure – including those in forbearance who have missed scheduled payments as part of their plans – up from 2 million at the end of March
• Serious delinquencies are on the rise as well, increasing by more than 50% over the past two months
• However, Black Knight’s McDash Flash Payment Tracker shows a higher share of payments have been made thus far in June than at the same time in May, suggesting the rise in delinquencies may be leveling off
• Both foreclosure starts and sales (completions), halted by COVID-19 moratoriums, remain at record lows
• The share of homeowners in active foreclosure has fallen to its lowest level on record since Black Knight began reporting the figure in January 2000 emphasis added
The percent of loans in the foreclosure process decreased 5.8% in May and were down 22.7% over the last year.
Black Knight reported the U.S. mortgage delinquency rate (loans 30 or more days past due, but not in foreclosure) was 7.76% in May, up from 6.45% in April.
The percent of loans in the foreclosure process decreased in May to 0.38% from 0.40% in April.
The number of delinquent properties, but not in foreclosure, is up 2,363,000 properties year-over-year, and the number of properties in the foreclosure process is down 55,000 properties year-over-year.
| Black Knight: Percent Loans Delinquent and in Foreclosure Process | ||||
|---|---|---|---|---|
| May 2020 | Apr 2020 | May 2019 | May 2018 | |
| Delinquent | 7.76% | 6.45% | 3.36% | 3.64% |
| In Foreclosure | 0.38% | 0.40% | 0.49% | 0.59% |
| Number of properties: | ||||
| Number of properties that are delinquent, but not in foreclosure: | 4,123,000 | 3,400,000 | 1,760,000 | 1,867,000 |
| Number of properties in foreclosure pre-sale inventory: | 200,000 | 211,000 | 255,000 | 303,000 |
| Total Properties | 4,324,000 | 3,611,000 | 2,015,000 | 2,171,000 |
NAR: Existing-Home Sales Decreased to 3.91 million in May, Rebound Expected in Coming Months
by Calculated Risk on 6/22/2020 10:09:00 AM
From the NAR: Existing-Home Sales Fall 9.7% in May While NAR Expects Strong Rebound in Coming Months
Existing-home sales fell in May, marking a three-month decline in sales as a result of the coronavirus outbreak, according to the National Association of Realtors®. Each of the four major regions witnessed dips in month-over-month and year-over-year sales, with the Northeast experiencing the greatest month-over-month drop.
Total existing-home sales, completed transactions that include single-family homes, townhomes, condominiums and co-ops, slumped 9.7% from April to a seasonally-adjusted annual rate of 3.91 million in May. Overall, sales fell year-over-year, down 26.6% from a year ago (5.33 million in May 2019).
...
Total housing inventory at the end of May totaled 1.55 million units, up 6.2% from April, and down 18.8% from one year ago (1.91 million). Unsold inventory sits at a 4.8-month supply at the current sales pace, up from 4.0 months in April and up from the 4.3-month figure recorded in May 2019.
emphasis added
 Click on graph for larger image.
This graph shows existing home sales, on a Seasonally Adjusted Annual Rate (SAAR) basis since 1993.
Sales in May (3.91 million SAAR) were down 9.7% from last month, and were 26.6% below the May 2019 sales rate.
The second graph shows nationwide inventory for existing homes.
 According to the NAR, inventory increased to 1.55 million in May from 1.46 million in April. Headline inventory is not seasonally adjusted, and inventory usually decreases to the seasonal lows in December and January, and peaks in mid-to-late summer.
The last graph shows the year-over-year (YoY) change in reported existing home inventory and months-of-supply. Since inventory is not seasonally adjusted, it really helps to look at the YoY change. Note: Months-of-supply is based on the seasonally adjusted sales and not seasonally adjusted inventory.
 Inventory was down 18.8% year-over-year in May compared to May 2019.
 Months of supply increased to 4.8 months in May.
This was below the consensus forecast. I'll have more later … but I expect closed sales to rebound in coming months.
Six High Frequency Indicators for a Recovery
by Calculated Risk on 6/22/2020 08:35:00 AM
These indicators are mostly for travel and entertainment - some of the sectors that will probably recover very slowly.
The TSA is providing daily travel numbers.
 Click on graph for larger image.
This data shows the daily total traveler throughput from the TSA for 2019 (Blue) and 2020 (Red).
On June 21st there were 590,456 travelers compared to 2,719,643 a year ago.
That is a decline of 78.3%. There has been a slow steady increase from the bottom, but air travel is still down significantly.
The second graph shows the year-over-year change in diners as tabulated by OpenTable for the US and several selected cities.
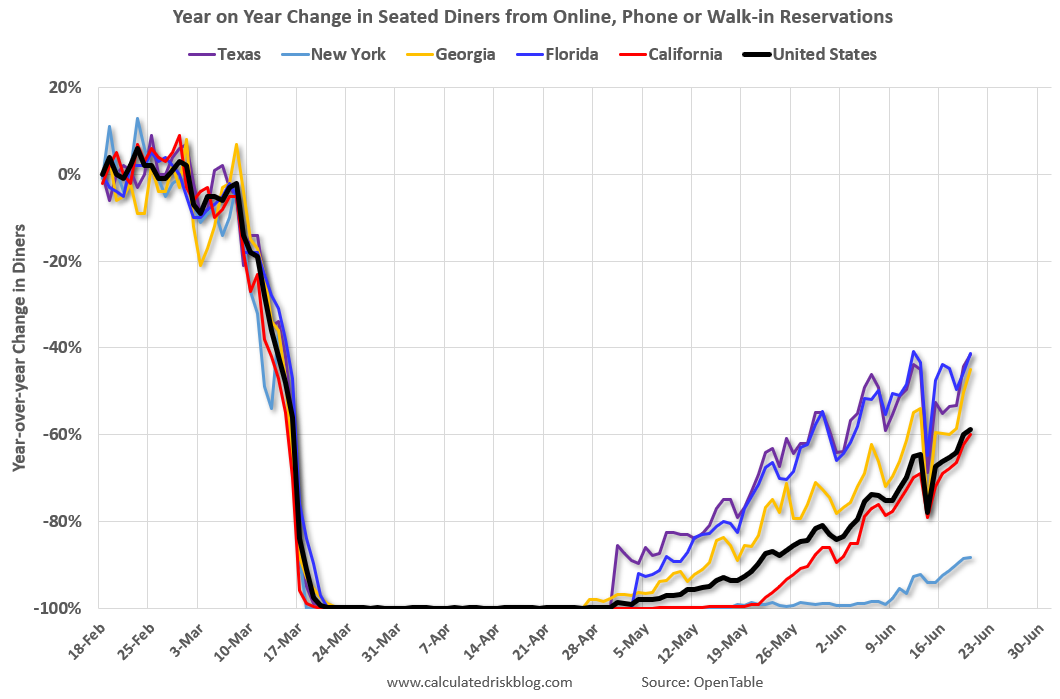 Thanks to OpenTable for providing this restaurant data:
This data is updated through June 20, 2020.
This data is "a sample of restaurants on the OpenTable network across all channels: online reservations, phone reservations, and walk-ins. For year-over-year comparisons by day, we compare to the same day of the week from the same week in the previous year."
Note that this data is for "only the restaurants that have chosen to reopen in a given market".
New York is still off 88%.
Florida is only down 41% YoY.
 This data shows domestic box office for each week (red) and the maximum and minimum for the previous four years. Data is from BoxOfficeMojo through June 18th.
Note that the data is noisy and depends on when blockbusters are released.
Movie ticket sales have picked up a little, but are still under $1 million per week (compared to usually around $300 million per week), and ticket sales have essentially been at zero for three months.
Most movie theaters are closed all across the country, and will probably reopen slowly (probably with limited seating at first).
The following graph shows the seasonal pattern for the hotel occupancy rate using the four week average.
 The red line is for 2020, dash light blue is 2019, blue is the median, and black is for 2009 (the worst year probably since the Great Depression for hotels).
2020 was off to a solid start, however, COVID-19 has crushed hotel occupancy.
Notes: Y-axis doesn't start at zero to better show the seasonal change.
Usually hotel occupancy starts to pick up seasonally in early June. So even though the occupancy rate was up slightly compared to last week, the year-over-year decline was about the same this week as the previous two weeks (43.4% decline vs. 45.3% last week, and 43.2% decline two weeks ago).
 This graph, based on weekly data from the U.S. Energy Information Administration (EIA), shows the year-over-year change in gasoline consumption.
At one point, gasoline consumption was off almost 50% YoY.
As of June 12th, gasoline consumption was off about 21% YoY (about 79% of normal). After rebounding from the low in early April, gasoline consumption has remained down about 20% YoY since early May.
The final graph is from Apple mobility. From Apple: "This data is generated by counting the number of requests made to Apple Maps for directions in select countries/regions, sub-regions, and cities." This is just a general guide - people that regularly commute probably don't ask for directions.
 This data is through June 20th for the United States and several selected cities.
IMPORTANT: All data is relative to January 13, 2020. This data is NOT Seasonally Adjusted. People walk and drive more when the weather is nice, so I'm just using the transit data.
According to the Apple data directions requests, public transit in the US is still only about 46% of the January level. It is at 33% in New York, and 61% in Houston.
Chicago Fed National Activity "Suggests Economic Growth Increased Substantially in May"
by Calculated Risk on 6/22/2020 08:34:00 AM
From the Chicago Fed: Index Suggests Economic Growth Increased Substantially in May
Led by improvements in production- and employment-related indicators, the Chicago Fed National Activity Index (CFNAI) rose to +2.61 in May from –17.89 in April. All four broad categories of indicators used to construct the index made positive contributions in May, and all four categories increased from April. The index’s three-month moving average, CFNAI-MA3, moved up to –6.65 in May from –7.50 in April.This graph shows the Chicago Fed National Activity Index (three month moving average) since 1967.
emphasis added
 Click on graph for larger image.
This suggests economic activity was in a recession starting in March (using the three-month average).
According to the Chicago Fed:
The index is a weighted average of 85 indicators of growth in national economic activity drawn from four broad categories of data: 1) production and income; 2) employment, unemployment, and hours; 3) personal consumption and housing; and 4) sales, orders, and inventories.
...
A zero value for the monthly index has been associated with the national economy expanding at its historical trend (average) rate of growth; negative values with below-average growth (in standard deviation units); and positive values with above-average growth.
Sunday, June 21, 2020
Monday: Existing Home Sales
by Calculated Risk on 6/21/2020 06:54:00 PM
Weekend:
• Schedule for Week of June 21, 2020
Monday:
• At 8:30 AM ET, Chicago Fed National Activity Index for May. This is a composite index of other data.
• At 10:00 AM, Existing Home Sales for May from the National Association of Realtors (NAR). The consensus is for 4.10 million SAAR, down from 4.33 million. Housing economist Tom Lawler expects the NAR to report sales of 3.8 million SAAR for May.
From CNBC: Pre-Market Data and Bloomberg futures S&P 500 are down 38 and DOW futures are down 325 (fair value).
Oil prices were up over the last week with WTI futures at $39.41 per barrel and Brent at $42.13 barrel. A year ago, WTI was at $57, and Brent was at $66 - so WTI oil prices are down about 30% year-over-year.
Here is a graph from Gasbuddy.com for nationwide gasoline prices. Nationally prices are at $2.13 per gallon. A year ago prices were at $2.66 per gallon, so gasoline prices are down $0.53 per gallon year-over-year.
June 21 COVID-19 Test Results
by Calculated Risk on 6/21/2020 05:59:00 PM
Note: I started posting this graph when the US was doing a few thousand tests per day. Clearly the US was way under testing early in the pandemic. I'll continue posting this graph daily at least until the percent positive is continuously under 3% and the daily positive is significantly lower than today.
The US is now conducting over 500,000 tests per day, and that might be enough to allow test-and-trace in some areas. Based on the experience of other countries, the percent positive needs to be well under 5% to really push down new infections, so the US still needs to increase the number of tests per day significantly.
According to Dr. Jha of Harvard's Global Health Institute, the US might need more than 900,000 tests per day .
There were 518,347 test results reported over the last 24 hours.
There were 27,465 positive tests.
 Click on graph for larger image.
This data is from the COVID Tracking Project.
The percent positive over the last 24 hours was 5.3% (red line).
For the status of contact tracing by state, check out testandtrace.com.
Saturday, June 20, 2020
June 20 COVID-19 Test Results; Most Positive Results Since May 1st
by Calculated Risk on 6/20/2020 05:38:00 PM
Note: I started posting this graph when the US was doing a few thousand tests per day. Clearly the US was way under testing early in the pandemic. I'll continue posting this graph daily at least until the percent positive is continuously under 3% and the daily positive is significantly lower than today.
The US is now conducting over 500,000 tests per day, and that might be enough to allow test-and-trace in some areas. Based on the experience of other countries, the percent positive needs to be well under 5% to really push down new infections, so the US still needs to increase the number of tests per day significantly.
According to Dr. Jha of Harvard's Global Health Institute, the US might need more than 900,000 tests per day .
There were 583,940 test results reported over the last 24 hours. This was a new daily high for test results.
There were 32,325 positive tests, the most since May 1st, and the second consecutive day over 30,000.
 Click on graph for larger image.
This data is from the COVID Tracking Project.
The percent positive over the last 24 hours was 5.5% (red line).
For the status of contact tracing by state, check out testandtrace.com.
Existing Home Sales: Lawler vs. the Consensus
by Calculated Risk on 6/20/2020 11:14:00 AM
Housing economist Tom Lawler has been sending me his predictions of what the NAR will report for 10 years. And he has graciously allowed me to share his predictions with the readers of this blog.
The table below shows the consensus for each month, Lawler's predictions, and the NAR's initially reported level of sales.
Lawler hasn't always been closer than the consensus, but usually when there has been a fairly large spread between Lawler's estimate and the "consensus", Lawler has been closer.
The NAR is scheduled to release Existing Home Sales for May at 10:00 AM, Monday, June 22nd.
The consensus is for 4.10 million SAAR in May, down from 4.33 million in April. Tom Lawler estimates the NAR will report sales of 3.8 million SAAR and that inventory will be down about 20% year-over-year. Based on Lawler's estimate, I expect existing home sales to be below the consensus in May.
The consensus was 4.38 million SAAR for May, but moved down sharply after Lawler released his projections. This happens frequently - analysts change their outlook based on Lawler's projections.
NOTE: There have been times when Lawler "missed", but then he pointed out an apparent error in the NAR data - and the subsequent revision corrected that error. As an example, see: The “Curious Case” of Existing Home Sales in the South in April
Over the last 10 years, the consensus average miss was 140 thousand, and Lawler's average miss was 69 thousand.
| Existing Home Sales, Forecasts and NAR Report millions, seasonally adjusted annual rate basis (SAAR) | |||
|---|---|---|---|
| Month | Consensus | Lawler | NAR reported1 |
| May-10 | 6.20 | 5.83 | 5.66 |
| Jun-10 | 5.30 | 5.30 | 5.37 |
| Jul-10 | 4.66 | 3.95 | 3.83 |
| Aug-10 | 4.10 | 4.10 | 4.13 |
| Sep-10 | 4.30 | 4.50 | 4.53 |
| Oct-10 | 4.50 | 4.46 | 4.43 |
| Nov-10 | 4.85 | 4.61 | 4.68 |
| Dec-10 | 4.90 | 5.13 | 5.28 |
| Jan-11 | 5.20 | 5.17 | 5.36 |
| Feb-11 | 5.15 | 5.00 | 4.88 |
| Mar-11 | 5.00 | 5.08 | 5.10 |
| Apr-11 | 5.20 | 5.15 | 5.05 |
| May-11 | 4.75 | 4.80 | 4.81 |
| Jun-11 | 4.90 | 4.71 | 4.77 |
| Jul-11 | 4.92 | 4.69 | 4.67 |
| Aug-11 | 4.75 | 4.92 | 5.03 |
| Sep-11 | 4.93 | 4.83 | 4.91 |
| Oct-11 | 4.80 | 4.86 | 4.97 |
| Nov-11 | 5.08 | 4.40 | 4.42 |
| Dec-11 | 4.60 | 4.64 | 4.61 |
| Jan-12 | 4.69 | 4.66 | 4.57 |
| Feb-12 | 4.61 | 4.63 | 4.59 |
| Mar-12 | 4.62 | 4.59 | 4.48 |
| Apr-12 | 4.66 | 4.53 | 4.62 |
| May-12 | 4.57 | 4.66 | 4.55 |
| Jun-12 | 4.65 | 4.56 | 4.37 |
| Jul-12 | 4.50 | 4.47 | 4.47 |
| Aug-12 | 4.55 | 4.87 | 4.82 |
| Sep-12 | 4.75 | 4.70 | 4.75 |
| Oct-12 | 4.74 | 4.84 | 4.79 |
| Nov-12 | 4.90 | 5.10 | 5.04 |
| Dec-12 | 5.10 | 4.97 | 4.94 |
| Jan-13 | 4.90 | 4.94 | 4.92 |
| Feb-13 | 5.01 | 4.87 | 4.98 |
| Mar-13 | 5.03 | 4.89 | 4.92 |
| Apr-13 | 4.92 | 5.03 | 4.97 |
| May-13 | 5.00 | 5.20 | 5.18 |
| Jun-13 | 5.27 | 4.99 | 5.08 |
| Jul-13 | 5.13 | 5.33 | 5.39 |
| Aug-13 | 5.25 | 5.35 | 5.48 |
| Sep-13 | 5.30 | 5.26 | 5.29 |
| Oct-13 | 5.13 | 5.08 | 5.12 |
| Nov-13 | 5.02 | 4.98 | 4.90 |
| Dec-13 | 4.90 | 4.96 | 4.87 |
| Jan-14 | 4.70 | 4.67 | 4.62 |
| Feb-14 | 4.64 | 4.60 | 4.60 |
| Mar-14 | 4.56 | 4.64 | 4.59 |
| Apr-14 | 4.67 | 4.70 | 4.65 |
| May-14 | 4.75 | 4.81 | 4.89 |
| Jun-14 | 4.99 | 4.96 | 5.04 |
| Jul-14 | 5.00 | 5.09 | 5.15 |
| Aug-14 | 5.18 | 5.12 | 5.05 |
| Sep-14 | 5.09 | 5.14 | 5.17 |
| Oct-14 | 5.15 | 5.28 | 5.26 |
| Nov-14 | 5.20 | 4.90 | 4.93 |
| Dec-14 | 5.05 | 5.15 | 5.04 |
| Jan-15 | 5.00 | 4.90 | 4.82 |
| Feb-15 | 4.94 | 4.87 | 4.88 |
| Mar-15 | 5.04 | 5.18 | 5.19 |
| Apr-15 | 5.22 | 5.20 | 5.04 |
| May-15 | 5.25 | 5.29 | 5.35 |
| Jun-15 | 5.40 | 5.45 | 5.49 |
| Jul-15 | 5.41 | 5.64 | 5.59 |
| Aug-15 | 5.50 | 5.54 | 5.31 |
| Sep-15 | 5.35 | 5.56 | 5.55 |
| Oct-15 | 5.41 | 5.33 | 5.36 |
| Nov-15 | 5.32 | 4.97 | 4.76 |
| Dec-15 | 5.19 | 5.36 | 5.46 |
| Jan-16 | 5.32 | 5.36 | 5.47 |
| Feb-16 | 5.30 | 5.20 | 5.08 |
| Mar-16 | 5.27 | 5.27 | 5.33 |
| Apr-16 | 5.40 | 5.44 | 5.45 |
| May-16 | 5.64 | 5.55 | 5.53 |
| Jun-16 | 5.48 | 5.62 | 5.57 |
| Jul-16 | 5.52 | 5.41 | 5.39 |
| Aug-16 | 5.44 | 5.49 | 5.33 |
| Sep-16 | 5.35 | 5.55 | 5.47 |
| Oct-16 | 5.44 | 5.47 | 5.60 |
| Nov-16 | 5.54 | 5.60 | 5.61 |
| Dec-16 | 5.54 | 5.55 | 5.49 |
| Jan-17 | 5.55 | 5.60 | 5.69 |
| Feb-17 | 5.55 | 5.41 | 5.48 |
| Mar-17 | 5.61 | 5.74 | 5.71 |
| Apr-17 | 5.67 | 5.56 | 5.57 |
| May-17 | 5.55 | 5.65 | 5.62 |
| Jun-17 | 5.58 | 5.59 | 5.52 |
| Jul-17 | 5.57 | 5.38 | 5.44 |
| Aug-17 | 5.48 | 5.39 | 5.35 |
| Sep-17 | 5.30 | 5.38 | 5.39 |
| Oct-17 | 5.30 | 5.60 | 5.48 |
| Nov-17 | 5.52 | 5.77 | 5.81 |
| Dec-17 | 5.75 | 5.66 | 5.57 |
| Jan-18 | 5.65 | 5.48 | 5.38 |
| Feb-18 | 5.42 | 5.44 | 5.54 |
| Mar-18 | 5.28 | 5.51 | 5.60 |
| Apr-18 | 5.60 | 5.48 | 5.46 |
| May-18 | 5.56 | 5.47 | 5.43 |
| Jun-18 | 5.45 | 5.35 | 5.38 |
| Jul-18 | 5.43 | 5.40 | 5.34 |
| Aug-18 | 5.36 | 5.36 | 5.34 |
| Sep-18 | 5.30 | 5.20 | 5.15 |
| Oct-18 | 5.20 | 5.31 | 5.22 |
| Nov-18 | 5.19 | 5.23 | 5.32 |
| Dec-18 | 5.24 | 4.97 | 4.99 |
| Jan-19 | 5.05 | 4.92 | 4.94 |
| Feb-19 | 5.08 | 5.46 | 5.51 |
| Mar-19 | 5.30 | 5.40 | 5.21 |
| Apr-19 | 5.36 | 5.31 | 5.19 |
| May-19 | 5.29 | 5.40 | 5.34 |
| Jun-19 | 5.34 | 5.25 | 5.27 |
| Jul-19 | 5.39 | 5.40 | 5.42 |
| Aug-19 | 5.38 | 5.42 | 5.49 |
| Sep-19 | 5.45 | 5.36 | 5.38 |
| Oct-19 | 5.49 | 5.36 | 5.46 |
| Nov-19 | 5.45 | 5.43 | 5.35 |
| Dec-19 | 5.43 | 5.40 | 5.54 |
| Jan-20 | 5.45 | 5.42 | 5.46 |
| Feb-20 | 5.50 | 5.58 | 5.77 |
| Mar-20 | 5.30 | 5.25 | 5.27 |
| Apr-20 | 4.30 | 4.17 | 4.33 |
| May-20 | 4.10 | 3.80 | NA |
| 1NAR initially reported before revisions. | |||
Schedule for Week of June 21, 2020
by Calculated Risk on 6/20/2020 08:11:00 AM
The key reports this week are the third estimate of Q1 GDP, May New and Existing Home Sales, and Personal Income and Outlays for May.
For manufacturing, the June Richmond and Kansas City Fed manufacturing surveys will be released.
8:30 AM ET: Chicago Fed National Activity Index for May. This is a composite index of other data.
 10:00 AM: Existing Home Sales for May from the National Association of Realtors (NAR). The consensus is for 4.10 million SAAR, down from 4.33 million.
The graph shows existing home sales from 1994 through the report last month.
Housing economist Tom Lawler expects the NAR to report sales of 3.8 million SAAR for May.
 10:00 AM: New Home Sales for May from the Census Bureau.
 This graph shows New Home Sales since 1963. The dashed line is the sales rate for last month.
The consensus is for 640 thousand SAAR, up from 623 thousand in April.
10:00 AM: Richmond Fed Survey of Manufacturing Activity for June.
7:00 AM ET: The Mortgage Bankers Association (MBA) will release the results for the mortgage purchase applications index.
9:00 AM: FHFA House Price Index for April 2019. This was originally a GSE only repeat sales, however there is also an expanded index.
During the day: The AIA's Architecture Billings Index for May (a leading indicator for commercial real estate).
8:30 AM: The initial weekly unemployment claims report will be released. The consensus is for a 1.300 million initial claims, down from 1.508 million the previous week.
8:30 AM: Durable Goods Orders for May from the Census Bureau. The consensus is for a 10.6% increase in durable goods orders.
8:30 AM: Gross Domestic Product, 1st quarter 2020 (Third estimate). The consensus is that real GDP decreased 5.0% annualized in Q1, unchanged from the second estimate of a 5.0% decrease.
11:00 AM: the Kansas City Fed manufacturing survey for June. This is the last of regional manufacturing surveys for June.
8:30 AM ET: Personal Income and Outlays, May 2020. The consensus is for a 6.0% decrease in personal income, and for a 9.0% increase in personal spending. And for the Core PCE price index to increase 0.2%.
10:00 AM: University of Michigan's Consumer sentiment index (Final for June). The consensus is for a reading of 78.9.


